
Brian Daigle
(202) 205-2458
Brian.Daigle@usitc.gov
U.S. Exports
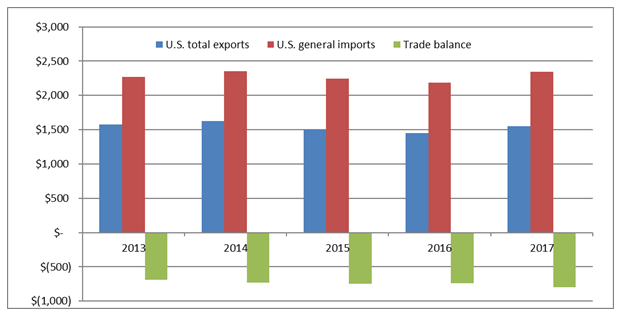
In 2017, U.S. total exports rose by $95.7 billion to $1.5 trillion (6.6 percent), a turnaround from the previous year. In 2016 exports declined by $52.1 billion, or 3.5 percent; exports in all 10 sectors increased in 2017, though the size of the increase varied. Nearly one-half of the 2017 increase in U.S. exports was due to a rise in the quantity and value of U.S. energy exports, which in value terms increased $44.8 billion (45.5 percent) to $143.2 billion in 2017.[1] Other sectors that experienced significant increases in exports included chemicals (up $9.2 billion), minerals and metals (up $7.8 billion), machinery ($7.8 billion), and electronic products ($7.9 billion). Combined, these five sectors accounted for 80.9 percent of the increase in U.S. exports in 2017.
Table US.1: U.S. total exports, general imports, and merchandise trade balance, by major industry/commodity sectors, 2013–17
|
Million $
|
|||||||
|---|---|---|---|---|---|---|---|
| Item |
2013
|
2014
|
2015
|
2016
|
2017
|
Absolute change,
2016–17
|
Percent
change,
2016–17
|
| U.S. total exports: |
|
|
|
|
|
|
|
| Agricultural products |
157,633
|
164,429
|
146,644
|
148,683
|
153,116
|
4,433
|
3.0
|
| Forest products |
40,839
|
41,169
|
39,059
|
37,707
|
39,698
|
1,991
|
5.3
|
| Chemicals and related products |
231,422
|
235,020
|
227,676
|
218,089
|
227,270
|
9,181
|
4.2
|
| Energy-related products |
154,463
|
161,755
|
110,225
|
98,418
|
143,236
|
44,818
|
45.5
|
| Textiles and apparel |
23,318
|
23,985
|
23,272
|
21,656
|
22,082
|
426
|
2.0
|
| Footwear |
1,391
|
1,456
|
1,464
|
1,368
|
1,430
|
62
|
4.5
|
| Minerals and metals |
160,510
|
152,910
|
135,667
|
128,684
|
136,452
|
7,769
|
6.0
|
| Machinery |
139,616
|
145,981
|
138,765
|
128,097
|
135,945
|
7,848
|
6.1
|
| Transportation equipment |
322,152
|
336,439
|
327,401
|
320,022
|
325,434
|
5,412
|
1.7
|
| Electronic products |
261,190
|
267,833
|
264,119
|
260,407
|
268,278
|
7,870
|
3.0
|
| Miscellaneous manufactures |
43,842
|
47,636
|
47,366
|
47,754
|
49,138
|
1,383
|
2.9
|
| Special provisions |
42,140
|
43,260
|
41,444
|
40,125
|
44,655
|
4,530
|
11.3
|
| Total |
1,578,517
|
1,621,874
|
1,503,101
|
1,451,011
|
1,546,733
|
95,722
|
6.6
|
| U.S. general imports: |
|
|
|
|
|
|
|
| Agricultural products |
126,657
|
136,341
|
136,947
|
139,153
|
147,406
|
8,253
|
5.9
|
| Forest products |
39,984
|
42,213
|
42,383
|
43,118
|
44,856
|
1,738
|
4.0
|
| Chemicals and related products |
236,678
|
251,529
|
260,293
|
259,846
|
268,112
|
8,266
|
3.2
|
| Energy-related products |
384,142
|
351,626
|
194,132
|
157,826
|
198,096
|
40,270
|
25.5
|
| Textiles and apparel |
118,003
|
121,688
|
126,538
|
120,265
|
121,423
|
1,158
|
1.0
|
| Footwear |
24,811
|
26,018
|
27,650
|
25,634
|
25,654
|
20
|
0.1
|
| Minerals and metals |
190,442
|
205,500
|
189,230
|
183,522
|
200,714
|
17,192
|
9.4
|
| Machinery |
170,227
|
185,529
|
185,884
|
179,537
|
196,414
|
16,878
|
9.4
|
| Transportation equipment |
375,526
|
404,024
|
426,225
|
418,286
|
434,894
|
16,608
|
4.0
|
| Electronic products |
421,656
|
439,109
|
449,793
|
449,951
|
484,271
|
34,321
|
7.6
|
| Miscellaneous manufactures |
109,936
|
114,391
|
124,817
|
124,973
|
130,453
|
5,481
|
4.4
|
| Special provisions |
69,925
|
78,388
|
84,291
|
85,695
|
90,610
|
4,915
|
5.7
|
| Total |
2,267,987
|
2,356,356
|
2,248,183
|
2,187,805
|
2,342,905
|
155,100
|
7.1
|
| U.S. merchandise trade balance: |
|
|
|
|
|
|
|
| Agricultural products |
30,976
|
28,088
|
9,697
|
9,530
|
5,710
|
-3,820
|
-40.1
|
| Forest products |
856
|
-1,044
|
-3,324
|
-5,411
|
-5,158
|
253
|
4.7
|
| Chemicals and related products |
-5,256
|
-16,509
|
-32,617
|
-41,757
|
-40,843
|
915
|
2.2
|
| Energy-related products |
-229,679
|
-189,871
|
-83,907
|
-59,408
|
-54,860
|
4,548
|
7.7
|
| Textiles and apparel |
-94,685
|
-97,702
|
-103,265
|
-98,609
|
-99,341
|
-733
|
-0.7
|
| Footwear |
-23,420
|
-24,562
|
-26,186
|
-24,266
|
-24,225
|
41
|
0.2
|
| Minerals and metals |
-29,933
|
-52,591
|
-53,563
|
-54,838
|
-64,262
|
-9,424
|
-17.2
|
| Machinery |
-30,610
|
-39,549
|
-47,119
|
-51,440
|
-60,470
|
-9,030
|
-17.6
|
| Transportation equipment |
-53,374
|
-67,584
|
-98,824
|
-98,264
|
-109,460
|
-11,196
|
-11.4
|
| Electronic products |
-160,466
|
-171,276
|
-185,674
|
-189,543
|
-215,994
|
-26,450
|
-14.0
|
| Miscellaneous manufactures |
-66,094
|
-66,755
|
-77,452
|
-77,218
|
-81,316
|
-4,098
|
-5.3
|
| Special provisions |
-27,785
|
-35,128
|
-42,847
|
-45,570
|
-45,955
|
-385
|
-0.8
|
| Total |
-689,470
|
-734,482
|
-745,082
|
-736,794
|
-796,172
|
-59,378
|
-8.1
|
Source: Compiled from official statistics of the U.S. Department of Commerce.
Note: Import values are based on customs value; export values are based on free along ship value, U.S. port of export. Calculations based on unrounded data. Sectors are ordered by the level of processing of the products classified therein.
Figure US.1: U.S. total exports and general imports both increased in 2017, although general imports increased at a higher rate and returned to levels last experienced in 2014 (billion $).
Source: USITC DataWeb/USDOC (accessed February 12, 2018).
Other sectors experienced smaller increases in exports. U.S. exports of transportation equipment, the largest U.S. export sector of this report, increased $5.4 billion (up 1.7 percent). U.S. agricultural product exports rose by $4.4 billion (3 percent), forest products exports rose by $2 billion (5.3 percent), textiles and apparel sector exports increased $426 million (2 percent), and footwear sector exports rose $62 million (4.5 percent).
Table US.2: All merchandise sectors: Leading changes in U.S. exports and imports, 2013–17
|
Million $
|
|||||||
|---|---|---|---|---|---|---|---|
| Item |
2013
|
2014
|
2015
|
2016
|
2017
|
Absolute change,
2016–17
|
Percent
change,
2016–17
|
| U.S. total exports: |
|
|
|
|
|
|
|
| Increases: |
|
|
|
|
|
|
|
|
Energy-related products:
Petroleum products (EP005)
|
121,037
|
119,712
|
80,576
|
68,481
|
85,785
|
17,304
|
25.3
|
|
Crude petroleum (EP004)
|
5,099
|
12,219
|
8,821
|
9,423
|
21,825
|
12,402
|
131.6
|
|
Natural gas and components (EP006)
|
13,031
|
17,885
|
12,004
|
13,900
|
23,225
|
9,325
|
67.1
|
|
Certain organic chemicals (CH006)
|
20,024
|
19,322
|
16,723
|
15,388
|
18,013
|
2,625
|
17.1
|
|
Motor vehicles (TE009)
|
74,096
|
77,763
|
70,464
|
69,657
|
71,632
|
1,975
|
2.8
|
| Decreases: |
|
|
|
|
|
|
|
|
Aircraft, spacecraft, and related equipment (TE013)
|
113,852
|
124,214
|
129,413
|
131,985
|
129,640
|
-2,345
|
-1.8
|
|
Medicinal chemicals (CH019)
|
51,838
|
54,717
|
58,468
|
57,122
|
55,475
|
-1,647
|
-2.9
|
|
Minerals and metals:
Aluminum mill products (MM038)
|
6,142
|
6,080
|
5,928
|
6,811
|
5,631
|
-1,179
|
-17.3
|
|
Copper ores and concentrates (MM004)
|
2,601
|
3,238
|
3,083
|
2,413
|
1,715
|
-698
|
-28.9
|
| All other |
1,170,795
|
1,186,725
|
1,117,623
|
1,075,832
|
1,133,792
|
57,961
|
5.4
|
| Total |
1,578,517
|
1,621,874
|
1,503,101
|
1,451,011
|
1,546,733
|
95,722
|
6.6
|
| U.S. general imports: |
|
|
|
|
|
|
|
| Increases: |
|
|
|
|
|
|
|
|
Energy-related products:
Crude petroleum (EP004)
|
273,836
|
246,969
|
126,073
|
101,841
|
132,945
|
31,103
|
30.5
|
|
Petroleum products (EP005)
|
89,198
|
79,764
|
51,512
|
41,167
|
48,430
|
7,263
|
17.6
|
|
Computers, peripherals, and parts (EL017)
|
121,106
|
121,512
|
119,602
|
112,539
|
124,108
|
11,570
|
10.3
|
|
Transportation equipment:
Motor vehicles (TE009)
|
176,789
|
183,158
|
197,764
|
200,727
|
208,616
|
7,888
|
3.9
|
|
Aircraft, spacecraft, and related equipment (TE013)
|
29,937
|
35,006
|
35,838
|
31,444
|
31,162
|
-283
|
-0.9
|
|
Medicinal chemicals (CH019)
|
85,436
|
93,436
|
109,759
|
113,175
|
112,083
|
-1,091
|
-1.0
|
| Decreases: |
|
|
|
|
|
|
|
|
Medicinal chemicals (CH019)
|
85,436
|
93,436
|
109,759
|
113,175
|
112,083
|
-1,091
|
-1.0
|
|
Certain motor-vehicle parts (TE010)
|
74,677
|
82,106
|
86,144
|
85,888
|
85,287
|
-601
|
-0.7
|
Some sectors with the largest increases in U.S. exports overall nonetheless experienced significant export declines in certain subsectors. For example, while U.S. transportation equipment exports increased overall by $5.4 billion, exports of certain aircraft declined $2.3 billion and aircraft engine exports fell by $532 million due to the expiration of aviation contracts. Similarly, while exports of chemicals rose overall by $9.2 billion, the expiration of a number of medical patents led to a $1.6 billion decline in medicinal chemical (pharmaceutical) exports. Finally, even though minerals and metals exports increased by $7.8 billion in 2017, exports of aluminum bars and mill products fell, as did exports of copper ores.
U.S. Imports
In 2017, U.S. general imports rose in all sectors by a combined $155.1 billion (7.1 percent) to $2.34 trillion. As was the case with U.S. exports, the largest increase occurred in the energy-related product sector. Imports of energy-related products rose $40.3 billion to $198.1 billion (25.5 percent), constituting a little over one-fourth of the increase in the value of U.S. imports, due to an increase in both the price and the volume of energy-related products. The majority of the rise in the value of energy-related product imports occurred in crude petroleum, imports of which rose $31.1 billion to $132.9 billion (an increase of 30.5 percent). Other sectors that experienced substantial increases in U.S. imports include electronic products ($34.3 billion), minerals and metals ($17.2 billion), machinery ($16.9 billion), and transportation equipment ($16.6 billion).
Other sectors, particularly chemicals and agricultural products, also experienced a rise in general imports in 2017. Agricultural imports rose $8.3 billion (5.9 percent), and chemical imports rose $8.3 billion (3.2 percent), despite a $1.1 billion decline in medicinal chemical imports (1 percent).
Trade with Major Trading Partners
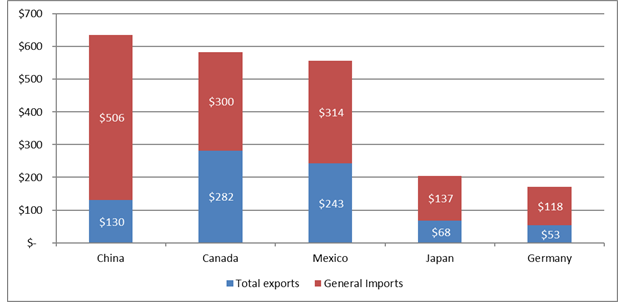
As has been the case for the past several years, the top trading partners with the United States were China, Canada, Mexico, Japan, and Germany. While China continued to be the largest source of imports to the U.S. economy, Canada maintained its position as the largest export destination for U.S. products (figure US.3), followed by Mexico and then China. In 2017, the value of U.S. exports to Canada ($282.5 billion) almost equaled exports to the entire European Union ($283.5 billion), while U.S. exports to Mexico reached their highest level in the 2013–17 period ($243 billion in 2017).
Figure US.2: Total trade between the United States and its five largest single-country trading partners, 2017 (billion $)
Source: USITC DataWeb/USDOC (accessed February 12, 2018).
On the export side, the United States increased exports to its three largest trading partners. U.S. exports to China rose 12.8 percent ($14.8 billion); to Canada, 5.9 percent ($15.7 billion); and to Mexico, 5.8 percent ($13.3 billion). Combined, these three economies accounted for nearly one-half of the increase in global U.S. exports (45.7 percent). Exports to other major trading nations rose as well, with the largest percentage increase experienced by India (a 18.7 percent increase), South Korea (14.1 percent), Italy (9.7 percent), Germany (8.4 percent), and Japan (7.1 percent). However, U.S. exports declined in 2017 to one major traditional market for U.S. exports, the members of the Organization of the Petroleum Exporting Countries (OPEC). U.S. exports to OPEC countries declined by $6.1 billion (9.4 percent).
At the sector level, the increase in U.S. exports to the major U.S. trading partners was principally concentrated in electronics, transportation equipment, machinery, and energy-related products. Some of the largest increases in exports to Canada, for example, were in motor vehicles (a $2.2 billion increase, 8.1 percent above the previous year), construction equipment ($1.2 billion), and consumer electronics ($786 million). Among U.S. exports to China, the leading U.S. export increases were in crude petroleum ($4.1 billion increase), motor vehicles ($1.8 billion), and aircraft ($1.7 billion).
Many of the significant declines in U.S. exports to major trading partners occurred in the machinery, equipment, and metals and minerals sectors. In South Korea, the largest declines in U.S. exports occurred in aircraft ($1.9 billion), arms and ammunition ($222 million), construction and mining equipment ($140 million), and organic commodity chemicals ($110 million). Despite the fact that total U.S. exports to Mexico increased, there were U.S. export declines to Mexico in certain sectors, including computers and computer parts ($752 million), telecommunications equipment ($708 million), copper ores ($671 million), and motor vehicles ($527 million). Similarly, although total U.S. exports to China and Canada also increased, U.S. exports in certain mineral sectors declined (particularly unrefined copper in China and precious metals in Canada).
Table US.3: All merchandise sectors: U.S. total exports, general imports, and merchandise trade balance, by selected trading partners and groups, 2013–17
|
Million $
|
|||||||
|---|---|---|---|---|---|---|---|
| Item |
2013
|
2014
|
2015
|
2016
|
2017
|
Absolute change,
2016–17
|
Percent
change,
2016–17
|
| U.S. total exports: |
|
|
|
|
|
|
|
| China |
121,746
|
123,657
|
115,932
|
115,602
|
130,370
|
14,767
|
12.8
|
| Canada |
300,755
|
312,817
|
280,855
|
266,797
|
282,472
|
15,674
|
5.9
|
| Mexico |
225,954
|
241,007
|
236,204
|
229,702
|
242,989
|
13,287
|
5.8
|
| Japan |
65,237
|
66,892
|
62,393
|
63,236
|
67,696
|
4,460
|
7.1
|
| Germany |
47,363
|
49,419
|
49,945
|
49,363
|
53,493
|
4,129
|
8.4
|
| Korea |
41,649
|
44,650
|
43,484
|
42,309
|
48,277
|
5,967
|
14.1
|
| United Kingdom |
47,361
|
53,913
|
56,095
|
55,289
|
56,329
|
1,040
|
1.9
|
| France |
31,744
|
31,289
|
30,055
|
31,132
|
33,582
|
2,450
|
7.9
|
| India |
21,810
|
21,499
|
21,453
|
21,652
|
25,700
|
4,048
|
18.7
|
| Italy |
16,757
|
16,969
|
16,212
|
16,707
|
18,323
|
1,616
|
9.7
|
| All other |
658,139
|
659,762
|
590,473
|
559,220
|
587,504
|
28,284
|
5.1
|
| Total |
1,578,517
|
1,621,874
|
1,503,101
|
1,451,011
|
1,546,733
|
95,722
|
6.6
|
| EU-28 |
262,095
|
276,274
|
271,879
|
269,617
|
283,517
|
13,901
|
5.2
|
| OPEC |
85,795
|
83,525
|
73,249
|
65,310
|
59,196
|
-6,114
|
-9.4
|
| Latin America |
410,370
|
424,852
|
388,783
|
365,665
|
393,218
|
27,553
|
7.5
|
| Asia |
402,070
|
407,186
|
385,459
|
383,312
|
421,736
|
38,424
|
10.0
|
| Sub-Saharan Africa |
23,978
|
25,491
|
18,009
|
13,490
|
14,111
|
621
|
4.6
|
| U.S. general imports: |
|
|
|
|
|
|
|
| China |
440,430
|
468,475
|
483,189
|
462,618
|
505,597
|
42,979
|
9.3
|
| Canada |
332,504
|
349,286
|
296,230
|
277,756
|
299,975
|
22,220
|
8.0
|
| Mexico |
280,556
|
295,730
|
296,401
|
294,056
|
314,045
|
19,989
|
6.8
|
| Japan |
138,575
|
134,505
|
131,383
|
132,046
|
136,544
|
4,497
|
3.4
|
| Germany |
114,342
|
124,182
|
124,819
|
114,099
|
117,745
|
3,645
|
3.2
|
| Korea |
62,370
|
69,677
|
71,758
|
69,881
|
71,164
|
1,283
|
1.8
|
| United Kingdom |
52,741
|
54,689
|
57,993
|
54,272
|
53,075
|
-1,197
|
-2.2
|
| France |
45,706
|
47,105
|
47,752
|
46,710
|
48,888
|
2,178
|
4.7
|
| India |
41,810
|
45,358
|
44,790
|
46,032
|
48,631
|
2,599
|
5.6
|
| Italy |
38,709
|
42,378
|
44,164
|
45,273
|
49,963
|
4,690
|
10.4
|
| All other |
720,243
|
724,971
|
649,706
|
645,061
|
697,278
|
52,217
|
8.1
|
| Total |
2,267,987
|
2,356,356
|
2,248,183
|
2,187,805
|
2,342,905
|
155,100
|
7.1
|
| EU-28 |
387,510
|
420,609
|
427,537
|
416,377
|
434,933
|
18,556
|
4.5
|
| OPEC |
154,699
|
133,423
|
66,733
|
58,557
|
72,221
|
13,665
|
23.3
|
| Latin America |
438,985
|
445,985
|
412,255
|
401,708
|
430,007
|
28,299
|
7.0
|
| Asia |
865,470
|
914,154
|
943,615
|
928,054
|
994,200
|
66,146
|
7.1
|
| Sub-Saharan Africa |
39,294
|
26,785
|
18,841
|
20,144
|
24,895
|
4,751
|
23.6
|
| U.S. merchandise trade balance: |
|
|
|
|
|
|
|
| China |
-318,684
|
-344,818
|
-367,257
|
-347,016
|
-375,228
|
-28,212
|
-8.1
|
| Canada |
-31,749
|
-36,469
|
-15,375
|
-10,958
|
-17,504
|
-6,545
|
-59.7
|
| Mexico |
-54,602
|
-54,723
|
-60,197
|
-64,354
|
-71,057
|
-6,702
|
-10.4
|
| Japan |
-73,338
|
-67,613
|
-68,990
|
-68,810
|
-68,848
|
-38
|
-0.1
|
| Germany |
-66,978
|
-74,763
|
-74,873
|
-64,736
|
-64,252
|
484
|
0.7
|
| Korea |
-20,722
|
-25,027
|
-28,273
|
-27,572
|
-22,887
|
4,684
|
17.0
|
| United Kingdom |
-5,380
|
-776
|
-1,898
|
1,017
|
3,254
|
2,237
|
220.0
|
| France |
-13,963
|
-15,816
|
-17,697
|
-15,578
|
-15,306
|
272
|
1.7
|
| India |
-20,000
|
-23,859
|
-23,337
|
-24,380
|
-22,931
|
1,449
|
5.9
|
| Italy |
-21,952
|
-25,409
|
-27,951
|
-28,565
|
-31,640
|
-3,075
|
-10.8
|
| All other |
-62,104
|
-65,209
|
-59,233
|
-85,841
|
-109,774
|
-23,933
|
-27.9
|
| Total |
-689,470
|
-734,482
|
-745,082
|
-736,794
|
-796,172
|
-59,378
|
-8.1
|
| EU-28 |
-125,415
|
-144,334
|
-155,657
|
-146,760
|
-151,416
|
-4,655
|
-3.2
|
| OPEC |
-68,904
|
-49,898
|
6,515
|
6,754
|
-13,025
|
-19,779
|
(a)
|
| Latin America |
-28,615
|
-21,133
|
-23,472
|
-36,042
|
-36,789
|
-746
|
-2.1
|
| Asia |
-463,400
|
-506,968
|
-558,156
|
-544,742
|
-572,464
|
-27,722
|
-5.1
|
| Sub-Saharan Africa |
-15,316
|
-1,294
|
-832
|
-6,654
|
-10,784
|
-4,130
|
-62.1
|
Source: Compiled from official statistics of the U.S. Department of Commerce.
Note: Import values are based on customs value; export values are based on free along ship value, U.S. port of export. Calculations based on unrounded data. The countries shown are those with the largest total U.S. trade (U.S. imports plus U.S. exports) in these products in the current year. See appendix B for country group definitions.
aNot meaningful for purposes of comparison.
Like U.S. exports in 2017, U.S. imports from major trading partners also rose. Imports from China rose the most by value ($43 billion increase). U.S. imports from China rose by 9.3 percent; in 2017 the increase in percentage terms was second only to Italy among large U.S. trade partners (10.4 percent increase, $1.6 billion). The United States increased its imports from Canada by $22.2 billion (8 percent) and from Mexico by $20 billion (6.8 percent). The only major U.S. trading partner that showed a significant decline in imports was the United Kingdom (UK): imports from the UK fell by $1.2 billion (2.2 percent). As a result of the decrease in U.S. imports from the UK and the increase in U.S. exports to the UK, the U.S. trade surplus with the UK in 2016 more than doubled, from $1.5 billion in 2016 to $3.3 billion in 2017.
Increases in U.S. imports among larger trading partners were typically concentrated in machinery and equipment. The largest increase in imports from South Korea, for example, was in computers ($1.2 billion, 57.5 percent higher than the previous year). The biggest increase in imports from Mexico was in motor vehicles ($7.9 billion, 15.8 percent); from China, in telecommunications equipment ($11.7 billion increase to $73.1 billion). Canada was the exception to this trend; the largest increases in U.S. imports from Canada occurred in crude petroleum ($13.9 billion), petroleum products ($2.7 billion), and natural gas and components ($2.5 billion), followed by aluminum and steel products.
U.S. Trade Balance
The U.S. merchandise trade deficit with the rest of the world grew by $59.4 billion (8.1 percent) to $796.2 billion in 2017, representing both the highest level and the greatest yearly growth in the 2013–17 period. As was the case in each of the four preceding years (with the exception of forest products in 2013), the agricultural product sector was the only one with a trade surplus, though it fell to its lowest level in the five-year period ($5.7 billion). In some sectors—namely, forest products, chemicals and related products, footwear, and energy-related products—U.S. trade deficits fell slightly. In the energy-related products sector, for example, the trade deficit fell to $54.9 billion (a 7.7 percent decline from the previous year), steadily declining from the $230 billion deficit in energy-related products reached in 2013.
In other sectors, trade deficits expanded. Four sectors—mineral and metals, machinery, transportation equipment, and electronic products—contributed the most to the overall increase in the U.S. trade deficit. In the electronic products sector, the $26.5 billion increase in the trade deficit to $216 billion (a 14 percent increase) constituted roughly half of the trade balance deficit change from 2016. Combined, the four sectors above account for $56.1 billion of the total increase ($59.4 billion) in the trade deficit, though this was mitigated slightly by the reduction of trade deficits in other sectors.
In most cases, U.S. import growth exceeded U.S. export growth with major trading partners in 2017. Thus, U.S. merchandise trade deficits expanded with the United States’ top three trading markets. Particularly with Canada, the deficit increased by 59.7 percent, substantially more than the U.S. deficit with Mexico (a 10.4 percent increase) or China (an 8.1 percent increase). However, in some cases, such as with Japan, the increase in the merchandise trade deficit from 2016 to 2017 was negligible (up 0.1 percent). In other cases, U.S. trade deficits with some trading partners declined. For example, the U.S. trade deficit with South Korea declined substantially (down $4.7 billion, or 17 percent). U.S. trade deficits also declined with France (down $272 million), India ($1.4 billion), and Germany ($484 million), though the declines were small in percentage terms (1.7, 5.9, and 0.7 percent, respectively).
[1] This development will be explained in greater detail in the Energy and Related Products section of this report.