
Author: Cathy Jabara
Senior Economist
U.S. Exports
In 2014, U.S. exports grew by $43.9 billion (3 percent) to $1,623.4 billion, as exports in 9 of the 10 sectors reviewed in 2014 Trade Shifts increased (table US.2 and figure US.1). The transportation equipment sector recorded the greatest absolute increase in exports ($13.5 billion). Strong global demand for motor vehicles and for aircraft, spacecraft, and related equipment contributed to the growth in U.S. exports in this sector (table US.3). Minerals and metals was the only sector to record a decrease in the value of exports in 2014 (down $8.5 billion, or 5 percent). The decline in exports is attributed to lower prices for precious metals and decreased processed-mineral exports because of weak global economic growth and the increase in the value of the U.S. dollar in the last part of 2014.1
| Item |
2010
|
2011
|
Million $
2012 |
2013
|
2014
|
Absolute Change,
2013-14 |
Percent Change,
2013-14 |
|---|---|---|---|---|---|---|---|
|
U.S. total exports:
|
|||||||
|
Agricultural products
|
125,498 | 150,461 | 154,130 | 157,655 | 164,848 | 7,192 | 4.6 |
|
Forest products
|
37,699 | 40,849 | 39,832 | 40,835 | 41,280 | 445 | 1.1 |
|
Chemicals and related products
|
207,025 | 225,308 | 228,914 | 231,276 | 234,687 | 3,411 | 1.5 |
|
Energy-related products
|
87,109 | 137,176 | 143,356 | 154,575 | 162,553 | 7,977 | 5.2 |
|
Textiles and apparel
|
19,716 | 22,372 | 22,472 | 23,324 | 23,916 | 592 | 2.5 |
|
Footwear
|
1,105 | 1,290 | 1,332 | 1,391 | 1,449 | 58 | 4.2 |
|
Minerals and metals
|
128,405 | 165,012 | 164,013 | 161,636 | 153,122 | -8,515 | -5.3 |
|
Machinery
|
117,436 | 130,321 | 138,530 | 139,636 | 145,526 | 5,890 | 4.2 |
|
Transportation equipment
|
241,259 | 280,064 | 313,445 | 322,112 | 335,629 | 13,516 | 4.2 |
|
Electronic products
|
237,192 | 251,669 | 257,690 | 261,223 | 267,573 | 6,350 | 2.4 |
|
Miscellaneous manufactures
|
35,676 | 38,608 | 41,354 | 43,813 | 47,946 | 4,133 | 9.4 |
|
Special provisions
|
40,374 | 39,378 | 40,635 | 42,116 | 44,916 | 2,800 | 6.6 |
|
Total
|
1,278,495 | 1,482,508 | 1,545,703 | 1,579,593 | 1,623,443 | 43,850 | 2.8 |
|
U.S. general imports:
|
|||||||
|
Agricultural products
|
98,218 | 116,374 | 123,323 | 126,678 | 136,184 | 9,506 | 7.5 |
|
Forest products
|
35,775 | 36,274 | 37,071 | 39,996 | 42,092 | 2,096 | 5.2 |
|
Chemicals and related products
|
205,093 | 237,927 | 237,262 | 236,704 | 251,615 | 14,911 | 6.3 |
|
Energy-related products
|
360,138 | 458,764 | 428,235 | 384,153 | 349,955 | -34,198 | -8.9 |
|
Textiles and apparel
|
104,504 | 113,848 | 113,866 | 118,019 | 121,684 | 3,665 | 3.1 |
|
Footwear
|
20,903 | 22,654 | 23,887 | 24,810 | 26,014 | 1,203 | 4.8 |
|
Minerals and metals
|
157,246 | 193,651 | 195,080 | 190,435 | 205,082 | 14,648 | 7.7 |
|
Machinery
|
131,051 | 156,123 | 167,784 | 170,212 | 184,701 | 14,488 | 8.5 |
|
Transportation equipment
|
269,017 | 309,994 | 363,318 | 375,445 | 403,018 | 27,572 | 7.3 |
|
Electronic products
|
378,626 | 402,543 | 415,476 | 421,672 | 438,167 | 16,495 | 3.9 |
|
Miscellaneous manufactures
|
97,659 | 99,878 | 104,751 | 109,931 | 114,314 | 4,383 | 4 |
|
Special provisions
|
55,626 | 59,924 | 66,250 | 70,265 | 72,362 | 2,097 | 3 |
|
Total
|
1,913,857 | 2,207,954 | 2,276,302 | 2,268,321 | 2,345,187 | 76,866 | 3.4 |
|
U.S. merchandise trade balance:
|
|||||||
|
Agricultural products
|
27,280 | 34,087 | 30,807 | 30,978 | 28,664 | -2,314 | -7.5 |
|
Forest products
|
1,924 | 4,575 | 2,761 | 839 | -812 | -1,651 | (a) |
|
Chemicals and related products
|
1,932 | -12,619 | -8,348 | -5,429 | -16,928 | -11,499 | -211.8 |
|
Energy-related products
|
-273,029 | -321,588 | -284,878 | -229,577 | -187,402 | 42,175 | 18.4 |
|
Textiles and apparel
|
-84,788 | -91,475 | -91,394 | -94,696 | -97,768 | -3,073 | -3.2 |
|
Footwear
|
-19,797 | -21,364 | -22,555 | -23,419 | -24,564 | -1,145 | -4.9 |
|
Minerals and metals
|
-28,841 | -28,640 | -31,068 | -28,798 | -51,961 | -23,162 | -80.4 |
|
Machinery
|
-13,615 | -25,803 | -29,253 | -30,576 | -39,175 | -8,599 | -28.1 |
|
Transportation equipment
|
-27,757 | -29,930 | -49,873 | -53,333 | -67,389 | -14,056 | -26.4 |
|
Electronic products
|
-141,434 | -150,874 | -157,786 | -160,449 | -170,594 | -10,145 | -6.3 |
|
Miscellaneous manufactures
|
-61,983 | -61,270 | -63,397 | -66,118 | -66,368 | -250 | -0.4 |
|
Special provisions
|
-15,253 | -20,546 | -25,615 | -28,149 | -27,446 | 703 | 2.5 |
|
Total
|
-635,362 | -725,447 | -730,599 | -688,728 | -721,744 | -33,016 | -4.8 |
Note: Import values are based on Customs value; export values are based on free along ship value, U.S. port of export. Calculations based on unrounded data. Sectors are ordered by the level of processing of the products.
| Item |
2010
|
2011
|
Million $
2012 |
2013
|
2014
|
Absolute Change,
2013-14 |
Percent Change,
2013-14 |
|---|---|---|---|---|---|---|---|
|
U.S. total exports:
|
|||||||
|
Increases:
|
|||||||
|
Transportation equipment:
|
|||||||
|
Aircraft, spacecraft, and related equipment (TE013)
|
79,541 | 87,671 | 103,742 | 113,872 | 123,805 | 9,933 | 8.7 |
|
Motor vehicles (TE009)
|
52,749 | 63,983 | 70,432 | 74,023 | 77,692 | 3,669 | 5 |
|
Energy-related products:
|
|||||||
|
Crude petroleum (EP004)
|
1,731 | 2,084 | 2,634 | 5,103 | 12,246 | 7,143 | 140 |
|
Natural gas and components (EP006)
|
8,452 | 10,578 | 9,251 | 13,022 | 17,989 | 4,967 | 38.1 |
|
Miscellaneous manufactures:
|
|||||||
|
Works of art and miscellaneous manufactured goods (MS017)
|
7,199 | 7,670 | 8,136 | 8,489 | 11,006 | 2,517 | 29.6 |
|
Precious jewelry and related articles (MS006)
|
6,458 | 7,680 | 8,748 | 10,146 | 11,331 | 1,185 | 11.7 |
|
Decreases:
|
|||||||
|
Minerals and metals:
|
|||||||
|
Precious metals and non-numismatic coins (MM020)
|
30,045 | 44,932 | 45,307 | 41,719 | 29,982 | -11,737 | -28.1 |
|
Copper and related articles (MM036)
|
7,468 | 9,113 | 9,082 | 8,471 | 8,030 | -441 | -5.2 |
|
Coal, coke, and related chemical products (EP003)
|
12,612 | 19,405 | 17,537 | 13,778 | 10,325 | -3,453 | -25.1 |
|
All other
|
1,072,240 | 1,229,393 | 1,270,833 | 1,290,969 | 1,321,038 | 30,068 | 2.3 |
|
Total
|
1,278,495 | 1,482,508 | 1,545,703 | 1,579,593 | 1,623,443 | 43,850 | 2.8 |
| U.S. general imports: | |||||||
|
Increases:
|
|||||||
|
Transportation equipment:
|
|||||||
|
Certain motor-vehicle parts (TE010)
|
54,444 | 63,368 | 73,333 | 75,206 | 82,013 | 6,806 | 9 |
|
Motor vehicles (TE009)
|
130,065 | 140,963 | 168,195 | 176,780 | 183,251 | 6,471 | 3.7 |
|
Aircraft, spacecraft, and related equipment (TE013)
|
18,766 | 21,463 | 24,134 | 29,423 | 34,264 | 4,841 | 16.5 |
|
Telecommunications equipment (EL002)
|
74,406 | 80,170 | 83,922 | 91,776 | 98,161 | 6,386 | 7 |
|
Semiconductor manufacturing equipment and robotics (MT019)
|
9,332 | 14,005 | 12,917 | 11,690 | 14,173 | 2,484 | 21.2 |
|
Decreases:
|
|||||||
|
Energy-related products:
|
|||||||
|
Crude petroleum (EP004)
|
260,105 | 336,687 | 315,820 | 273,836 | 246,970 | -26,866 | -9.8 |
|
Petroleum products (EP005)
|
69,267 | 94,648 | 92,564 | 89,209 | 79,808 | -9,401 | -10.5 |
|
All other
|
1,297,470 | 1,456,650 | 1,505,418 | 1,520,402 | 1,606,547 | 86,145 | 5.7 |
Total |
1,913,857 | 2,207,954 | 2,276,302 | 2,268,321 | 2,345,187 | 76,866 | 3.4 |
Note: Import values are based on Customs value; export values are based on free along ship value, U.S. port of export. Calculations based on unrounded data
U.S. Imports
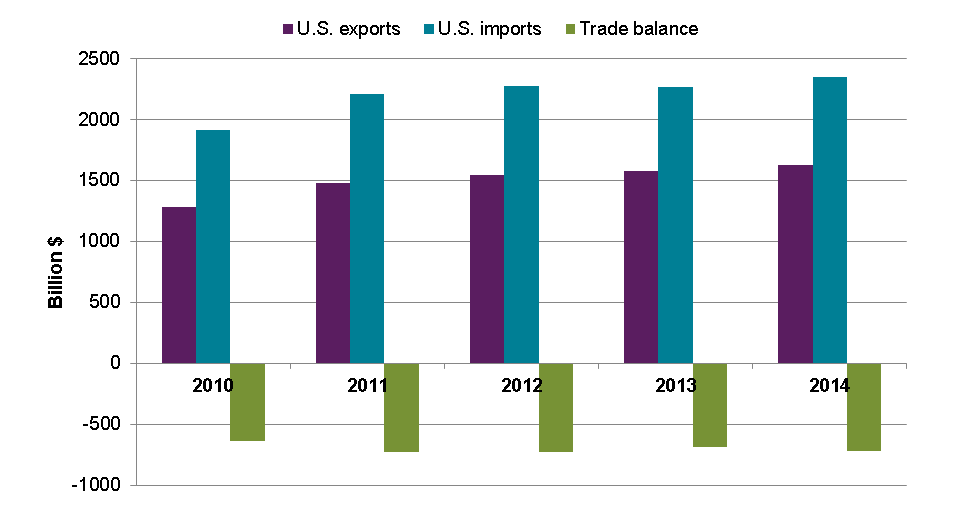
In 2014, the value of total U.S. imports increased by $76.9 billion (3 percent) to $2,345.2 billion, with the largest absolute shifts occurring in energy-related products (down $34.2 billion to $350.0 billion), transportation equipment (up $27.6 billion to $403.0 billion), and electronic products (up $16.5 billion to $438.2 billion). Lower domestic consumption of crude petroleum and higher U.S. production of this commodity contributed to the significant reduction in imports of energy-related products (down 9 percent) in 2014.
Mexican suppliers accounted for a little more than a third of the U.S. import growth in the transportation equipment sector. Benefiting from lower labor costs in Mexico, as well as duty-free access to the U.S. market under the North American Free Trade Agreement (NAFTA), U.S. imports of transportation equipment from Mexico rose by $11.1 billion. At the same time, growth in U.S. imports from Canada was much lower ($2.7 billion), and imports from Japan declined by $2.8 billion. Increased imports of motor-vehicle parts, motor vehicles, and aircraft, spacecraft, and related equipment accounted for most of the growth in U.S. imports of transportation equipment in 2014 (see the Transportation Products webpage for more detail). Increased imports of telecommunications equipment accounted for most of the growth in U.S. imports of electronic products. China accounted for almost two-thirds of U.S. import growth in the electronic products sector in 2014 (see the Electronic Products webpage for more detail).
U.S. Trade Balance 2
In 2014, based on total exports and general imports, 9 of the 10 U.S. merchandise sectors addressed in 2014 Trade Shifts—all except the agricultural sector—registered trade deficits.3 The trade deficit for the energy-related products sector fell by $42.2 billion (18 percent), largely because of rising U.S. production of crude petroleum, petroleum products, and natural gas, coupled with largely stagnant U.S. consumption. The change in this sector was a major factor in restraining the overall U.S. trade deficit to a $33.0 billion (5 percent) increase in 2014. The trade deficit reached $721.7 billion that year, about 1 percent below the five-year peak of $730.6 billion in 2012. Of the sectoral trade deficits, the largest increase in 2014 occurred in the minerals and metals sector; this deficit increased by $23.2 billion (80 percent) to $52.0 billion. Although the agricultural products sector recorded a trade surplus of $28.7 billion in 2014, this surplus represented a decline of $2.3 billion (8 percent) from the previous year.
Shifts in U.S. Bilateral/Multilateral Trade among Leading Trading Partners
In 2014, the United States’ top five single-country trading partners continued to be Canada, China, Mexico, Japan, and Germany (table US.4 and figure US.2). Together, these trading partners accounted for over half of U.S. trade with the world. The United States’ overall trade deficit with these five countries grew by $26.7 billion in 2014.
| Item |
2010
|
2011
|
Million $
2012 |
2013
|
2014
|
Absolute Change,
2013-14 |
Percent Change,
2013-14 |
|---|---|---|---|---|---|---|---|
|
U.S. total exports:
|
|||||||
|
Canada
|
249,256 | 281,292 | 292,651 | 301,610 | 312,125 | 10,516 | 3.5 |
|
China
|
91,911 | 104,122 | 110,516 | 121,736 | 124,024 | 2,288 | 1.9 |
|
Mexico
|
163,665 | 198,289 | 215,907 | 226,079 | 240,326 | 14,247 | 6.3 |
|
Japan
|
60,472 | 65,800 | 69,964 | 65,206 | 66,964 | 1,758 | 2.7 |
|
Germany
|
48,155 | 49,294 | 48,801 | 47,362 | 49,443 | 2,081 | 4.4 |
|
South Korea
|
38,821 | 43,462 | 42,265 | 41,715 | 44,544 | 2,829 | 6.8 |
|
United Kingdom
|
48,410 | 56,033 | 54,860 | 47,353 | 53,865 | 6,512 | 13.8 |
|
France
|
26,970 | 27,857 | 30,811 | 31,745 | 31,197 | -547 | -1.7 |
|
Brazil
|
35,418 | 43,019 | 43,807 | 44,119 | 42,418 | -1,701 | -3.9 |
|
Taiwan
|
26,050 | 25,932 | 24,337 | 25,472 | 26,836 | 1,363 | 5.4 |
|
All other
|
489,367 | 587,409 | 611,785 | 627,197 | 631,701 | 4,504 | 0.7 |
|
Total
|
1,278,495 | 1,482,508 | 1,545,703 | 1,579,593 | 1,623,443 | 43,850 | 2.8 |
| EU-28 | 239,903 | 269,580 | 265,686 | 262,151 | 276,698 | 14,548 | 5.5 |
| OPEC | 54,226 | 64,809 | 81,732 | 84,679 | 82,729 | -1,950 | -2.3 |
| Latin America | 302,241 | 367,301 | 399,138 | 410,478 | 425,123 | 14,645 | 3.6 |
| Asia | 338,678 | 380,707 | 386,958 | 402,075 | 408,279 | 6,204 | 1.5 |
| Sub-Saharan Africa | 17,110 | 21,165 | 22,503 | 23,938 | 25,381 | 1,443 | 6 |
| U.S. general imports: | |||||||
| Canada | 277,637 | 315,325 | 324,264 | 332,553 | 346,063 | 13,510 | 4.1 |
| China | 364,953 | 399,371 | 425,626 | 440,448 | 466,656 | 26,209 | 6 |
| Mexico | 229,986 | 262,874 | 277,594 | 280,529 | 294,157 | 13,629 | 4.9 |
| Japan | 120,552 | 128,928 | 146,438 | 138,573 | 133,939 | -4,635 | -3.3 |
| Germany | 82,450 | 98,684 | 109,226 | 114,345 | 123,181 | 8,836 | 7.7 |
| South Korea | 48,875 | 56,661 | 58,902 | 62,386 | 69,606 | 7,219 | 11.6 |
| United Kingdom | 49,805 | 51,263 | 55,003 | 52,817 | 54,049 | 1,231 | 2.3 |
| France | 38,355 | 40,049 | 41,647 | 45,708 | 47,015 | 1,307 | 2.9 |
| Brazil | 23,958 | 31,737 | 32,123 | 27,634 | 30,337 | 2,703 | 9.8 |
| Taiwan | 35,847 | 41,405 | 38,861 | 37,940 | 40,572 | 2,632 | 6.9 |
| All other | 641,438 | 781,658 | 766,620 | 735,389 | 739,613 | 4,224 | 0.6 |
Total |
1,913,857 | 2,207,954 | 2,276,302 | 2,268,321 | 2,345,187 | 76,866 | 3.4 |
| EU-28 | 319,600 | 368,902 | 382,197 | 387,591 | 417,837 | 30,245 | 7.8 |
| OPEC | 149,893 | 191,470 | 180,752 | 152,690 | 132,132 | -20,558 | -13.5 |
| Latin America | 361,412 | 437,165 | 449,384 | 439,041 | 444,588 | 5,547 | 1.3 |
| Asia | 721,630 | 796,218 | 849,763 | 865,588 | 910,823 | 45,235 | 5.2 |
| Sub-Saharan Africa | 65,026 | 74,322 | 49,624 | 39,294 | 26,751 | -12,542 | -31.9 |
| U.S. merchandise trade balance: | |||||||
| Canada | -28,380 | -34,033 | -31,613 | -30,943 | -33,937 | -2,994 | -9.7 |
| China | -273,042 | -295,250 | -315,111 | -318,711 | -342,633 | -23,921 | -7.5 |
| Mexico | -66,321 | -64,585 | -61,687 | -54,450 | -53,831 | 618 | 1.1 |
| Japan | -60,080 | -63,128 | -76,474 | -73,368 | -66,975 | 6,393 | 8.7 |
| Germany | -34,295 | -49,390 | -60,425 | -66,983 | -73,738 | -6,756 | -10.1 |
| South Korea | -10,055 | -13,200 | -16,636 | -20,672 | -25,062 | -4,390 | -21.2 |
| United Kingdom | -1,395 | 4,771 | -143 | -5,464 | -183 | 5,280 | 96.6 |
| France | -11,386 | -12,192 | -10,835 | -13,963 | -15,818 | -1,855 | -13.3 |
| Brazil | 11,460 | 11,282 | 11,684 | 16,485 | 12,081 | -4,403 | -26.7 |
| Taiwan | -9,797 | -15,473 | -14,523 | -12,468 | -13,736 | -1,268 | -10.2 |
| All other | -152,071 | -194,249 | -154,835 | -108,192 | -107,913 | 280 | 0.3 |
Total |
-635,362 | -725,447 | -730,599 | -688,728 | -721,744 | -33,016 | -4.8 |
| EU-28 | -79,697 | -99,322 | -116,512 | -125,441 | -141,138 | -15,698 | -12.5 |
| OPEC | -95,667 | -126,661 | -99,021 | -68,011 | -49,403 | 18,608 | 27.4 |
| Latin America | -59,171 | -69,864 | -50,247 | -28,564 | -19,465 | 9,098 | 31.9 |
| Asia | -382,951 | -415,512 | -462,805 | -463,513 | -502,544 | -39,032 | -8.4 |
| Sub-Saharan Africa | -47,916 | -53,157 | -27,121 | -15,356 | -1,370 | 13,986 | 91.1 |
Note: Import values are based on Customs value; export values are based on free along ship value, U.S. port of export. Calculations based on unrounded data
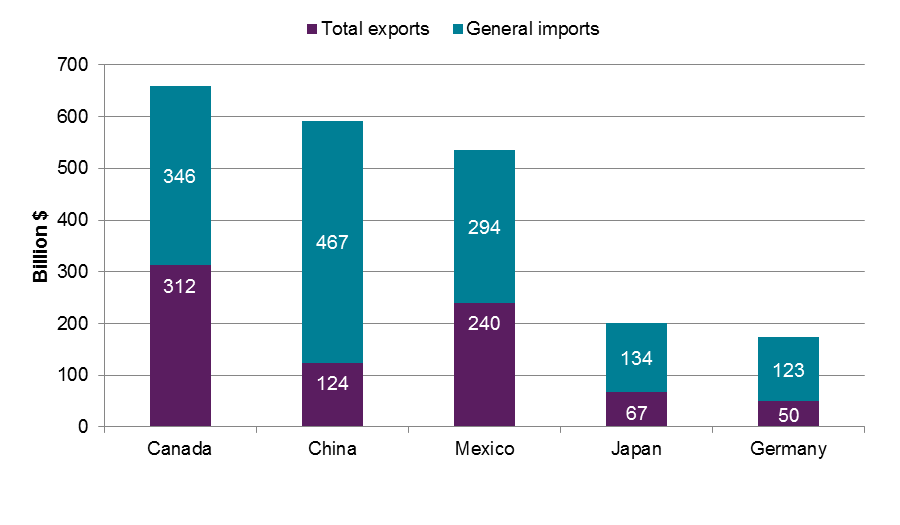
U.S. trade deficits increased with China (up $23.9 billion to $342.6 billion), Germany (up $6.8 billion to $73.7 billion), and Canada (up $3.0 billion to $33.9 billion). However, they fell with Japan (down $6.4 billion to $67.0 billion) and Mexico (down $618 million to $53.8 billion) in 2014.
The largest trade balance shift in 2014 occurred with China (see the China webpage for more detail). A $10.8 billion increase in U.S. imports of electronic products from China substantially contributed to the growing U.S. trade deficit with China, while U.S. merchandise exports to China marginally increased.
1 USGS, “Value of U.S. Mineral Production Increases,” January 30, 2015
2 Trade data in this section consist of total exports and general imports as reported by U.S. Census. “Total exports” include both domestic exports and re-exports, i.e., goods that are imported into the United States and then exported without alteration in form, condition, or value. “General imports” include merchandise from foreign countries, whether or not it enters consumption channels immediately or is entered into bonded warehouses or U.S. foreign-trade zones. For further definitions of trade terms, see the “Trade Metrics” webpage, the “Trade Measure Definitions“ webpage, or https://www.census.gov/foreign-trade/reference/definitions/.
3 The 10 sectors are agricultural products, chemicals and related products, electronic products, energy and related products, footwear, forest products, machinery, minerals and metals, textiles and apparel, and transportation equipment., respectively; accessed February 20, 2015).