
Author: Jessica Pugliese
International Trade Analyst
Change in 2014 from 2013:
 To view changing data, mouseover the graphic below.
 - U.S. total exports: Increased by $1.4 billion (6 percent) to $25.4 billion
- U.S. general imports: Decreased by $12.5 billion (32 percent) to $26.8 billion
- U.S. trade deficit: Decreased by $14.0 billion (91 percent) to $1.4 billion
U.S. Exports
In 2014, U.S. total exports to SSA increased by $1.4 billion (6 percent) to $25.4 billion (Table SSA.1). The largest absolute trade shift occurred in the transportation equipment sector, where U.S. exports rose by $1.8 billion (24 percent) to $9.5 billion. The main reason for the shift was that various SSA countries (primarily Kenya and Ethiopia) increased their imports of U.S. aircraft1 in 2014 (Table SSA.1).2 Commercial airlines in SSA are working to upgrade aging fleets to improve fuel efficiency and reduce carbon emissions. For example, in 2014, Ethiopian Airlines reportedly received seven deliveries of Boeing aircraft and three Cessna 172 pilot training planes.3
|
Million $
|
|||||||
|---|---|---|---|---|---|---|---|
|
Absolute change,
|
Percent change,
|
||||||
| Item |
2010
|
2011
|
2012
|
2013
|
2014
|
2013-14
|
2013-14
|
| U.S. total exports: | |||||||
| Agricultural products | 2,319 | 3,042 | 2,684 | 2,646 | 2,337 | -309 | -11.7 |
| Forest products | 269 | 321 | 287 | 274 | 310 | 35 | 12.9 |
| Chemicals and related products | 1,620 | 1,951 | 2,119 | 2,136 | 2,116 | -20 | -0.9 |
| Energy-related products | 1,538 | 1,950 | 2,034 | 3,558 | 3,864 | 305 | 8.6 |
| Textiles and apparel | 245 | 282 | 296 | 300 | 298 | -2 | -0.7 |
| Footwear | 31 | 39 | 31 | 28 | 30 | 2 | 8.3 |
| Minerals and metals | 1,214 | 1,542 | 1,624 | 2,109 | 1,367 | -742 | -35.2 |
| Machinery | 2,040 | 2,203 | 2,528 | 2,547 | 2,815 | 268 | 10.5 |
| Transportation equipment | 5,541 | 7,336 | 8,283 | 7,660 | 9,507 | 1,847 | 24.1 |
| Electronic products | 1,427 | 1,487 | 1,622 | 1,653 | 1,722 | 68 | 4.1 |
| Miscellaneous manufactures | 261 | 295 | 274 | 265 | 288 | 23 | 8.6 |
| Special provisions | 604 | 717 | 720 | 759 | 726 | -33 | -4.3 |
| Total | 17,110 | 21,165 | 22,503 | 23,938 | 25,381 | 1,443 | 6 |
| U.S. general imports: | |||||||
| Agricultural products | 1,851 | 2,097 | 1,925 | 1,980 | 2,267 | 287 | 14.5 |
| Forest products | 87 | 109 | 121 | 135 | 151 | 17 | 12.4 |
| Chemicals and related products | 1,014 | 1,411 | 1,268 | 1,155 | 1,134 | -21 | -1.8 |
| Energy-related products | 52,986 | 60,046 | 36,759 | 26,331 | 13,335 | -12,996 | -49.4 |
| Textiles and apparel | 814 | 929 | 891 | 966 | 1,050 | 84 | 8.7 |
| Footwear | 2 | 2 | 9 | 21 | 22 | (a) | 1.1 |
| Minerals and metals | 5,701 | 6,514 | 5,528 | 5,355 | 6,201 | 846 | 15.8 |
| Machinery | 322 | 365 | 364 | 344 | 379 | 35 | 10 |
| Transportation equipment | 1,729 | 2,335 | 2,152 | 2,379 | 1,513 | -866 | -36.4 |
| Electronic products | 87 | 109 | 101 | 116 | 104 | -13 | -10.9 |
| Miscellaneous manufactures | 229 | 197 | 194 | 223 | 235 | 13 | 5.6 |
| Special provisions | 204 | 208 | 314 | 289 | 361 | 72 | 24.9 |
| Total | 65,026 | 74,322 | 49,624 | 39,294 | 26,751 | -12,542 | -31.9 |
| U.S. merchandise trade balance: | |||||||
| Agricultural products | 468 | 945 | 760 | 666 | 70 | -597 | -89.6 |
| Forest products | 183 | 212 | 166 | 140 | 159 | 19 | 13.5 |
| Chemicals and related products | 606 | 540 | 851 | 980 | 982 | 1 | 0.1 |
| Energy-related products | -51,448 | -58,096 | -34,725 | -22,772 | -9,471 | 13,301 | 58.4 |
| Textiles and apparel | -569 | -646 | -595 | -665 | -751 | -86 | -12.9 |
| Footwear | 29 | 37 | 22 | 7 | 9 | 2 | 31.7 |
| Minerals and metals | -4,487 | -4,972 | -3,903 | -3,246 | -4,834 | -1,588 | -48.9 |
| Machinery | 1,718 | 1,838 | 2,164 | 2,203 | 2,437 | 233 | 10.6 |
| Transportation equipment | 3,812 | 5,000 | 6,132 | 5,281 | 7,994 | 2,713 | 51.4 |
| Electronic products | 1,340 | 1,378 | 1,521 | 1,537 | 1,618 | 81 | 5.3 |
| Miscellaneous manufactures | 32 | 98 | 81 | 43 | 53 | 10 | 24.3 |
| Special provisions | 401 | 510 | 407 | 470 | 365 | -105 | -22.3 |
| Total | -47,916 | -53,157 | -27,121 | -15,356 | -1,370 | 13,986 | 91.1 |
Note: Import values are based on Customs value; export values are based on free along ship value, U.S. port of export. Calculations based on unrounded data. Sectors are ordered by the level of processing of the products classified within each sector.
a Less than $500,000.
|
Million $
|
|||||||
|---|---|---|---|---|---|---|---|
|
Absolute change,
|
Percent change,
|
||||||
| Item |
2010
|
2011
|
2012
|
2013
|
2014
|
2013-14
|
2013-14
|
| U.S. total exports: | |||||||
| Increases: | |||||||
| Aircraft, spacecraft, and related equipment (TE013) | 1,188 | 1,570 | 2,099 | 1,341 | 3,740 | 2,399 | 178.9 |
| Energy-related products: | |||||||
| Natural gas and components (EP006) | 9 | 28 | 15 | 31 | 234 | 203 | 658.2 |
| Petroleum products (EP005) | 1,400 | 1,749 | 1,886 | 3,410 | 3,547 | 137 | 4 |
| Decreases: | |||||||
| Precious metals and non-numismatic coins (MM020) | 410 | 603 | 571 | 991 | 55 | -937 | -94.5 |
| All other | 14,102 | 17,215 | 17,932 | 18,165 | 17,805 | -359 | -2 |
| Total | 17,110 | 21,165 | 22,503 | 23,938 | 25,381 | 1,443 | 6 |
| U.S. general imports: | |||||||
| Increases: | |||||||
| Minerals and metals: | |||||||
| Natural and synthetic gemstones (MM019) | 1,555 | 1,738 | 1,354 | 1,459 | 1,831 | 372 | 25.5 |
| Ferroalloys (MM022) | 627 | 705 | 666 | 553 | 819 | 266 | 48.2 |
| Precious metals and non-numismatic coins (MM020) | 2,241 | 2,432 | 1,902 | 1,578 | 1,800 | 223 | 14.1 |
| Cocoa, chocolate, and confectionery (AG037) | 1,038 | 1,272 | 1,001 | 1,046 | 1,213 | 167 | 16 |
| Apparel (TX005) | 795 | 909 | 871 | 944 | 1,029 | 85 | 9 |
| Decreases: | |||||||
| Crude petroleum (EP004) | 50,398 | 56,393 | 33,903 | 23,469 | 11,047 | -12,422 | -52.9 |
| Motor vehicles (TE009) | 1,543 | 2,055 | 1,896 | 2,171 | 1,268 | -902 | -41.6 |
| All other | 6,829 | 8,819 | 8,032 | 8,076 | 7,744 | -332 | -4.1 |
| Total | 65,026 | 74,322 | 49,624 | 39,294 | 26,751 | -12,542 | -31.9 |
Note: Import values are based on Customs value; export values are based on free along ship value, U.S. port of export. Calculations based on unrounded data.
In recent years, U.S. exports of petroleum products have accounted for a greater share of global trade.4 In line with this trend, U.S. exports of energy-related products to SSA increased by $305 million (9 percent) to $3.9 billion in 2014. The increased exports were refined petroleum products to Nigeria and consisted primarily of light oils. In 2014, Nigeria accounted for over 90 percent of total U.S. exports of these products to SSA. Although Nigeria is a large producer of crude petroleum, its four refineries are operating well below capacity because of their prolonged state of disrepair.5 With the decline in global prices for crude petroleum that began in late 2014, Nigeria has announced intentions to import more refined products instead of upgrading its refineries.6
U.S. exports of minerals and metals to SSA experienced the second-largest absolute change, decreasing by $742 million (35 percent) in 2013–14. The main reason for this decrease was a sharp decline in exports of precious metals and non-numismatic (bullion) coins,7 which decreased by $937 million (94 percent) to $55 million in 2014. Within this industry-commodity group, a drop in unwrought refined gold bullion exported to South Africa accounted for the decrease.8
Large annual variations in precious-metals exports and imports are considered typical for the global refining industry.9 For example, in 2013, the Rand Refinery, South Africa’s sole precious-metals refinery, imported significant quantities of unwrought gold from the United States.10 According to industry observers, the U.S. gold sent to the Rand Refinery was used to either meet unfilled refining capacity because of falling domestic mined-gold output or, ultimately, to enable the South African Mint to meet rising demand for Krugerrand coins after gold prices fell in mid-April 2013.11 South African mined-gold output has been declining for decades and has been particularly impacted by labor unrest in the past few years.12
U.S. General Imports
U.S. imports from SSA fell by $12.5 billion (32 percent) to $26.8 billion in 2014. The drop in imports of energy-related products accounts for essentially the entire decline. U.S. imports of energy-related products, primarily crude petroleum from Nigeria, decreased from $26.3 billion in 2013 to $13.3 billion in 2014. U.S. consumption of crude petroleum has remained relatively stable in recent years. However, U.S. production has increased, particularly from two sources—North Dakota’s Bakken formation and Eagle Ford in Texas. The crude petroleum produced in the Bakken formation is mainly sweet and light crude, which is almost identical to the type produced in Nigeria. U.S. refineries that are optimized for this type of crude have been using domestic crude in lieu of importing the Nigerian crude.13 The second-largest absolute decrease in U.S. imports from SSA was in the transportation equipment sector, where U.S. imports decreased by $866 million (36 percent) to $1.5 billion from 2013 to 2014. Nearly all transportation equipment imports from SSA are assembled passenger vehicles from South Africa.14 The primary reason for the trade shift is that Daimler stopped exporting its C-class Mercedes-Benz model from its South African plants to the United States, as U.S. production of the C-class line started in Tuscaloosa, AL, in June 2014.15 In addition, South African automakers experienced a series of strikes in July 2014 that caused production to slow down and halt in some cases.16
Meanwhile, U.S. imports from SSA rose in some sectors. Notably, U.S. imports of minerals and metals from SSA increased by $846 million (16 percent) to $6.2 billion in 2014. Imports increased primarily in three industry-commodity subgroups: natural and synthetic gemstones, precious metals and non-numismatic coins, and ferroalloys. Natural and synthetic gemstone imports were predominantly non-industrial diamonds, either unworked (rough) or worked (cut, set or faceted); imports of these products17 increased $372 million (26 percent) to $1.8 billion. The United States is a major importer of diamonds, since it consumes substantial amounts of diamond jewelry and serves as a hub for international diamond trading and transit, while producing almost no mined diamonds of its own.18 In 2014, imports increased to fulfill robust U.S. demand for diamond jewelry.19 A majority of the increased imports of diamonds came from South Africa, Lesotho, and Botswana.
Precious metals imports from SSA increased by $223 million (14 percent) to $1.8 billion. These imports were composed primarily of unrefined and refined gold from South Africa, which increased by $344 million (7,576 percent) to $349 million in 2014.20 Shipments of large amounts of gold between South Africa and its trading partners are reportedly not considered out of the ordinary, given the international role of South Africa’s Rand Refinery as a global precious-metals refiner that also provides assaying, logistical, and depository services for precious-metals customers.21
The value of U.S. imports of ferroalloys from SSA also increased by $266 million (48 percent) to $819 million in 2014. Three ferroalloys accounted for 100 percent of the U.S. imports in the ferroalloys category: ferrochromium (55 percent), ferromanganese (28 percent), and ferrosilicon manganese (17 percent).22 In SSA, South Africa is the major supplier of each of these alloys. A portion of the trade shift can be attributed to a rise in unit value due to price increases for some of the ferroalloys. Demand from China, the world’s largest producer of stainless steel and consumer of ferroalloys,23 is a key factor behind changes in the global price for ferroalloys. Ferrochromium import average unit values rose 9 percent, but ferromanganese import unit values actually declined by less than one-half of 1 percent in 2014.24
U.S. ferroalloy consumption depends on demand from U.S. steel producers.25 U.S. crude steel production increased by 2 percent in 2014.26 Although this appears as a leading trade shift, the 2014 level of ferroalloy imports is likely more in line with U.S consumption than in 2013, when inventories declined from their 2012 levels because steelmakers and traders relied on stocks rather than new purchases of raw materials.27
The value of U.S. imports of agricultural products from SSA rose by $287 million (15 percent) to $2.3 billion in 2014. A majority of this shift was triggered by a rise in the value of cocoa, chocolate, and confectionery imports, which increased $167 million (16 percent) from $1 billion to $1.2 billion.28 A portion of the shift can be attributed to price increases. During 2013–14, import unit values for cocoa beans outpaced quantity increases. The average unit value of beans from SSA countries increased by 21 percent, while the import quantity declined slightly.29 U.S. imports of cocoa beans from SSA are fairly consistent and supply the non-premium segments of the market, for which U.S. demand is stable.30 Most growth in U.S. consumer demand is for higher-quality products and single-origin cocoa beans from non-SSA sources.31
Imports of textiles and apparel also increased substantially, growing by $84 million (9 percent) to $1.05 billion. Categories of textiles and apparel for which U.S. imports rose were trousers, shirts, and blouses.32
U.S. Imports under the African Growth and Opportunity Act (AGOA)33
As of June 12, 2015, the African Growth and Opportunity Act trade preference program was in review and the House and Senate had both passed a 10-year extension of the program.34 U.S. imports under AGOA fell sharply in 2014, decreasing by $13 billion (52 percent) to $11.9 billion. From 2010 to 2014, the majority of U.S. imports under AGOA were crude and refined petroleum products, which accounted for an average of 88 percent of the total value of AGOA imports for the period. However, as noted earlier, in 2014 the proportion of imports under AGOA that were energy-related declined to 76 percent because of the steep drop in U.S. imports of Nigerian crude.
Non-energy-related imports under AGOA also declined by $719 million (20 percent) to $2.9 billion in 2014. This shift is mainly because of the drop in U.S. imports of transportation equipment from South Africa, as discussed earlier (see also figure SSA.1). Motor vehicles from South Africa have become a leading import under AGOA, and despite the decline in 2014, the transportation sector still accounted for 11 percent of total imports under AGOA, as well as for 46 percent of non-energy-related imports.
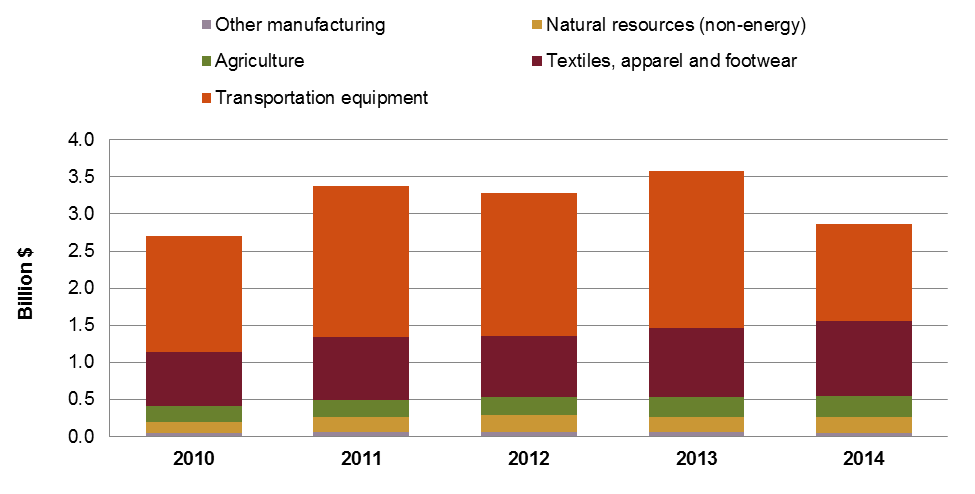
Note: The data in this figure are based on the list of AGOA-eligible countries, which varies by year. “Agriculture” includes all agricultural products; “other manufacturing” includes electronics, chemicals, and miscellaneous manufactures; “natural resources” includes forest products and minerals and metals, while excluding crude and refined petroleum products, which are covered in chapter 27 of the Harmonized Tariff Schedule (HTS) 2015; “textiles, apparel and footwear” include all textiles, apparel, and footwear. Items under special provisions are reported in the appropriate HTS chapters for each item 1–97. Data exclude imports under the Generalized System of Preferences (GSP) and Generalized System of Preferences for Least-Developed Beneficiary Countries (GSP-LDBC).
Another recent shift in imports under AGOA has occurred in the textiles, apparel, and footwear category. In 2010, these goods made up only 2 percent of total imports under AGOA, but their share rose to 9 percent in 2014, and it rose from 27 to 35 percent of non energy-related imports in the same period. From 2013 to 2014 alone, U.S. imports of textile, apparel, and footwear under AGOA increased by $82.5 million (9 percent).
The growth in U.S. imports of agriculture and natural resource products under AGOA has been more modest. In 2010, agricultural products made up less than 1 percent of total U.S. imports under AGOA. By 2014, these goods had risen to 2 percent of total imports under AGOA and had risen from 8 to 10 percent of non energy-related imports.35
Similarly, imports of non-energy-related natural resources (i.e., minerals and metals and forest products) have increased from less than 1 percent of total U.S. imports under AGOA to 2 percent from 2010 to 2014 (increasing from 5 to 7 percent of non-energy-related imports).36
U.S. Trade Balance
From 2013 to 2014, the U.S. trade deficit with sub-Saharan Africa (SSA) narrowed dramatically by $14.0 billion, a decrease of 91 percent. In 2014, U.S. exports to SSA rose modestly, driven principally by increased demand for U.S. transportation equipment (primarily aircraft). However, most of the shift in the deficit can be attributed to a steep reduction in U.S. imports from SSA of energy-related products. The United States has substantially increased its domestic production of crude petroleum, cutting into imports from SSA.37
U.S. imports under AGOA also decreased, largely because of a drop in U.S. imports of energy-related products and motor vehicles from South Africa. However, imports of other non-energy-related product areas under AGOA increased, both in terms of value and as a share of total U.S. imports under AGOA. These product areas include textiles and apparel, agriculture, and non-energy-related natural resources.
1 USITC DataWeb/USDOC (for commodity group TE013; accessed March 16, 2015). In 2014, civilian aircraft, engines, equipment and parts (HTS 8000.00) accounted for a majority of the value of commodity group TE013.
2 Annual counts of aircraft exports are typically small, but each unit has a large value. Boeing estimates that the Africa region (including North Africa) will require 1,100 new aircraft over the next 20 years. Boeing, “Long-term Market: Africa” (accessed February 24, 2015); Clark, “Falling Oil Prices, a Boon to Airlines,” January 13, 2015.
3 A Boeing 777-300ER, two Boeing 777 Freighters, and four Boeing 787 Dreamliner airplanes were delivered in 2014. Ethiopian Airlines, “Ethiopian Takes Delivery of Three Pilot Training Aircraft,” July 24, 2014, Ethiopian Airlines, “Press Release Archives: 2014,” various dates. In addition, as of September 2014, Ethiopian Airlines signed a contract for 20 Boeing 737 Max 8 airplanes, a fuel-efficient model, for $2.1 billion. Boeing, “Boeing, Ethiopian Airlines Announce Order for 20 737 MAX 8s,” September 20, 2014.
4 Foreso, “U.S. Becoming a Leading Exporter of Petroleum Products,” October 2014. For more information, refer to the Energy and Related Products webpage.
5 Industry representatives, interviews by Commission staff, January 7, 2015; USDOE, EIA, “Country Analysis Brief—Nigeria,” December 30, 2013.
6 Ibid.
7 Non-numismatic (bullion) coins of precious metal are purchased primarily for investment rather than as collector items.
8 USITC DataWeb/USDOC (for commodity subgroup MM020A; accessed March 16, 2015). The value of U.S. exports of unrefined and refined gold (MM020A) fell to below $500,000 in 2014 from $982 million in 2013 (almost a 100 percent decrease). In 2014, unwrought refined gold bullion accounted for the entirety of subgroup MM020A. However, subgroups of MM020 other than gold experienced increases in U.S. exports, hence the smaller absolute and percentage change for the broader group MM020 vs. the subgroup MM020A.
9Rand Refinery, “Comment from the Chief Executive,” May 17, 2013.
10 Clarke, “Rand Refinery behind Massive Gold Imports,” May 17, 2013.
11 Fowler, “South Africa Imports $1 Billion of Unwrought Gold,” May 15, 2013; O’Bryne, “South Africa Starts Importing Gold,” May 15, 2013; Rand Refinery (Pty) Ltd., “The Krugerrand,” http://www.randrefinery.com/brochures/Krugerrand-brochure.pdf (accessed March 16, 2015).
12 Yanofsky, “$1 Billion of Gold Has Been Shipped,” May 13, 2013.
13 For more information, refer to the Energy and Related Products subpage.
14 USITC, AGOA Trade and Investment Performance Overview, April 2014, 60.
15 Daimler, “Start of Production of New Mercedes-Benz C-Class,” June 18, 2014.
16 Furlonger and Grenetzky, “BMW Cuts Production as Strike Persists,” July 9, 2014.
17 USITC DataWeb/USDOC (for commodity group MT0019; accessed March 16, 2015).
18 Olson, “Gemstones,” August 2014, 29.3. For more details see the Minerals and Metals webpage.
19 Bates, “Brands, Basics, and Floating Diamonds,” December 30, 2014; “Jewelry Business Strong This Holiday,” December 29, 2014. There is no significant U.S. production of mined diamonds.
20 USITC DataWeb/USDOC (for commodity subgroup MM020A; accessed March 15, 2015). Calculations of percentage change using official statistics may vary due to rounding of the underlying figures.
21 Clarke, “Rand Refinery Behind Massive Gold Imports,” May 17, 2013; Rand Refinery, “Comment from the Chief Executive,” May 17, 2013.
22 USITC DataWeb/USDOC (for commodity group MM022; accessed March 16, 2015).
23 ISSF, “Stainless and Heat Resistant Steel: Melt Shop Production,” 2014.
24 The average unit value for ferrosilicon manganese also increased slightly by 0.2 percent from 2013 to 2014. USITC DataWeb/USDOC (for commodity group MM022; accessed March 16, 2015).
25 USITC,AGOA Trade and Investment Performance Overview, April 2014, 66.
26 World Steel, Monthly Crude Steel Production: 2013 and 2014.
27 Metal Bulletin, “MB Research View—Ferroalloys: Market Positioned,” November 21, 2013; Metal Bulletin, “European Prices Firming: Ferrosilicon Highlights,” October 2013.
28 In the cocoa, chocolate, and confectionery category, cocoa beans accounted for 80 percent of the value of U.S. imports. Côte d’Ivoire (Ivory Coast) is the major supplier of U.S. imports of cocoa beans from SSA. USITC DataWeb/USDOC (for commodity group AG037; accessed March 20, 2014).
29 USITC DataWeb/USDOC (for commodity group AG037; accessed March 20, 2015).
30 ICCO, Data on Grindings of Cocoa Beans, Cocoa Year 2013/14.
31 Hosafci, “Single-Origin Chocolate: The Future,” August 8, 2014.
32 USITC DataWeb/USDOC (for commodity subgroups TX005D, TX005E, and TX005C; accessed March 20, 2015).
33 U.S. imports under AGOA are measured in imports for consumption. For a comprehensive analysis of AGOA, see USITC, AGOA Trade and Investment Performance Overview, April 2014.
34 Without an extension, AGOA was scheduled to expire on September 30, 2015. Since 2005, AGOA has provided unilateral duty-free and quota-free market access to the United States for eligible countries and products in SSA. Bass, “Statement on House passage of African Growth and Opportunity Act,” June 11, 2015.
35From 2013 to 2014, U.S. imports of edible nuts experienced the largest absolute increase of any agricultural product under AGOA, rising by $20 million (35 percent) to $78 million. U.S. imports of tobacco came in second in terms of absolute increase over the same period, while U.S. imports of citrus fruits and wine experienced a modest decrease. USITC DataWeb/USDOC (for the agricultural sector, generally HTS chapters 1–24 and 52; accessed March 16, 2015).
36 The grouping “other manufacturing” did not substantially increase its share of U.S. imports under AGOA from 2010 to 2014.
37 Unlike some of the other trading partners/regions examined in this report, exchange rate fluctuations did not have a significant impact on bilateral trade between the United States and SSA countries.