
Author: Alissa Tafti
International Economist
U.S. Exports1
In 2015, U.S. total exports fell by $116.0 billion from 2014 levels (7.2 percent), slipping from $1,620.5 billion to $1,504.6 billion (table US.1 and figure US.1). The decrease in exports was primarily due to declining crude petroleum prices, weak global economic growth that dampened global demand, and continued appreciation of the U.S. dollar. Exports decreased in all of the sectors discussed in this report with the exception of footwear, for which exports increased by $3.0 million (0.2 percent).
Table US.1: U.S. total exports, general imports, and merchandise trade balance, by major industry/commodity sectors, 2011–15
|
Million $
|
|||||||
|---|---|---|---|---|---|---|---|
| Item | 2011 | 2012 | 2013 | 2014 | 2015 | Absolute change, 2014–15 |
Percent change, 2014–15 |
| U.S. total exports: | |||||||
| Agricultural products | 150,461 | 154,274 | 157,637 | 164,451 | 146,553 | -17,898 | -10.9 |
| Forest products | 40,849 | 39,832 | 40,826 | 41,159 | 39,058 | -2,101 | -5.1 |
| Chemicals and related products | 225,308 | 228,922 | 231,296 | 234,825 | 227,963 | -6,861 | -2.9 |
| Energy-related products | 137,176 | 143,379 | 154,423 | 160,917 | 111,746 | -49,171 | -30.6 |
| Textiles and apparel | 22,372 | 22,454 | 23,321 | 23,988 | 23,218 | -769 | -3.2 |
| Footwear | 1,290 | 1,332 | 1,391 | 1,455 | 1,458 | 3 | 0.2 |
| Minerals and metals | 165,012 | 163,980 | 160,523 | 152,907 | 135,743 | -17,165 | -11.2 |
| Machinery | 130,321 | 138,528 | 139,646 | 145,915 | 138,487 | -7,427 | -5.1 |
| Transportation equipment | 280,064 | 313,396 | 322,173 | 336,278 | 326,269 | -10,010 | -3.0 |
| Electronic products | 251,669 | 257,698 | 261,218 | 267,772 | 263,893 | -3,880 | -1.4 |
| Miscellaneous manufactures | 38,608 | 41,385 | 43,849 | 47,628 | 47,321 | -307 | -0.6 |
| Special provisions | 39,378 | 40,639 | 42,136 | 43,237 | 42,888 | -349 | -0.8 |
| Total | 1,482,508 | 1,545,821 | 1,578,439 | 1,620,532 | 1,504,597 | -115,934 | -7.2 |
| U.S. general imports: | |||||||
| Agricultural products | 116,374 | 123,321 | 126,657 | 136,207 | 136,858 | 651 | 0.5 |
| Forest products | 36,274 | 37,071 | 39,985 | 42,105 | 42,290 | 185 | 0.4 |
| Chemicals and related products | 237,927 | 237,243 | 236,697 | 251,434 | 260,380 | 8,946 | 3.6 |
| Energy-related products | 458,764 | 428,235 | 384,142 | 351,628 | 194,475 | -157,153 | -44.7 |
| Textiles and apparel | 113,848 | 113,860 | 118,012 | 121,689 | 126,569 | 4,880 | 4.0 |
| Footwear | 22,654 | 23,887 | 24,811 | 26,014 | 27,660 | 1,646 | 6.3 |
| Minerals and metals | 193,651 | 195,077 | 190,441 | 205,048 | 188,946 | -16,101 | -7.9 |
| Machinery | 156,123 | 167,783 | 170,225 | 184,948 | 185,502 | 555 | 0.3 |
| Transportation equipment | 309,994 | 363,317 | 375,521 | 402,972 | 425,428 | 22,456 | 5.6 |
| Electronic products | 402,543 | 415,473 | 421,656 | 437,885 | 448,879 | 10,994 | 2.5 |
| Miscellaneous manufactures | 99,878 | 104,750 | 109,936 | 114,317 | 124,706 | 10,389 | 9.1 |
| Special provisions | 59,924 | 66,250 | 70,287 | 73,439 | 79,969 | 6,531 | 8.9 |
| Total | 2,207,954 | 2,276,267 | 2,268,370 | 2,347,685 | 2,241,664 | -106,022 | -4.5 |
| U.S. merchandise trade balance: | |||||||
| Agricultural products | 34,087 | 30,953 | 30,980 | 28,244 | 9,695 | -18,549 | -65.7 |
| Forest products | 4,575 | 2,761 | 841 | -946 | -3,232 | -2,286 | -241.6 |
| Chemicals and related products | -12,619 | -8,321 | -5,401 | -16,609 | -32,417 | -15,807 | -95.2 |
| Energy-related products | -321,588 | -284,856 | -229,719 | -190,711 | -82,729 | 107,982 | 56.6 |
| Textiles and apparel | -91,475 | -91,405 | -94,692 | -97,701 | -103,351 | -5,650 | -5.8 |
| Footwear | -21,364 | -22,554 | -23,420 | -24,559 | -26,202 | -1,643 | -6.7 |
| Minerals and metals | -28,640 | -31,097 | -29,918 | -52,140 | -53,204 | -1,063 | -2.0 |
| Machinery | -25,803 | -29,255 | -30,579 | -39,033 | -47,015 | -7,982 | -20.5 |
| Transportation equipment | -29,930 | -49,921 | -53,348 | -66,694 | -99,159 | -32,465 | -48.7 |
| Electronic products | -150,874 | -157,774 | -160,438 | -170,113 | -184,987 | -14,874 | -8.7 |
| Miscellaneous manufactures | -61,270 | -63,365 | -66,087 | -66,688 | -77,385 | -10,697 | -16.0 |
| Special provisions | -20,546 | -25,611 | -28,151 | -30,201 | -37,081 | -6,880 | -22.8 |
| Total | -725,447 | -730,446 | -689,931 | -727,153 | -737,066 | -9,913 | -1.4 |
Source: Compiled from official statistics of the U.S. Department of Commerce for the 2011–15 period. These reflect all official revisions of previously published data up to June 2015 (accessed February 10, 2016).
Note: Import values are based on Customs value; export values are based on free along ship value, U.S. port of export. Calculations based on unrounded data. Sectors are ordered by the level of processing of the products.
Figure US.1: U.S. total exports and general imports decreased in 2015 after steadily increasing from 2011 to 2014
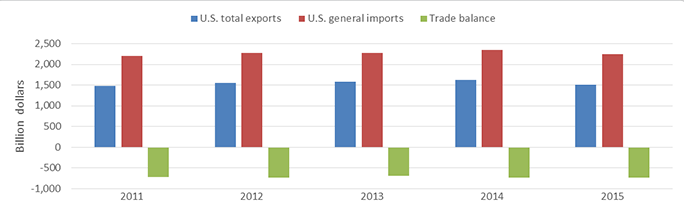
Source: USITC DataWeb/USDOC (accessed February 10, 2016).
Note: See appendix table DT.US.1,
The largest sectoral decline in exports occurred in energy-related products. Exports in this sector decreased by $49.2 billion (30.6 percent) to $111.7 billion, led by a decrease in exports of refined petroleum products (table US.2). The drop in value of exports of energy-related products was primarily the result of falling crude petroleum prices, as export volumes increased in 2015.2
Table US.2: All merchandise sectors: Leading changes in U.S. exports and imports, 2011–15
|
Million $
|
|||||||
|---|---|---|---|---|---|---|---|
| Item | 2011 | 2012 | 2013 | 2014 | 2015 | Absolute change, 2014–15 |
Percent change, 2014–15 |
| U.S. total exports: | |||||||
| Increases: | |||||||
| Transportation equipment: | |||||||
| Aircraft, spacecraft, and related equipment (TE013) | 87,671 | 103,699 | 113,863 | 124,158 | 128,846 | 4,688 | 3.8 |
| Aircraft, spacecraft, and related equipment (TE013) | |||||||
| Certain motor-vehicle parts (TE010) | 40,598 | 44,127 | 45,524 | 45,859 | 47,093 | 1,234 | 2.7 |
| Medicinal chemicals (CH019) | 48,596 | 51,225 | 51,839 | 54,681 | 58,671 | 3,990 | 7.3 |
| Telecommunications equipment (EL002) | 31,516 | 33,605 | 36,107 | 38,945 | 40,853 | 1,908 | 4.9 |
| Semiconductor manufacturing equipment and robotics (MT019) | 16,440 | 14,952 | 15,167 | 16,707 | 18,046 | 1,339 | 8.0 |
| Decreases: | |||||||
| Energy-related products: | |||||||
| Petroleum products (EP005) | 102,041 | 111,836 | 121,010 | 118,679 | 82,131 | -36,548 | -30.8 |
| Natural gas and components (EP006) | 10,578 | 9,251 | 13,025 | 17,974 | 12,007 | -5,967 | -33.2 |
| Crude petroleum (EP004) | 2,084 | 2,634 | 5,099 | 12,309 | 8,739 | -3,570 | -29.0 |
| Transportation equipment: Motor vehicles (TE009) |
63,983 | 70,430 | 74,098 | 77,694 | 70,402 | -7,292 | -9.4 |
| Construction and mining equipment (TE004) | 30,626 | 32,991 | 26,342 | 22,957 | 17,572 | -5,385 | -23.5 |
| Internal combustion piston engines, other than for aircraft (TE002) | 19,318 | 20,265 | 20,240 | 21,756 | 19,602 | -2,154 | -9.9 |
| Agricultural products: Oilseeds (AG032) |
17,949 | 25,129 | 21,934 | 24,230 | 19,210 | -5,020 | -20.7 |
| Cereals (AG030) | 28,160 | 20,368 | 19,954 | 22,413 | 18,549 | -3,863 | -17.2 |
| Minerals and metals: | |||||||
| Steel mill products (MM025) | 17,772 | 18,212 | 17,152 | 17,069 | 13,710 | -3,359 | -19.7 |
| Natural and synthetic gemstones (MM019) | 19,309 | 18,187 | 20,948 | 23,051 | 20,246 | -2,805 | -12.2 |
| Precious metals and non-numismatic coins (MM020) | 44,932 | 45,307 | 40,644 | 29,718 | 27,332 | -2,386 | -8.0 |
| All other | 900,934 | 923,602 | 935,491 | 952,331 | 901,588 | -50,743 | -5.3 |
| Total | 1,482,508 | 1,545,821 | 1,578,439 | 1,620,532 | 1,504,597 | -115,934 | -7.2 |
| U.S. general imports: | |||||||
| Increases: | |||||||
| Medicinal chemicals (CH019) | 92,961 | 89,365 | 85,435 | 93,388 | 109,822 | 16,434 | 17.6 |
| Transportation equipment: Motor vehicles (TE009) |
140,963 | 168,194 | 176,789 | 183,144 | 197,730 | 14,586 | 8.0 |
| Certain motor-vehicle parts (TE010) | 63,368 | 73,333 | 75,215 | 82,005 | 86,151 | 4,145 | 5.1 |
| Electronic products: | |||||||
| Telecommunications equipment (EL002) | 80,170 | 83,922 | 91,781 | 98,137 | 104,960 | 6,823 | 7.0 |
| Medical goods (EL022) | 31,852 | 32,693 | 34,212 | 36,068 | 37,738 | 1,670 | 4.6 |
| Blank and prerecorded media (EL004) | 4,106 | 4,269 | 4,662 | 5,650 | 6,910 | 1,261 | 22.3 |
| Miscellaneous manufactures: | |||||||
| Furniture (MS009) | 24,703 | 26,908 | 28,645 | 31,024 | 34,418 | 3,394 | 10.9 |
| Works of art and miscellaneous manufactured goods (MS017) | 11,540 | 12,573 | 13,979 | 14,244 | 17,267 | 3,023 | 21.2 |
| Decreases: | |||||||
| Energy-related products: | |||||||
| Crude petroleum (EP004) | 336,687 | 315,820 | 273,836 | 246,969 | 126,065 | -120,903 | -49.0 |
| Petroleum products (EP005) | 94,648 | 92,564 | 89,198 | 79,771 | 51,502 | -28,268 | -35.4 |
| Natural gas and components (EP006) | 17,291 | 11,481 | 13,036 | 17,070 | 9,932 | -7,138 | -41.8 |
| Minerals and metals: | |||||||
| Steel mill products (MM025) | 30,890 | 34,231 | 29,117 | 38,163 | 30,493 | -7,671 | -20.1 |
| Precious metals and non-numismatic coins (MM020) | 34,329 | 32,164 | 30,216 | 26,817 | 22,084 | -4,733 | -17.6 |
| Certain base metals and chemical elements (MM041) | 7,511 | 6,761 | 5,850 | 6,700 | 5,310 | -1,390 | -20.7 |
| Copper and related articles (MM036) | 10,979 | 9,732 | 10,155 | 9,141 | 7,914 | -1,226 | -13.4 |
| Natural and synthetic gemstones (MM019) | 23,599 | 21,601 | 24,922 | 26,490 | 25,386 | -1,104 | -4.2 |
| Ferroalloys (MM022) | 3,033 | 2,897 | 2,475 | 3,236 | 2,200 | -1,036 | -32.0 |
| Computers, peripherals, and parts (EL017) | 120,774 | 122,736 | 121,106 | 121,186 | 119,288 | -1,897 | -1.6 |
| Chemicals and related products: Organic specialty chemicals (CH005) |
11,140 | 11,661 | 12,784 | 13,662 | 11,937 | -1,726 | -12.6 |
| Certain organic chemicals (CH006) | 11,290 | 10,715 | 10,970 | 11,660 | 10,416 | -1,244 | -10.7 |
| All other | 1,056,121 | 1,112,645 | 1,133,990 | 1,203,161 | 1,224,140 | 20,978 | 1.7 |
| Total | 2,207,954 | 2,276,267 | 2,268,370 | 2,347,685 | 2,241,664 | -106,022 | -4.5 |
Source: Compiled from official statistics of the U.S. Department of Commerce for the 2011–15 period. These reflect all official revisions of previously published data up to June 2015 (accessed February 10, 2016). Note: Import values are based on Customs value; export values are based on free along ship value, U.S. port of export. Calculations based on unrounded data.
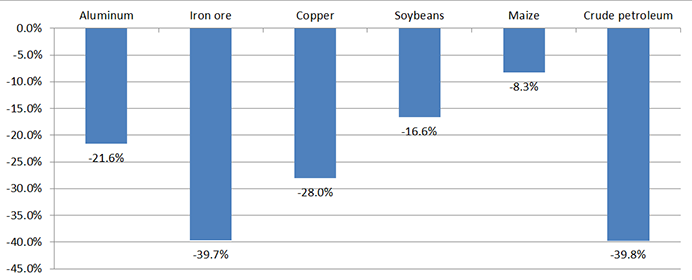
Two other sectors experiencing significant absolute declines in exports included agricultural products and minerals and metals. Exports of agricultural products fell $17.9 billion (10.9 percent) to $146.6 billion, mainly as a result of lower commodity prices (figure US.2) and a stronger U.S. dollar.3 Exports in the minerals and metals sector which fell by $17.2 billion (11.2 percent) to $135.7 billion, largely resulting from sluggish global demand, lower prices for many products in this sector, and the increased value of the U.S. dollar in 2015.4
Figure US.2: Key commodity prices declined significantly from December 2014 to December 2015 (percent)
Sources: World Bank Commodity Markets monthly data (accessed May 3, 2016).
Additionally, although exports had risen in the transportation equipment sector from 2011 to 2014, in 2015 U.S. exports in this segment declined by $10.0 billion (3.0 percent), falling to $326.3 billion. The most significant decline in this sector occurred in exports of motor vehicles, which fell by $7.3 billion (9.4 percent). At the same time, exports of aircraft and related equipment increased by $4.7 billion (3.8 percent), and exports of certain motor vehicle parts rose by $1.2 billion (2.7 percent). There were notable increases in exports of medicinal chemicals, which rose by $4.0 billion (7.3 percent); of telecommunications equipment, which rose by $1.9 billion (4.9 percent); and of semiconductor equipment, which rose by $1.3 billion (8.0 percent).
U.S. Imports5
In 2015, the value of U.S. general imports decreased by $106.0 billion (4.5 percent), falling from $2,347.7 billion to $2,241.7 billion. As with U.S. exports, energy-related products experienced the largest decline by value, with imports of these products dropping by $157.2 billion (44.7 percent) to $194.5 billion. Within this sector, U.S. imports of crude petroleum dropped by $120.9 billion (49.0 percent), and imports of refined petroleum products fell by $28.3 billion (35.4 percent). Given that there was a slight increase in the volume of crude petroleum imported (see table ST.2 in the special topic chapter), the decline in the value of such U.S. imports was entirely due to falling crude petroleum prices. The value of imports in the minerals and metal sector also declined, falling to $188.9 billion (by $16.1 billion, or 7.9 percent).
The value of imports from all remaining sectors, however, rose by $67.2 billion in total, with the largest increases occurring in transportation equipment (by $22.5 billion, or 5.6 percent); electronic products (by $11.0 billion, or 2.5 percent); miscellaneous manufactures (by $10.4 billion, or 9.1 percent); and chemicals and related products (by $8.9 billion, or 3.6 percent). Increases in imports of motor vehicles and motor vehicle parts accounted for more than three-quarters of the growth in the value of imports in the transportation sector, with imports from Mexico accounting for nearly one-third of the total increase. Growth in imports of telecommunications equipment from China, Mexico, and Vietnam comprised about 70 percent of the total increase in the value of U.S. imports of electronic products.
Trade with Major Trading Partners
In 2015, the top trading partners with the United States continued to be China, Canada, Mexico, Japan, and Germany. As in previous years, these five partners accounted for more than half of total U.S. trade with the world. However, by contrast with previous years, in which Canada led all the United States’ trading partners in terms of combined imports and exports, for the first time China was the top U.S. trading partner. The total value of U.S. trade with China was $598.1 billion, higher than total U.S. trade with Canada ($575.2 billion; figure US.3).
Figure US.3: Total trade between the United States and its five largest single-country trading partners, 2015
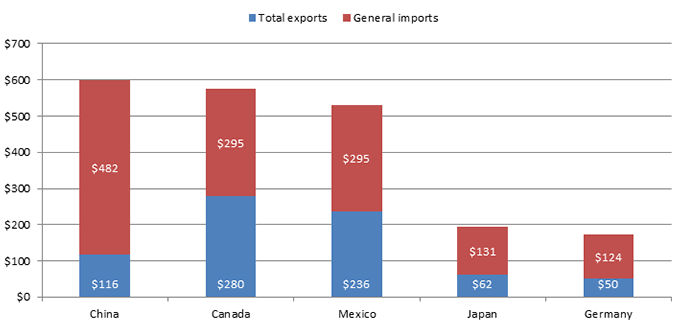
Source: USITC Dataweb/USDOC. (accessed February 10, 2016).
Note: See appendix table DT.US.3.
Of the United States’ major single-country trading partners, the United States saw its exports to Canada decline the most in value in 2015. These exports decreased by $32.4 billion (10.4 percent), falling from $312.4 billion to $280.0 billion (table US.3). The sectors most affected were petroleum products and natural gas, steel mill products, and motor vehicles. U.S. exports to China declined by $7.5 billion (6.1 percent), largely driven by China’s lower level of growth and subsequently lower demand for imports from the United States.6 U.S. exports to the United Kingdom and Germany increased by $2.5 billion (4.7 percent) and $0.6 billion (1.2 percent), respectively.
Table US.3: All merchandise sectors: U.S. total exports, general imports, and merchandise trade balance, by selected trading partners and groups, 2011–15
|
Million $
|
|||||||
|---|---|---|---|---|---|---|---|
| Item | 2011 | 2012 | 2013 | 2014 | 2015 | Absolute change, 2014–15 |
Percent change, 2014–15 |
| U.S. total exports: | |||||||
| China | 104,122 | 110,517 | 121,721 | 123,676 | 116,186 | -7,489 | -6.1 |
| Canada | 281,292 | 292,651 | 300,755 | 312,421 | 280,017 | -32,404 | -10.4 |
| Mexico | 198,289 | 215,875 | 226,070 | 240,249 | 236,377 | -3,871 | -1.6 |
| Japan | 65,800 | 69,976 | 65,216 | 66,827 | 62,472 | -4,356 | -6.5 |
| Germany | 49,294 | 48,803 | 47,362 | 49,363 | 49,947 | 583 | 1.2 |
| South Korea | 43,462 | 42,283 | 41,687 | 44,471 | 43,499 | -973 | -2.2 |
| United Kingdom | 56,033 | 54,860 | 47,348 | 53,823 | 56,353 | 2,530 | 4.7 |
| France | 27,857 | 30,813 | 31,735 | 31,301 | 30,077 | -1,224 | -3.9 |
| Taiwan | 25,932 | 24,337 | 25,470 | 26,670 | 25,929 | -741 | -2.8 |
| India | 21,542 | 22,106 | 21,811 | 21,608 | 21,530 | -78 | -0.4 |
| All other | 608,886 | 633,601 | 649,263 | 650,123 | 582,212 | -67,911 | -10.4 |
| Total | 1,482,508 | 1,545,821 | 1,578,439 | 1,620,532 | 1,504,597 | -115,934 | -7.2 |
| EU-28 | 269,580 | 265,683 | 262,086 | 276,142 | 272,688 | -3,455 | -1.3 |
| OPEC | 64,809 | 81,727 | 84,711 | 82,346 | 72,781 | -9,566 | -11.6 |
| Latin America | 367,301 | 399,059 | 410,430 | 424,267 | 389,684 | -34,584 | -8.2 |
| Asia | 380,707 | 386,986 | 402,000 | 407,156 | 386,215 | -20,941 | -5.1 |
| Sub-Saharan Africa | 21,165 | 22,503 | 23,979 | 25,488 | 17,832 | -7,656 | -30.0 |
| U.S. general imports: | |||||||
| China | 399,371 | 425,619 | 440,434 | 466,754 | 481,881 | 15,126 | 3.2 |
| Canada | 315,325 | 324,263 | 332,558 | 347,798 | 295,190 | -52,608 | -15.1 |
| Mexico | 262,874 | 277,594 | 280,555 | 294,074 | 294,741 | 667 | 0.2 |
| Japan | 128,928 | 146,432 | 138,574 | 134,004 | 131,120 | -2,884 | -2.2 |
| Germany | 98,684 | 109,226 | 114,349 | 123,260 | 124,139 | 880 | 0.7 |
| South Korea | 56,661 | 58,899 | 62,433 | 69,518 | 71,827 | 2,309 | 3.3 |
| United Kingdom | 51,263 | 55,006 | 52,850 | 54,392 | 57,805 | 3,413 | 6.3 |
| France | 40,049 | 41,646 | 45,706 | 46,874 | 47,644 | 770 | 1.6 |
| Taiwan | 41,405 | 38,861 | 37,939 | 40,581 | 40,708 | 127 | 0.3 |
| India | 36,154 | 40,513 | 41,809 | 45,244 | 44,741 | -503 | -1.1 |
| All other | 777,240 | 758,210 | 721,162 | 725,185 | 651,866 | -73,319 | -10.1 |
| Total | 2,207,954 | 2,276,267 | 2,268,370 | 2,347,685 | 2,241,664 | -106,022 | -4.5 |
| EU-28 | 368,902 | 382,199 | 387,643 | 418,201 | 426,006 | 7,805 | 1.9 |
| OPEC | 191,470 | 180,752 | 152,690 | 132,349 | 66,150 | -66,199 | -50.0 |
| Latin America | 437,165 | 449,385 | 439,073 | 444,765 | 410,614 | -34,152 | -7.7 |
| Asia | 796,218 | 849,741 | 865,577 | 910,934 | 941,481 | 30,547 | 3.4 |
| Sub-Saharan Africa | 74,322 | 49,624 | 39,294 | 26,773 | 18,856 | -7,917 | -29.6 |
| U.S. merchandise trade balance: | |||||||
| China | -295,250 | -315,102 | -318,713 | -343,079 | -365,695 | -22,616 | -6.6 |
| Canada | -34,033 | -31,612 | -31,803 | -35,377 | -15,174 | 20,204 | 57.1 |
| Mexico | -64,585 | -61,719 | -54,485 | -53,825 | -58,364 | -4,538 | -8.4 |
| Japan | -63,128 | -76,456 | -73,358 | -67,176 | -68,648 | -1,472 | -2.2 |
| Germany | -49,390 | -60,423 | -66,987 | -73,896 | -74,193 | -296 | -0.4 |
| South Korea | -13,200 | -16,616 | -20,747 | -25,047 | -28,329 | -3,282 | -13.1 |
| United Kingdom | 4,771 | -145 | -5,502 | -569 | -1,452 | -883 | -155.3 |
| France | -12,192 | -10,833 | -13,971 | -15,573 | -17,567 | -1,994 | -12.8 |
| Taiwan | -15,473 | -14,524 | -12,469 | -13,911 | -14,779 | -868 | -6.2 |
| India | -14,612 | -18,407 | -19,997 | -23,637 | -23,212 | 425 | 1.8 |
| All other | -168,354 | -124,609 | -71,899 | -75,062 | -69,655 | 5,408 | 7.2 |
| Total | -725,447 | -730,446 | -689,931 | -727,153 | -737,066 | -9,913 | -1.4 |
| EU-28 | -99,322 | -116,517 | -125,557 | -142,058 | -153,318 | -11,259 | -7.9 |
| OPEC | -126,661 | -99,026 | -67,979 | -50,003 | 6,631 | 56,634 | (a) |
| Latin America | -69,864 | -50,326 | -28,643 | -20,498 | -20,930 | -432 | -2.1 |
| Asia | -415,512 | -462,756 | -463,577 | -503,778 | -555,266 | -51,488 | -10.2 |
| Sub-Saharan Africa | -53,157 | -27,122 | -15,315 | -1,285 | -1,024 | 261 | 20.3 |
Source: Compiled from official statistics of the U.S. Department of Commerce for the 2011–15 period. These reflect all official revisions of previously published data up to June 2015 (accessed February 10, 2016).
Note: Import values are based on Customs value; export values are based on free along ship value, U.S. port of export. Calculations based on unrounded data.
aNot meaningful for purposes of comparison.
Although the United States’ imports from most of its major trading partners increased in 2015, U.S. imports from Canada, Japan, and India declined in 2015. U.S. imports from Canada experienced the largest decline among major U.S. trading partners, falling by $52.6 billion (15.1 percent) from $347.8 billion to $295.2 billion. The drop in imports was largely driven by declines in imports of crude petroleum ($36.2 billion), natural gas ($6.7 billion), and petroleum products ($3.7 billion). Imports from China experienced the largest increase by value among major U.S. trading partners, growing by $15.1 billion (3.2 percent). Notably, U.S. imports from members of the Organization of the Petroleum Exporting Countries (OPEC) declined by $66.2 billion (50.0 percent) to $66.2 billion, again, largely as a result of lower crude petroleum prices rather than changes in import volumes. Other significant decreases in U.S. imports occurred in steel mill products (down $7.7 billion or 20.1 percent), resulting from a decline in both prices and volume imported, and natural gas and components (down $7.1 billion or 41.8 percent).
U.S. Trade Balance
The U.S. trade deficit increased by $9.9 billion (1.4 percent) in 2015 to reach $737.1 billion, the highest level in the 2011–15 period. In 2015, only the agricultural products sector had a trade surplus; however, this surplus continued to decline, down $18.5 billion (65.7 percent) in 2015. All other sectors maintained trade deficits, with the trade deficit shrinking in only one of the remaining sectors—energy-related products. The significant decrease of $108.0 billion (56.6 percent) in this sector’s deficit, which fell to $82.7 billion, partly offset the declining trade balance in every other sector and limited the growth of the overall trade shortfall. Sectors experiencing a large value increase in trade deficits included transportation equipment, in which the deficit grew from $32.5 billion to $99.2 billion, or by 48.7 percent; chemicals and related products, in which it grew from $15.8 billion to $32.4 billion, or by 95.2 percent; electronic products, in which it grew by $14.9 billion, or 8.7 percent; and miscellaneous manufactures, in which it grew by $10.7 billion, or 16.0 percent.
The U.S. trade deficit with China increased by $22.6 billion (6.6 percent); with the United Kingdom, by $0.9 billion (155.3 percent). Of the major U.S. trading partners, the trade shortfalls with Canada and India were the only ones to decline in 2015, with the trade deficit with Canada contracting by $20.2 billion (57.1 percent) to $15.2 billion. The overall U.S. trade deficit with Asia (as a region) increased by $51.5 billion (10.2 percent). By contrast, the United States had a $6.6 billion trade surplus with the OPEC countries, a reversal from previous years.
1 For more information on reasons for the sectoral trade shifts discussed here, please see the individual sector webpages.
2 For more information, please see the “Energy and Related Products“ webpage.
3 USDA, ERS, “Agricultural Exports and Trade Balance Are Declining,” January 26, 2016.
4 USGS, Minerals Commodity Summaries 2016, 2016, 7.
5 For more information on reasons for the sectoral trade shifts discussed here, please see the individual sector webpages.
6 IMF, World Economic Outlook Update, January 2016.