
Author: Mihir P. Torsekar
International Trade Analyst
Change in 2015 from 2014:
 To view changing data, mouseover the graphic below.
- U.S. total exports: Decreased by $18.6 billion (-5.1 percent) to $347.4 billion
- U.S. general imports: Increased by $29.1 billion (3.4 percent) to $896.4 billion
- U.S. trade deficit: Increased by $47.7 billion (9.5 percent) to $548.9 billion
The Regional Comprehensive Economic Partnership (RCEP) is a group of 13 countries in Asia that is currently (at the time of writing) negotiating a free trade agreement.1 While the United States is not a part of RCEP, the group includes significant U.S. trade partners, such as China, India, Japan, South Korea, and others. Although there is some overlap in membership between RCEP and the recently concluded Trans-Pacific Partnership (TPP), there are major economies that are part of one, but not the other (see figure RCEP.1 below, which also shows how the two groups’ memberships overlap with that of the Association of Southeast Asian Nations, or ASEAN).
Figure RCEP.1: While RCEP has 16 members and TPP has 12 members, 7 members belong to both RCEP and TPP (as of August 2016)
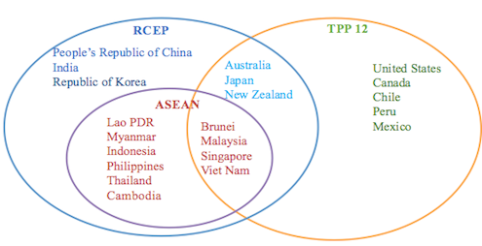
Source: Asia Foundation.
U.S. Total Exports
In 2015, U.S. total exports to the participants in the proposed RCEP fell by $18.6 billion to $347.4 billion (RP.1), as almost all the sectors under consideration recorded drops in exports.2> The largest decrease in export value occurred in the agricultural products sector, where U.S. exports fell by $8.2 billion (13.0 percent decrease from 2014) to $54.8 billion (table RCEP.1). This reduction was primarily led by a decline of $4.4 billion (24.7 percent) in exports of oilseeds; of $1.0 billion (33.5 percent) in exports of dairy products; and of $968 million (11.1 percent) in exports of cereals to RCEP countries (table RCEP 2).]
Table RP.1: RCEP: U.S. total exports, general imports, and merchandise trade balance, by major industry/commodity sectors, 2011–15
|
Million $
|
|||||||
|---|---|---|---|---|---|---|---|
| Item | 2011 | 2012 | 2013 | 2014 | 2015 | Absolute change, 2014–15 |
Percent change, 2014–15 |
| U.S. total exports: | |||||||
| Agricultural products | 55,172 | 61,048 | 60,066 | 62,943 | 54,750 | -8,193 | -13.0 |
| Forest products | 12,927 | 12,084 | 12,685 | 13,081 | 11,861 | -1,220 | -9.3 |
| Chemicals and related products | 52,267 | 51,499 | 50,218 | 50,403 | 49,352 | -1,051 | -2.1 |
| Energy-related products | 16,731 | 16,017 | 15,641 | 13,756 | 10,867 | -2,888 | -21.0 |
| Textiles and apparel | 3,375 | 3,496 | 3,687 | 3,513 | 3,061 | -452 | -12.9 |
| Footwear | 365 | 355 | 351 | 376 | 419 | 43 | 11.4 |
| Minerals and metals | 35,799 | 32,699 | 32,873 | 30,822 | 26,882 | -3,940 | -12.8 |
| Machinery | 32,438 | 33,087 | 32,482 | 33,842 | 32,943 | -899 | -2.7 |
| Transportation equipment | 53,215 | 63,970 | 69,865 | 73,935 | 74,404 | 469 | 0.6 |
| Electronic products | 67,393 | 68,032 | 68,537 | 70,164 | 70,470 | 307 | 0.4 |
| Miscellaneous manufactures | 6,041 | 5,892 | 6,103 | 6,349 | 6,081 | -268 | -4.2 |
| Special provisions | 6,797 | 6,512 | 6,253 | 6,824 | 6,345 | -479 | -7.0 |
| Total | 342,519 | 354,691 | 358,760 | 366,007 | 347,436 | -18,571 | -5.1 |
| U.S. general imports: | |||||||
| Agricultural products | 28,423 | 31,458 | 29,840 | 33,017 | 32,228 | -789 | -2.4 |
| Forest products | 10,044 | 10,842 | 11,172 | 11,973 | 12,621 | 647 | 5.4 |
| Chemicals and related products | 66,425 | 69,566 | 68,975 | 72,874 | 73,056 | 182 | 0.2 |
| Energy-related products | 9,864 | 9,479 | 10,999 | 10,719 | 8,216 | -2,503 | -23.4 |
| Textiles and apparel | 73,872 | 74,152 | 77,094 | 79,275 | 83,156 | 3,881 | 4.9 |
| Footwear | 19,955 | 20,953 | 21,603 | 22,543 | 24,020 | 1,477 | 6.6 |
| Minerals and metals | 52,955 | 55,991 | 57,141 | 63,366 | 62,690 | -675 | -1.1 |
| Machinery | 69,613 | 76,487 | 77,445 | 83,012 | 85,093 | 2,081 | 2.5 |
| Transportation equipment | 91,342 | 112,522 | 112,945 | 117,661 | 125,685 | 8,025 | 6.8 |
| Electronic products | 247,758 | 258,623 | 266,067 | 281,357 | 289,980 | 8,623 | 3.1 |
| Miscellaneous manufactures | 69,340 | 72,204 | 74,519 | 77,626 | 84,510 | 6,884 | 8.9 |
| Special provisions | 13,199 | 15,074 | 15,156 | 13,815 | 15,117 | 1,302 | 9.4 |
| Total | 752,788 | 807,353 | 822,956 | 867,238 | 896,372 | 29,135 | 3.4 |
| U.S. merchandise trade balance: | |||||||
| Agricultural products | 26,749 | 29,590 | 30,226 | 29,925 | 22,521 | -7,404 | -24.7 |
| Forest products | 2,883 | 1,241 | 1,513 | 1,107 | -760 | -1,867 | (a) |
| Chemicals and related products | -14,158 | -18,067 | -18,757 | -22,471 | -23,704 | -1,233 | -5.5 |
| Energy-related products | 6,868 | 6,538 | 4,642 | 3,037 | 2,652 | -385 | -12.7 |
| Textiles and apparel | -70,498 | -70,656 | -73,407 | -75,762 | -80,094 | -4,333 | -5.7 |
| Footwear | -19,590 | -20,598 | -21,252 | -22,167 | -23,601 | -1,434 | -6.5 |
| Minerals and metals | -17,156 | -23,292 | -24,268 | -32,543 | -35,808 | -3,265 | -10.0 |
| Machinery | -37,175 | -43,400 | -44,964 | -49,170 | -52,150 | -2,980 | -6.1 |
| Transportation equipment | -38,127 | -48,552 | -43,080 | -43,726 | -51,281 | -7,555 | -17.3 |
| Electronic products | -180,365 | -190,591 | -197,530 | -211,193 | -219,510 | -8,317 | -3.9 |
| Miscellaneous manufactures | -63,298 | -66,312 | -68,416 | -71,277 | -78,428 | -7,152 | -10.0 |
| Special provisions | -6,403 | -8,562 | -8,903 | -6,991 | -8,772 | -1,781 | -25.5 |
| Total | -410,269 | -452,662 | -464,196 | -501,231 | -548,937 | -47,706 | -9.5 |
Source: Compiled from official statistics of the U.S. Department of Commerce for the 2011–15 period. These reflect all official revisions of previously published data up to June 2015 (accessed June 28, 2016). Note: Import values are based on Customs value; export values are based on free along ship value, U.S. port of export. Calculations based on unrounded data. Sectors are ordered by the level of processing of the products classified within each sector. aNot meaningful for purposes of comparison.
Table RP.2: RCEP: Leading changes in U.S. exports and imports, 2011–15
|
Million $
|
|||||||
|---|---|---|---|---|---|---|---|
| Item | 2011 | 2012 | 2013 | 2014 | 2015 | Absolute change, 2014–15 |
Percent change, 2014–15 |
| U.S. total exports: | |||||||
| Decreases: | |||||||
| Agricultural products: | |||||||
| Oilseeds (AG032) | 13,106 | 18,365 | 16,308 | 17,717 | 13,337 | -4,380 | -24.7 |
| Dairy products (AG010) | 1,946 | 2,013 | 2,796 | 3,113 | 2,071 | -1,043 | -33.5 |
| Cereals (AG030) | 10,650 | 8,401 | 7,480 | 8,723 | 7,755 | -968 | -11.1 |
| Minerals and metals: | |||||||
| Copper and related articles (MM036) | 4,497 | 4,506 | 4,013 | 3,578 | 2,415 | -1,162 | -32.5 |
| Unwrought aluminum (MM037) | 3,255 | 2,852 | 2,695 | 2,231 | 1,813 | -418 | -18.8 |
| All other | 309,065 | 318,554 | 325,468 | 330,645 | 320,045 | -10,599 | -3.2 |
| Total | 342,519 | 354,691 | 358,760 | 366,007 | 347,436 | -18,571 | -5.1 |
| U.S. general imports: | |||||||
| Increases: | |||||||
| Electronic products: | |||||||
| Semiconductors and integrated circuits (EL015) | 22,916 | 20,996 | 21,259 | 23,723 | 29,213 | 5,490 | 23.1 |
| Telecommunications equipment (EL002) | 55,289 | 64,453 | 72,509 | 79,941 | 84,112 | 4,170 | 5.2 |
| Motor vehicles (TE009) | 39,096 | 48,919 | 50,768 | 49,451 | 54,144 | 4,694 | 9.5 |
| Furniture (MS009) | 17,588 | 19,318 | 20,514 | 22,115 | 24,861 | 2,746 | 12.4 |
| Decreases: | |||||||
| Petroleum products (EP005) | 6,626 | 7,326 | 8,766 | 8,702 | 6,788 | -1,914 | -22.0 |
| All other | 611,274 | 646,341 | 649,140 | 683,305 | 697,254 | 13,949 | 2.0 |
| Total | 752,788 | 807,353 | 822,956 | 867,238 | 896,372 | 29,135 | 3.4 |
Source: Compiled from official statistics of the U.S. Department of Commerce for the 2011–15 period. These reflect all official revisions of previously published data up to June 2015 (accessed June 30, 2016). Note: Import values are based on Customs value; export values are based on free along ship value, U.S. port of export. Calculations based on unrounded data.
U.S. exports to China and South Korea registered the biggest declines in in the agriculture sector; the value of oilseed exports to China declined by $4.0 billion, and the export value of cereals, oilseeds, dairy products, and animal feeds to South Korea fell by $1.5 billion during 2015.3
In 2015, all agricultural sectors included within the Food Agricultural Organization price index fell by double digits, with the largest price reductions occurring for sugar (21 percent), vegetable oils (19 percent), cereals (15.4 percent), and meat (15.1 percent).4 Global agricultural prices declined nearly 30 percent during 2011–15 because of the combined impact of growing world output and decreasing demand from leading importers, such as China (the Chinese decline in demand is consistent with the overall slowdown of growth in its domestic economy).5
The second largest decline in U.S. total exports to RCEP was a $3.9 billion decrease in minerals and metals to $26.9 billion, largely due to a combined $2.6 billion reduction in copper and related articles, unrefined and refined copper, and unwrought aluminum, among other minerals and metals.
U.S. exports to China for various other commodities in this sector fell by a combined $9.7 billion, including copper and related articles (down $2.0 billion to $9.2 billion), unrefined and refined copper (down $556 million to $18 million), and unwrought aluminum (down $457 million to $1.3 billion), as Chinese construction activity declined. China has been the world's largest consumer of this sector's products since 2002, and lower demand stemming from the country's slowing economic growth placed downward pressure on consumption and unit values.6
U.S. General Imports
The $29.1 billion (3.4 percent) growth of U.S. general imports from RCEP to $896.4 billion was principally driven by electronic products, the largest import category from RCEP, which increased by $8.6 billion to $290.0 billion; miscellaneous manufactures (increasing by $6.9 billion to $84.5 billion); and transportation equipment (increasing by $8.0 billion to $125.7 billion). Overall expansion of U.S. general imports was offset by a $2.5 billion reduction in imports of energy-related products (see the “Energy and Related Products” webpage and the special topic chapter for detailed discussions on worldwide decline in energy prices).
During 2011–15, the electronic products category was the leading U.S. import sector from RCEP countries and accounted for one-third of total U.S. imports from the partnership in 2015. In particular, U.S. imports of semiconductors, integrated circuits, and telecommunications equipment from China accounted for the majority of the expansion in imports for this sector. China is the world's leading manufacturer of various consumer electronics, supplying 70 percent of U.S. electronic product imports in 2015. The telecommunications equipment subsector accounted for many of these products, with the release of the Apple iPhone 6s and 6s Plus in September 2015 contributing to a 30 percent increase in U.S. imports of cellphones during the second half of the year.7
U.S. furniture imports went up from $22.1 billion in 2014 to $24.9 billion in 2015—a 12.4 percent. This may be attributable, at least in part, to U.S. home sales trends; 2015 was the best year for single-family home purchases in the United States since 2007, a development that likely translated into heightened sales of furniture.8 U.S. imports of furniture in 2015 reached a three-year high, with Malaysia and Vietnam (both RCEP and TPP participants) supplying nearly 40 percent of these goods.9
Growth in U.S. general imports of transportation equipment resulted from greater demand for motor vehicles and associated parts, imports of which collectively grew by $4.7 billion to $80.7 billion in 2015. U.S. purchases of cars reached a record in 2015 amid cheaper gasoline, an improving labor market, and low interest rates, all facilitating the financing of vehicles.10
U.S. Trade Balance
The U.S. trade deficit with RCEP continued the growth trend seen during 2011–14, increasing by $44.5 billion to $520.7 billion. With the exception of energy products, the U.S. trade deficit with RCEP countries expanded across every sector during this time period. In large part, this reflected higher U.S. consumption of electronic products, miscellaneous manufactures, and transportation equipment, along with decreases in the value of U.S. total exports of agricultural products to RCEP countries. Growth in imports was largely influenced by the expansion of the U.S. economy in 2015, which translated into increased purchases of furniture, consumer electronics, and motor vehicles, the leading producers of which are based in RCEP participant economies. Reduced U.S. total exports of agricultural products are attributable to falling demand from leading global importers, such as China, and a surplus of global output.
1 Negotiations for RCEP started in 2012 and, as of September 2016, were still underway. The countries included within this partnership are Australia, Brunei Darussalam (Brunei), Burma, Cambodia, China, India, Indonesia, Japan, South Korea, Laos, Malaysia, New Zealand, the Philippines, Thailand, Singapore, and Vietnam.
2 Footwear was the only exception, registering a $57 million increase to $345 million.
3 Official statistics of the U.S. Department of Commerce (DataWeb) (accessed April 20, 2016).
4 Plimmer, “Global Food Prices,” January 14, 2016.
5 Terazono, “Agricultural Commodities,” August 12, 2015.
6 Sanderson, “China Stockpiles Intrigue,” April 5, 2016; Hammer, “China's Dominance,” August 2012.
7 Bartash, “Déjà vu,” October 6, 2015; Page, “iPhone,” October 26, 2015.
8 Soergel, “After 2015 Surge,” January 27, 2016.
9 GWMI, “Strong Increase,” March 4, 2016.
10 Spector, “U.S. Car Sales,” January 5, 2016.