
Shifts in U.S. Merchandise Trade, 2015
Investigation No. 332-345
Publication 4641 (September 2016)
Welcome to Shifts in U.S. Merchandise Trade, 2015 (also called 2015 Trade Shifts), published by the U.S. International Trade Commission (Commission or USITC). The Commission’s annual detailed analysis of shifts in U.S. trade, addressing 4 U.S. trading partners/regions and 10 individual sectors, is web-based and enhanced by interactive features. Also, since a major story in 2015 was the decline in energy prices, this year’s special topic chapter examines the various impacts of declining energy prices on U.S. sectoral trade.
As in last year’s report, a variety of trade measures are used in 2015 Trade Shifts to allow a more inclusive look at the composition of U.S. trade flows. Data for total exports ![]() are presented and analyzed in this report’s first two parts. The first part includes a macroeconomic overview of the U.S. economy in 2014–15, while the second examines U.S. bilateral trade flows with Brazil, Russia, U.S. partners in the North American Free Trade Agreement (NAFTA)
are presented and analyzed in this report’s first two parts. The first part includes a macroeconomic overview of the U.S. economy in 2014–15, while the second examines U.S. bilateral trade flows with Brazil, Russia, U.S. partners in the North American Free Trade Agreement (NAFTA) ![]() , and parties to ongoing negotiations for the Regional Comprehensive Economic Partnership (RCEP)
, and parties to ongoing negotiations for the Regional Comprehensive Economic Partnership (RCEP) ![]() (The RCEP is a large proposed regional trade agreement in the Asia-Pacific region to which the United States is not a party.)
(The RCEP is a large proposed regional trade agreement in the Asia-Pacific region to which the United States is not a party.) ![]() The third part contains 10 sector analyses that focus on general imports, domestic exports
The third part contains 10 sector analyses that focus on general imports, domestic exports  exported goods that were grown, produced, or manufactured in the United States, and (2) exported commodities of foreign origin that have been changed in the United States (including changes made in a U.S. FTZ) from the form in which they were imported, or that have been enhanced in value or improved in condition by further processing or manufacturing in the United States.") , and re-exports , highlighting sectors in which re-exports play a significant role.
, and re-exports , highlighting sectors in which re-exports play a significant role.
Like last year’s report, 2015 Trade Shifts is published only in a Web-based format to optimize the use of interactive features. User-friendly, in-line interactive graphics integrated with the analyses appear at the top of each trading partner/region and sector webpage. Viewers can change the data presentation in any graphic by hovering their cursors over the graphic.
We appreciate feedback. Please email comments to TradeShifts@usitc.gov.
Contents
2015 Trade Shifts provides a comprehensive review of U.S. trade performance in 2015. It focuses on changes in U.S. exports and imports of key natural resources, as well as products of leading agricultural and manufacturing industries; it also examines changes in U.S. trade with 4 key partners and country groups. Profiles of the U.S. industry and market for 10 major U.S. sectors that cover a majority of the products traded are also included. The analyses principally examine:
- Industry developments and the principal drivers influencing trends in U.S. trade; and
- Bilateral trade flows between the United States and 4 key trading partners/regions, addressing the factors which influenced trade in the leading products traded.
As mentioned above, 2015 Trade Shifts concludes with a “special topic” webpage—”Effects of Declining Crude Petroleum and Natural Gas Prices on U.S. Sectoral Trade”—which examines the impact that declining energy prices have had on U.S. sectoral trade flows.
Readers can access the different sections of the study, including a complete set of trade tables and “Frequently Asked Questions” (FAQs), by following the live links on this 2015 Trade Shifts home page. Alternatively, readers can always navigate to links in the “Trade Shifts Index” or “Resources” boxes at the top left of each page. Below is a brief overview of the principal developments in U.S. trade during the past year, followed by links to more detailed analyses.
Key Economic Events
|
  |
|
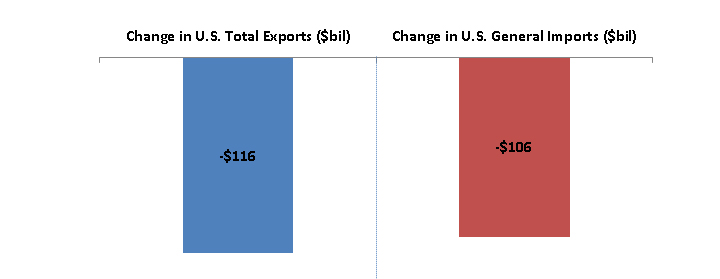
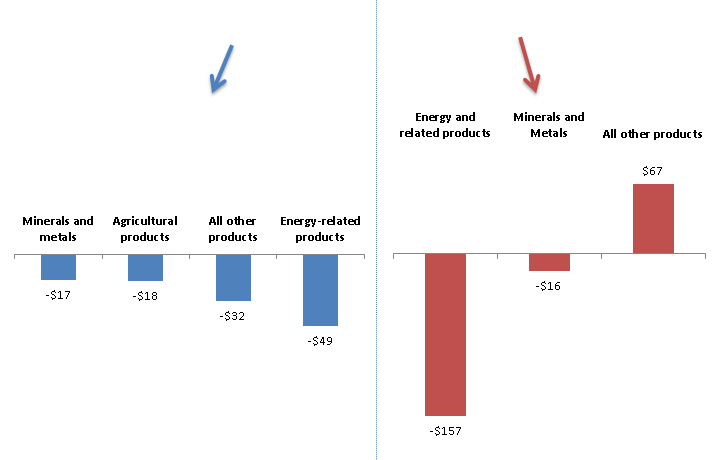
- In 2015, U.S. total exports fell by $116.0 billion (7.2 percent) from 2014 levels to $1,504.6 billion. The primary reasons for the decrease were declining crude petroleum prices, weak global economic growth that dampened global demand, and continued appreciation of the U.S. dollar. Exports in all but one of the sectors discussed in this report declined; the only sector that experienced higher exports was footwear, which increased by $3.0 billion (0.2 percent).
- U.S. general imports decreased by $106.0 billion (4.5 percent), falling to $2,241.7 billion. As with U.S. exports, energy-related products experienced the largest decline by value, with imports of these products falling by $157.2 billion (44.7 percent) to $194.5 billion. Imports in the minerals and metal sector also declined by value. On the other hand, imports from all remaining sectors increased by $67.2 billion in total, with the greatest increases by value occurring in transportation equipment (by $22.5 billion, or 5.6 percent); electronic products (by $11.0 billion, or 2.5 percent); miscellaneous manufactures (by $10.4 billion, or 9.1 percent); and chemicals and related products (by $8.9 billion, or 3.6 percent).
- One of the major factors affecting U.S. trade in 2015 was the decline in the prices of crude petroleum and natural gas. According to the Council of Economic Advisors (CEA), these price declines provided a modest net benefit to the U.S. economy in 2015. The price declines contributed to higher U.S. imports of consumer goods, largely offsetting lower imports of energy-related manufactured goods. Lower prices also contributed to a substantial decline in the value of certain U.S. manufactured goods exports, as global demand for U.S. equipment used in crude petroleum and natural gas production fell and as the value of U.S. exports by energy-consuming industries also declined. The large decline in the value of exports by U.S. energy-consuming industries masks an increase in the quantity of their exports as well as a rise in certain sectors’ global competitiveness due to lower input prices.
Part I:
Part II: Country Shifts
Part II analyzes shifts in trade between the United States and four key trading partners:
- Brazil
- Russia
- U.S. partners in the North American Free Trade Agreement (NAFTA)
- The Regional Comprehensive Economic Partnership (RCEP)
Part III: Sector Shifts
Part III analyzes shifts in trade for the following 10 merchandise sectors:
- Agricultural Products
- Chemicals and Related Products
- Electronic Products
- Energy and Related Products
- Footwear
- Forest Products
- Machinery
- Minerals and Metals
- Textiles and Apparel
- Transportation Equipment
Part IV: Special Topic:
General Contacts
Office of Industries
Tradeshifts@usitc.gov
Elizabeth R. Nesbitt
Project Leader
Dan Kim
Deputy Project Leader
Media Contact
Peg O’Laughlin
Public Affairs Officer
202-205-1819