Change in 2012 from 2011:
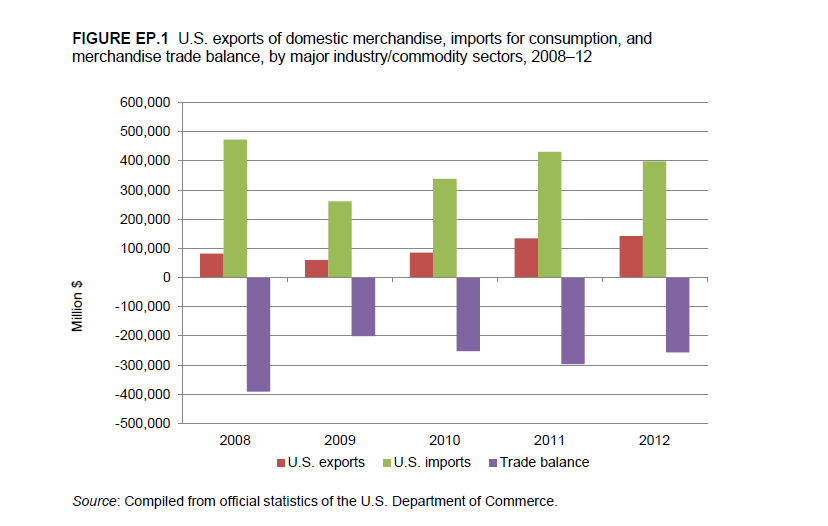
- U.S. trade deficit: Decreased by $40.6 billion (14 percent) to $256.2 billion
- U.S. exports: Increased by $8.2 billion (6 percent) to $142.3 billion
- U.S. imports: Decreased by $32.4 billion (8 percent) to $398.4 billion
The U.S. trade deficit in the energy-related products sector fell by 14 percent in 2012, due principally to increased domestic production, lower domestic demand, and increased exports of petroleum products, particularly distillate fuel oils (a product of distillation used for diesel fuels and space heating) and motor fuels (figure EP.1).
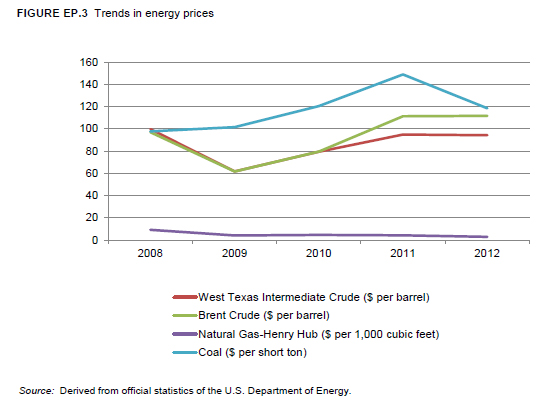
During 2011-12, prices for most energy-related products followed the trends in crude petroleum prices, remaining relatively stable or even declining slightly, albeit from historical highs (figure EP.2).
The world benchmark prices for a barrel of Brent Crude and West Texas Intermediate stabilized in response to increased production by the United States and other non-OPEC suppliers, spurred by rising global consumption. U.S. natural gas prices decreased in 2012 in response to increased U.S. production from shale areas. Global coal prices also declined in 2012 as electric utilities (which have been primary consumers of coal) switched to the cleaner-burning natural gas.
Canada remains the primary U.S. trading partner for energy-related products, and the trade deficit with Canada in 2012 remained relatively stable at roughly $85 billion. By contrast, the U.S. trade deficit in energy-related products with OPEC member countries decreased by 12 percent to $140.9 billion in 2012. Further, the U.S. trade deficit with Latin American countries, which accounted for about 16 percent of the total U.S. trade deficit in this sector in 2012, dropped by 34 percent to $40.6 billion.
Crude petroleum is the primary energy product in this sector, accounting for 43 percent of total U.S. trade in energy-related products in 2012, and for 57 percent of imports of these products. The trade deficit in crude petroleum decreased in 2012 (by 8 percent) for the first time since 2009, due to falling U.S. imports. Nevertheless, the United States remained a significant importer of crude petroleum, accounting for about 23 percent of global crude petroleum imports.
U.S. Exports
U.S. exports of energy-related products increased by 6 percent to $142.3 billion in 2012. Mexico, followed by Canada, remained the primary markets for U.S. exports. However, the largest export shifts in 2012 were with South America, where the United States saw impressive growth in shipments to Venezuela, Colombia, and Brazil. The leading energy-related products exported from the United States in 2012 were petroleum products and coal, along with relatively small quantities of natural gas and crude petroleum.
Petroleum Products
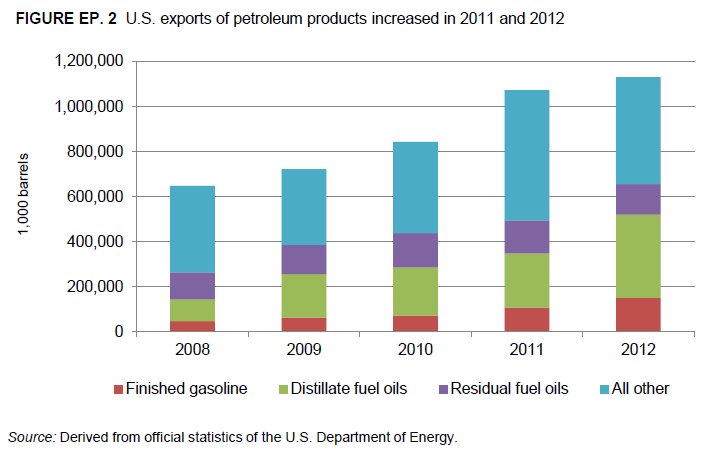
The value of U.S. imports of petroleum products exceeded the value of exports because of the product mix and price. Beginning in late 2011 and continuing into 2012, the United States, for the first time in over 60 years, exported a larger volume of petroleum products than it imported; exports rose by about 7 percent to 1.1 billion barrels in 2012. Most of the increase in the quantity of U.S. exports of petroleum products is attributed to three factors: reduced domestic fuel demand, due in part to a lagging economy and more fuel-efficient cars; increased U.S. production of crude petroleum, particularly owing to U.S. refiners’ increased supplies of crude petroleum from North Dakota’s Bakken formation; and high demand for distillate fuel oils on the world market.
U.S. exports to Venezuela increased in quantity and value after a massive explosion occurred in September 2012 at the Paraguaná refinery, Venezuela’s largest. As a result, U.S. exports of motor fuels, distillate fuel oils, and specialty naphthas doubled in quantity. Other U.S. markets for exports of petroleum products include the Netherlands, the shipping point for U.S. exports of distillate and residual fuel oils to Europe, and Latin America, to supplement decreased production in Brazil after several refineries there had still not reached full capacity after a 2010-11 shutdown.
Coal, Coke, and Other Carbonaceous Materials
In 2012, U.S. exports of coal, coke, and other related products decreased in value by 9 percent to $17.8 billion. However, the quantity of exports increased by 17 percent to 125.7 million short tons in 2012 due to growing foreign consumption of U.S. coking coals (used for steel making), which are considered to be among the highest quality bituminous coals available.
Natural Gas
The quantity of U.S. natural gas exports increased by 7 percent to 1.6 trillion cubic feet in 2012; 98 percent of these exports were pipeline natural gas. However, due to lower prices, the value of U.S. natural gas exports — pipeline gas and liquefied natural gas (LNG) — actually decreased, from $10.4 billion in 2011 to $9.2 billion in 2012. The United States’ North American Free Trade Agreement (NAFTA) partners remain the primary U.S. export markets, as most U.S. trade in natural gas is via pipelines shared with Canada and, to a lesser extent, Mexico; trade fluctuates from year to year based on market size along the pipeline.
The volume of U.S. exports of LNG decreased by 60 percent to 28.3 billion cubic feet in 2012, primarily as a result of increased consumption of natural gas in the United States and decreased exports to Japan and the Republic of Korea (Korea). U.S. exports of LNG to Japan fell from 18 trillion cubic feet in 2011 to 14 trillion cubic feet in 2012. The decline occurred primarily because Japanese power plants that use natural gas as their fuel source were still operating well below capacity, due to damage from the March 2011 Tohoku earthquake and tsunami. Korea stopped importing U.S. LNG in 2012 as a result of high spot market prices ranging from $15 to $18 per thousand cubic feet; instead, it increased purchases under multiyear contracts from Oman, Indonesia, and Qatar.
U.S. Imports
In 2012, U.S. imports of energy-related products decreased by 8 percent to $398.4 billion, as both the quantities and price of imports declined. Canada remained the leading source of U.S. imports of energy-related products, with Saudi Arabia, Mexico, Russia, Venezuela, and Nigeria being the other major U.S. import suppliers. However, there were significant shifts in importance among the suppliers; in particular, imports of crude petroleum from Nigeria saw very large declines, while those from Saudi Arabia saw significant growth. Crude petroleum continued to be the primary energy product imported in 2012, accounting for 58 percent of the total value of sector imports; petroleum products accounted for 32 percent, and natural gas for 7 percent.
Crude Petroleum
The United States is the world’s largest net importer of crude petroleum. The value of U.S. imports of crude petroleum declined by 7 percent to $298.9 billion in 2012, and the quantity declined by 5 percent to 3.1 billion barrels, as U.S. consumption fell by about 5 percent due to increased domestic production and a decline in domestic demand. U.S. production rose by 15 percent to 2.4 billion barrels, the largest production increase since 1990.
Canada has been the primary U.S. import source of crude petroleum for decades and continued to be so in 2012, accounting for 30 percent of the total value and 28 percent of the total volume of crude petroleum imports. Large multinational energy companies operate in both countries and exchange crude and petroleum products across the border.
Also, an integrated system of shared pipelines crossing the U.S.-Canada border makes it easy to transport crude petroleum from the wellhead to refineries. U.S. imports of crude petroleum from Canada increased by 8 percent to 881 million barrels (or by $5 billion to $69 billion) in 2012.
Imports of crude petroleum from other sources declined in 2012. U.S. imports of crude petroleum from Mexico fell from 402.0 million barrels in 2011 to 355.7 million barrels in 2012. OPEC members together accounted for another 47 percent of the total quantity (39 percent of the value) of crude petroleum imported; U.S. imports from OPEC declined by 5 percent in quantity to 1.5 billion barrels in 2012. Saudi Arabia, Venezuela, Iraq, and Nigeria were the principal OPEC sources of U.S. crude petroleum imports. The decreases in imports of crude are due to increased U.S. production and lower domestic demand.
Petroleum Products
The value of U.S. petroleum product imports slid by 4 percent in 2012, while the quantity fell from 937.4 million barrels in 2011 to 770.4 million barrels in 2012. This decrease was due primarily to a 2.9 percent reduction in demand for gasoline, as average prices at the pump rose from $3.35 per gallon in 2011 to $3.52 per gallon. Additionally, U.S. refineries, which generally satisfy over 90 percent of domestic consumption, increased their capacity utilization rates in 2012, further reducing demand for imports.
U.S. imports of petroleum products from most suppliers decreased in quantity in 2012. Although Canada remained the primary source of U.S. imports of petroleum products, imports from Canada declined by 5 percent to 200 million barrels. Imports from most other sources also decreased in quantity: those from Mexico, by 42 percent (from 38.2 million barrels in 2011 to 21.6 million barrels in 2012); from OPEC, by 32 percent (from 126.5 million barrels in 2011 to 86.8 million barrels in 2012). Among OPEC countries, imports from Venezuela were hit particularly hard, falling by 50 percent. These declines are attributed to a rise in U.S. production, lower U.S. demand for these products, and the massive gas explosion that occurred at the Paraguaná refinery, which resulted in its total closure. Declining imports in residual fuel oils (used primarily as industrial heating and bunker fuels for heating and power), motor fuels, and jet fuels accounted for nearly all of the quantity decrease in U.S. imports of petroleum products.
Natural Gas
The value of U.S. imports of natural gas decreased 19 percent to $28.2 billion in 2012, while the volume of imports fell by 9 percent 3.1 trillion cubic feet. These declines were due to a 10 percent increase in U.S. production, coupled with a 30 percent drop in natural gas prices. About 95 percent of U.S. imports of natural gas are via pipelines; the rest is imported as LNG. Canada remains the primary U.S. supplier, accounting for 99 percent of pipeline natural gas imports, which decreased by 3 percent to 3.0 trillion cubic feet in 2012. Trade between the United States and Canada fluctuates regularly, based on changes in market supply and demand along the pipeline.
The quantity of U.S. imports of LNG also declined in 2012, falling by 50 percent to 175 million cubic feet, largely due to reduced imports of LNG from Trinidad. The country continued to reduce production at some locations because the price of its LNG was more than double the price for gas imported from Canada or domestically produced. Also, Trinidad embarked on an effort to diversify export markets for LNG, entering into long-term contracts with certain Latin American and Caribbean countries.


