Change in 2012 from 2011:
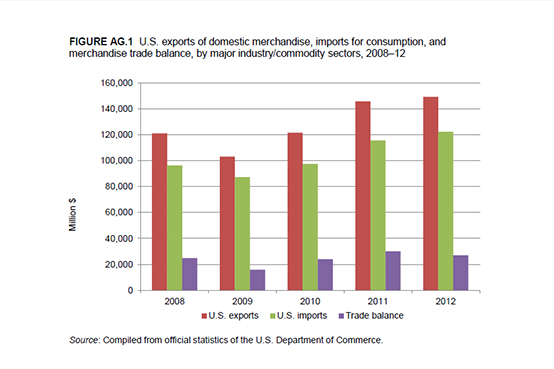
- U.S. trade surplus: Decreased by $3.2 billion (11 percent) to $26.9 billion
- U.S. exports: Increased by $3.6 billion (2 percent) to $149.3 billion
- U.S. imports: Increased by $6.8 billion (6 percent) to $122.4 billion
The U.S. trade surplus in agricultural products fell by $3.2 billion (11 percent) to $26.9 billion in 2012, as a small increase in U.S. agricultural exports was more than offset by a larger increase in U.S. imports (figure AG.1). Global price increases partially drove the growth in the value of exports and imports, particularly for grains and oilseeds in the second half of 2012, as major droughts in North and South America led to short supply. Demand for agricultural products continued to grow in 2012, both as part of a long-term trend toward higher food demand in developing countries and because most countries continued to recover from the global economic downturn that began in 2008. This strong demand also contributed to the relatively high agricultural commodity prices in 2012.
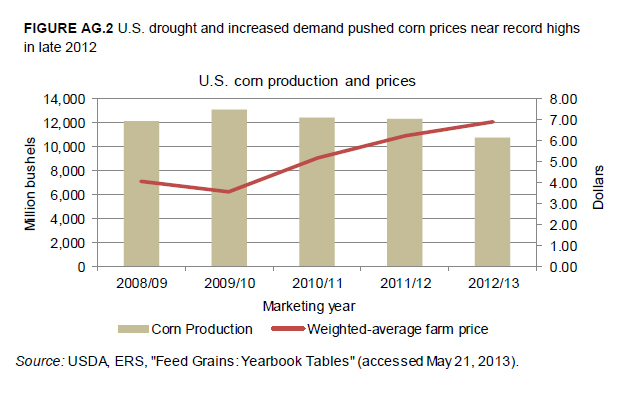
Leading export markets for U.S. agricultural products were China, Canada, Mexico, and Japan. Exports to China grew rapidly (36 percent), while exports to Canada and Mexico showed moderate increases (8 percent and 3 percent, respectively) and exports to Japan declined moderately by 5 percent). U.S. export growth was led by three commodity groups: oilseeds, animal feeds, and edible nuts. This expansion was largely offset by decreases in exports of cereals, cotton, and ethyl alcohol, resulting in a level of overall agricultural exports similar to that of 2011. The decline in U.S. exports of cereals was due to a severe drought that primarily reduced U.S. corn production (figure AG.2). Lower corn production, in turn, was one of several factors contributing to weaker exports of ethyl alcohol.
The products contributing to growth in U.S. imports were primarily guar gum (chiefly used in food and industrial manufacturing as a thickener, binder, and volume enhancer, but also in drilling muds and fracturing fluids), ethyl alcohol, cattle, and cereals. Agricultural product imports were up from all major partner countries except Thailand. The increases from each country were relatively modest (less than 10 percent), except in the case of India. Imports from India rose by 87 percent, due mainly to the large increase in the value of guar gum imports. Import declines were generally minor, with the more significant decreases in U.S. imports of coffee and tea, shellfish, and fats and oils.
U.S. Exports
U.S. export increases in 2012 were led by higher soybean and animal feed exports. Exports of soybeans increased 41 percent by value and 27 percent by volume. The main drivers of strong soybean exports were twofold. First, a drought in South America limited competition from Brazil and Argentina in key export markets, and also raised global prices. Second, there was strong Chinese demand for soybeans, which are used primarily as an input for animal feed in China's large and growing livestock industry. Accordingly, exports of animal feed to China continued their pattern of rapid growth, increasing by 49 percent in 2012.
China was also a source of growing demand for a wide range of other U.S. agricultural products. In 2012, China was the United States' largest export market for agricultural products for the second time in the past three years. U.S. agricultural exports to China grew 36 percent from 2011 to 2012 and 113 percent during 2008-12. Exports of cotton, cereals, poultry, edible nuts, and fats and oils all grew rapidly in 2012. Exports of cereals to China grew despite the overall decline in U.S. cereals exports, because Chinese corn prices hit record highs in early 2012, making U.S. exports more competitive in the Chinese market. As a result, the U.S. shipped greater quantities of corn to China in the spring and summer of 2012 than in the corresponding months of 2011, but quantities fell year-on-year in the autumn, as the U.S. drought began to cut into supplies.
U.S. edible nut exports increased 21 percent, to $6.9 billion, primarily due to higher almond prices and strong demand for U.S. nuts in a number of markets. Almonds, which account for nearly one-half of U.S. nut exports, experienced a record-high crop value in 2012. The increase in production value was driven entirely by higher prices; production volume was down 2 percent compared to 2011. Top markets for U.S. nut exports were Hong Kong, Canada, Germany, Spain, China, India, and Japan. Exports grew to each of these markets except Spain, where exports were virtually unchanged. Notably, exports to China grew by 93 percent and to Hong Kong by 48 percent over 2011.
A severe drought limited U.S. agricultural exports in 2012. The drought was the most extensive since the 1950s, affecting 80 percent of U.S. agricultural land. Concentrated in the Midwest, the drought affected primarily corn and soybean crops. The lower corn harvest was the principal reason for the 28 percent drop in U.S. cereals exports, to $20.3 billion, as the U.S. lost share in export markets to competitors such as Brazil. Wheat, the U.S.'s second-largest cereal crop, was only marginally affected by the drought directly. But the short supply of other grains drove wheat prices sharply higher, as wheat was in demand as a substitute for other grains. Largely as a result of increased domestic demand, the value of wheat exports also declined 27 percent in 2012.
U.S. exports of ethyl alcohol for non-beverage purposes totaled $1.9 billion in 2012, down 41 percent from 2011, but still well above 2008-10 levels. Changes in U.S. nonbeverage ethyl alcohol production and exports are driven by the fuel ethanol market. Drivers of the export decrease included the effects of the drought, which reduced the corn supplies used in much of U.S. ethyl alcohol production, and declining demand for fuel as a result of economic conditions in some countries and increased fuel efficiency. Government policies in key markets also curtailed U.S. exports; in the European Union (EU), a customs ruling and trade remedy cases against U.S. ethanol reduced U.S. exports, while in Brazil, government-controlled gasoline prices and a change in the law that lowered the amount of ethyl alcohol used in fuel ethanol blends weakened demand for U.S. ethanol. As a result, in 2012, exports of non-beverage ethyl alcohol to the EU and Brazil fell by 44 percent and 78 percent, respectively.
U.S. Imports
The largest import shift was in miscellaneous vegetable substances; imports in this sector increased by 115 percent to approximately $5 billion in 2012. This shift was mainly due to an increase of more than 250 percent in the value of U.S. imports of guar gum from India, which is the source of about 80 percent of the world's guar gum. Besides being used in food and industrial manufacturing as a thickener, binder, and volume enhancer, guar gum is also used in drilling muds and fracturing fluids. The recent rise in hydraulic fracturing in the United States has increased demand for guar gum for these purposes. The rise in U.S. imports of guar gum in 2012 was the result of a buildup of stocks by U.S. shale-gas companies that feared a shortage due to an ongoing drought in India's main growing region. This increased demand, plus a speculative bubble, drove the price of guar gum up by 900 percent in 2012.
Other commodity groups showing import increases included cereals, animal feeds, and cattle and beef. The increases in imports for cereals and animal feeds were primarily due to lower domestic supplies as a result of the U.S. drought. The import increases were similar for values and volumes; cereal imports rose 37 percent by value and 39 percent by volume, while animal feed imports rose 29 percent by value and 24 percent by volume. The increase in U.S. imports of cattle was primarily due to the closing of a major packing plant in Canada in May 2012. The closure led to more imports of cattle from Canada to be processed in the United States.
Imports of ethyl alcohol for non-beverage purposes rose by 104 percent to $1.8 billion. The main reason for this increase was higher demand for and supply of sugarcane ethanol. Sugarcane ethanol, unlike corn ethanol, meets mandates for advanced biofuels under the Renewable Fuel Standard and the California Low Carbon Fuel Standard.14 In addition, Brazilian production of sugarcane ethanol in 2012 was high and domestic demand low, increasing the supply available for export to the United States.


