This report traditionally includes extensive U.S. trade data on a sector and country basis, as well as analysis of the major shifts in the previous year's U.S. trade. However, this year the USITC is publishing only the trade data, and is reviewing the report's content and analytical aspects to improve its utility for users (and potential users).
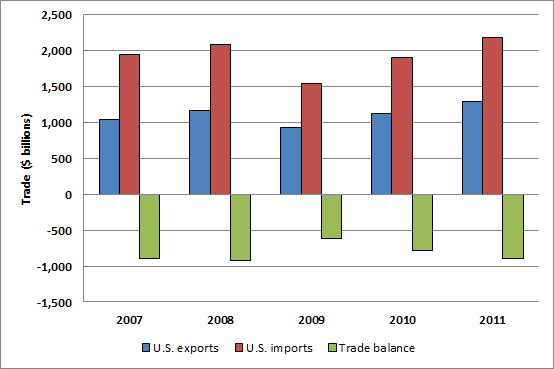
Exports, Imports and Trade Balance
Trade Shifts from 2010 to 2011
- U.S. trade deficit : Increased by $111.3 billion (14 percent) to $887.8 billion
- U.S. exports: Increased by $177.0 billion (16 percent) to $1,299.2 billion
- U.S. imports: Increased by $288.3 billion (15 percent) to $2,187.0 billion
Trade data tables: Overall Shifts
Sector Shifts
This part of the report examines shifts in trade for ten merchandise sectors: agriculture; chemicals and related products; electronic products; energy-related products; forest products; machinery; minerals and metals; miscellaneous manfactures; textiles, apparel, and footwear; and transportation equipment. The following links download as PDF files.
Agricultural Products :: Chemicals and Related Products :: Electronic Products :: Energy and Related Products :: Forest Products :: Machinery :: Minerals and Metals :: Miscellaneous Manufactures :: Textiles, Apparel, and Footwear :: Transportation Equipment
Country Shifts
This part of the report analyzes shifts in trade between the United States and fourteen significant trading partners. The following links download as PDF files.
Brazil :: Canada :: China :: European Union :: India :: Japan :: Mexico :: Republic of Korea :: Russia :: Saudia Arabia :: Singapore :: Switzerland :: Taiwan :: Venezuela
|
General Contact Robert Carr |
Media Contact Peg O'Laughlin |

