View Section in Publication :: Return to Overview

Key Economic Trends
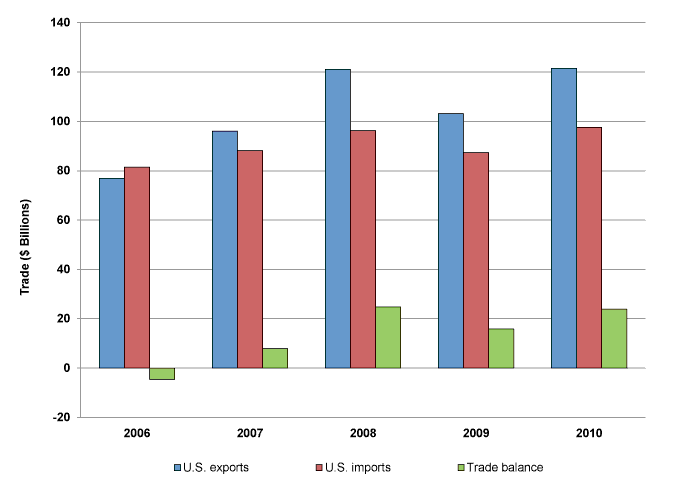
- The U.S. trade surplus in agricultural products, which increased by $8.0 billion (51 percent) to $23.9 billion in 2010, was principally driven by higher commodity prices for many products, as the global economic recovery took hold.
- The $18.3 billion (18 percent) growth in U.S. exports was fueled by increased exports of cereal, cotton, and oilseeds (primarily soybeans) in 2010. The largest absolute shift in U.S. agricultural exports in 2010 was the $2.7 billion (16 percent) rise in U.S. exports of cereals (food and feed grain), which were mainly driven by a rise in export volume.
- U.S. imports rose by $10.3 billion (12 percent) due to a mix of higher volumes for some imported commodities—such as tomatoes and fresh peppers—and higher prices for other commodities, such as coffee and cocoa. Vegetables registered the largest absolute increase in U.S. imports during 2010, increasing by $1.0 billion (22 percent).
Trade Shifts from 2009 to 2010
- U.S. trade surplus: Increased by $8.0 billion (51 percent) to $23.9 billion
- U.S. exports: Increased by $18.3 billion (18 percent) to $121.5 billion
- U.S. imports: Increased by $10.3 billion (12 percent) to $97.6 billion
Selected Product Shifts
USITC Publications
- China: Effects of Intellectual Property Infringement and Indigenous Innovation Policies on the U.S. Economy. Inv. No. 332-519, USITC Publication 4226, May 2011.
- China's Agricultural Trade: Competitive Conditions and Effects on U.S. Exports, USITC Publication 4219, March 2011.
- Mushrooms: Industry and Trade Summary, USITC Publication ITS-07, June 2010.
- Apples: Industry and Trade Summary, USITC Publication ITS-04, February 2010.
- India: Effects of Tariffs and Nontariff Measures on U.S. Agricultural Exports, Inv. No. 332-504, USITC Publication 4107, November 2009.
- Global Beef Trade: Effects of Animal Health, Sanitary, Food Safety, and Other Measures on U.S. Beef Exports, USITC Publication 4033, September 2008.
- Certain Vegetables and Grape Juice: Probable Economic Effect of Accelerated Tariff Elimination for Certain Goods of Chile, USITC Publication 4017, June 2008.
- Sub-Saharan Africa: Factors Affecting Trade Patterns of Selected Industries, Second Annual Report Publication No. 3989, April 2008.
Other Government Resources
