About this Report
Publication No. 4089
Investigation No. 332-345
Date: July 2009
View Section in Publication
Click here to order CD-ROM
This site provides analysis, data, and information resources showing competitive aspects of U.S. merchandise trade trends on a country and sector basis.
Exports, Imports and Trade Balance

Key Economic Events
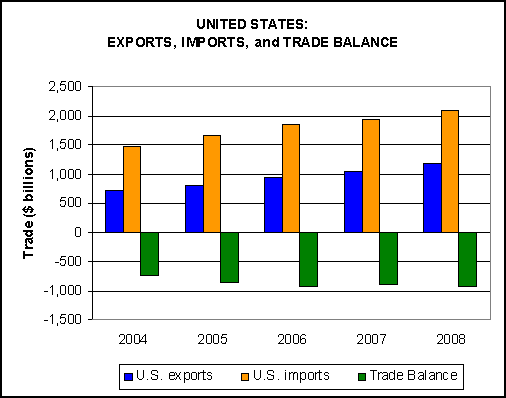
- Growth in U.S. merchandise exports and imports was affected by the depreciation of the U.S. dollar against such currencies as the Japanese yen and the euro and by slower economic growth in the United States and major trading partners. U.S. exports and imports fell in fourth quarter 2008, reflecting an acceleration of the economic downturn in the latter part of the year.
- In 2008, the merchandise trade deficit increased by $24.2 billion (3 percent) to $920.7 billion. The trade deficit was affected substantially by the higher price of crude petroleum, which resulted in an increase in the value of U.S. imports of energy-related products. Imports of energy-related products grew in value by 37 percent and accounted for 42 percent of the total deficit after reaching a record high. In contrast, U.S. imports of non-energy-related merchandise grew by only 1 percent.
- Despite a drop in fourth quarter 2008, total U.S. merchandise exports reached a new annual high in 2008, with increases in all major sectors. Energy-related products registered the greatest absolute increase, with most of the growth occurring in petroleum products. Exports of agricultural products, chemicals and related products, and minerals and metals also grew significantly.
- Deficits with the EU, Canada, China, Mexico, and Japan accounted for 71 percent of the total U.S. trade deficit in 2008. The deficit with China, which alone accounted for nearly 30 percent of the total trade deficit, increased, as did the deficit with Canada. The U.S. deficits with the EU, Mexico, and Japan declined.
- U.S. imports from trade preference program beneficiary countries rose by $46.5 billion (73 percent) to $110.0 billion during the 2004–08 period. Almost 30 percent of all merchandise from these countries over this 5-year period entered the United States free of duty under the African Growth and Opportunity Act, the Andean Trade Preference Act, the Caribbean Basin Initiative, and the Generalized System of Preferences trade preference programs during this five-year period. Although most beneficiaries individually are small-scale trade partners of the United States, together they accounted for 19 percent of total U.S. imports from the world in 2008.
Trade Shifts in 2008 from 2007
- U.S. trade deficit: Increased by $24.2 billion (3 percent) to $920.7 billion
- U.S. exports: Increased by $123.5 billion (12 percent) to $1.2 trillion
- U.S. imports: Increased by $147.6 billion (8 percent) to $2.1 trillion
Sector Shifts
This part of the report examines shifts in trade for ten merchandise sectors: agriculture; chemicals and related products; electronic products; energy-related products; forest products; machinery; minerals and metals; miscellaneous manfactures; textiles, apparel, and footwear; and transportation equipment. The following links download as PDF files.
Agricultural Products :: Chemicals and Related Products :: Electronic Products :: Energy and Related Products :: Forest Products :: Machinery :: Minerals and Metals :: Miscellaneous Manufactures :: Textiles, Apparel, and Footwear :: Transportation Equipment
Country Shifts
This part of the report analyzes shifts in trade between the United States and eight significant trading partners. The following links download as PDF files.
Brazil :: Canada :: China :: European Union :: India :: Japan :: Mexico :: Russia
|
General Contact Jeremy Wise Brendan Lynch |
Media Contact Peg O'Laughlin |
