Operation of the Trade Agreements Program
70th Report
October 2019
Publication Number: 4986
United States International Trade Commission
Commissioners
David S. Johanson, Chairman
Rhonda K. Schmidtlein
Jason E. Kearns
Randolph J. Stayin
Amy A. Karpel
Catherine DeFilippo
Director, Office of Operations
William Powers
Director, Office of Economics
Address all communications to
Secretary to the Commission
United States International Trade Commission
Washington, DC 20436
This report was prepared principally by:
Co-Project Leaders
Caroline Peters, Office of Economics, and Arona Butcher, Office of Economics
Office of Economics
Erika Bethmann, Justino De La Cruz, Meryem Demirkaya,
Stephanie Fortune-Taylor, Joanne Guth, Alexander Hammer, Justin Holbein,
Ermengarde Jabir, Lin Jones, Grace Kenneally, Nick Luettke, Meagan Martin,
Christopher Montgomery, Trevor Litwin, Gregory Taylor, Edward Wilson, and Wen
Jin Yuan
Office of the General Counsel
William W. Gearhart
Office of Industries
Natalie Hanson, Junie Joseph, and Heather Wickramarachi
Office of Investigations
Salvatore Mineo
Office of Tariff Affairs and Trade Agreements
Donnette Rimmer
Office of Unfair Import Investigations
David Lloyd
Office of Analysis and Research Services
Maureen Letostak, David Lundy, and Laura Thayn
Editorial Review
Judy Edelhoff and Peg Hausman
Statistical Review
Russell Duncan
Content Reviewer
Laura Rodriguez
Administrative Support
Hau Nguyen
Office of the Chief Information Officer,
Help Desk and Customer Service Division
Under the direction of
Arona Butcher, Chief
Country and Regional Analysis Division
Office of Economics
This report is the 70th in a series of annual reports
submitted to the U.S. Congress under section 163(c) of the Trade Act of 1974
(19 U.S.C. 2213(c)) and its predecessor legislation. Section 163(c) states that
“the International Trade Commission shall submit to the Congress at least once
a year, a factual report on the operation of the trade agreements program.”
This report is one of the principal means by which the U.S.
International Trade Commission provides Congress with factual information on
trade policy and its administration for 2018. The trade agreements program
includes “all activities consisting of, or related to, the administration of
international agreements which primarily concern trade and which are concluded
pursuant to the authority vested in the President by the Constitution” and by
congressional legislation.
This report on the operations of the trade agreements
program is prepared by the U.S. International Trade Commission (Commission or
USITC) as required by section 163(c) of the Trade Act of 1974. The 70th in a
series, this report covers trade-related actions in the calendar year 2018.
The level of U.S. imports and U.S. exports of goods and
services depends on many factors, including the strength of the U.S. and global
economies. Growth in these economies contributes to growth in cross-border
trade. The rate of global economic growth fell slightly from 3.8 percent in
2017 to 3.6 percent in 2018, reflecting slower growth in advanced as well as
emerging and developing economies. The economies of advanced countries grew 2.2
percent in 2018 compared with 2.4 percent in 2017. The growth rate of
emerging-market and developing economies also dropped—from 4.8 percent in 2017
to 4.5 percent in 2018—and was primarily due to a slight dip in the growth
rates of the Chinese and Indian economies over this period. All of the United
States’ eight major trading partners showed slower growth rates in 2018 than in
2017.
[1]
Economic growth in the United States, however, accelerated in 2018: U.S. real
gross domestic product (GDP) increased 2.9 percent in 2018, compared to an
increase of 2.2 percent in 2017.
In 2018, the U.S. dollar appreciated 5.5 percent against a
broad trade-weighted index of major foreign currencies, as well as against most
of the currencies of its main trading partners. Between January 1 and December
31, 2018, the U.S. dollar appreciated by 9.6 percent against the Indian rupee;
9.1 percent against the Canadian dollar; 6.5 percent against the British pound
sterling; 5.9 percent against the Chinese yuan; 5.2 percent against the euro;
and 0.8 percent against the Mexican peso. Over the same period, the U.S. dollar
depreciated by 2.2 percent against the Japanese yen.
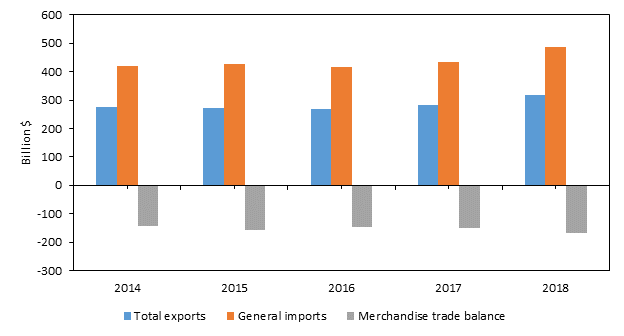
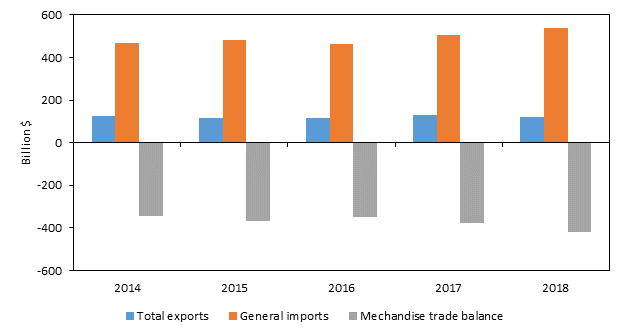
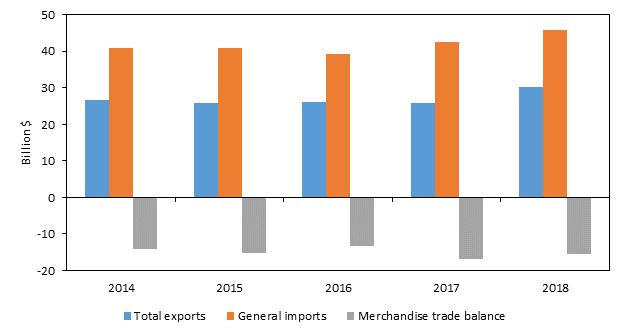
Both U.S. exports and U.S. imports of goods increased in
value in 2018. The value of U.S. merchandise exports totaled $1,664.1 billion
in 2018, up 7.6 percent ($117.8 billion) from $1,546.3 billion in 2017. The
value of U.S. merchandise imports totaled $2,541.3 billion in 2018, up 8.6
percent ($200.5 billion) from $2,340.8 billion in 2017. The largest increase in
U.S. exports was in energy-related products, whereas the largest increase in
U.S. imports was in chemicals and related products. None of the U.S. economy’s
broad merchandise sectors experienced a trade surplus in 2018.
[2]
Overall, U.S.
imports increased more than U.S. exports, resulting in an $82.7 billion
increase in the U.S. merchandise trade deficit that brought it to $877.2
billion in 2018 (figure ES.1). This year, the merchandise data used in this
report is available through a supplemental trade dataset accompanying the
report at publication.
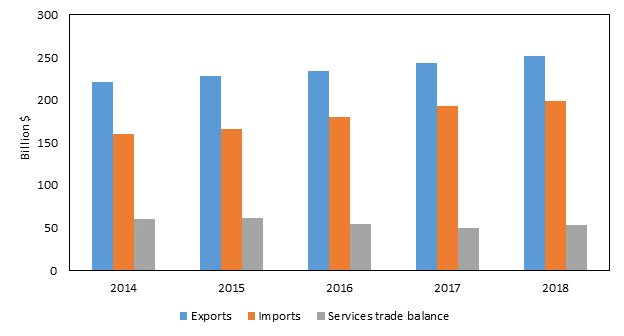
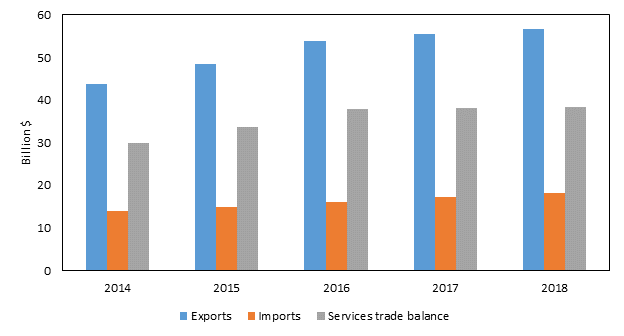
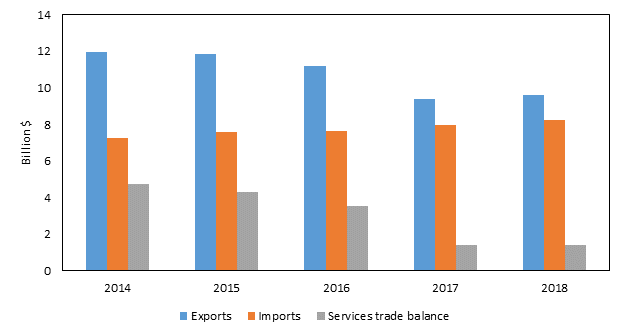
U.S. two-way cross-border trade in private services, which
excludes exports and imports of government goods and services not included
elsewhere (n.i.e.), increased 3.8 percent between 2017 and 2018. U.S. exports
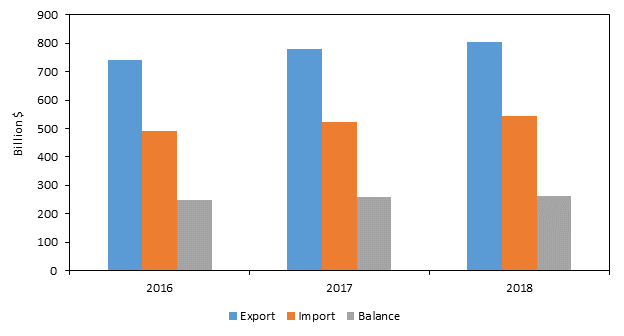
of private services grew 3.4 percent to $805.7 billion in 2018, while U.S.
imports of private services grew 4.3 percent to reach $544.3 billion in 2018.
As a result, the U.S. surplus in private services increased 1.5 percent to
$261.4 billion.
Figure ES.1
U.S. trade balance in goods and services, 2004–18
Safeguard actions:
The Commission conducted
no new safeguard investigations during 2018 under sections 201–204 of the Trade
Act of 1974 or under any of the provisions that implement safeguard provisions
in free trade agreements (FTAs) involving the United States.
Two global safeguard measures were in effect during most of
2018. In early 2018, the President imposed new safeguard measures on imports of
certain crystalline silicon photovoltaic cells and on imports of large
residential washers.
Section 301:
There were two ongoing
investigations in 2018 under section 301 of the Trade Act of 1974. The first
investigation was instituted in 1987 and concerned various European Union (EU)
meat hormone directives, which prohibit the use of certain hormones that
promote growth in farm animals. Following a successful challenge at the WTO,
the United States imposed additional duties on certain imports from the EU in
1999. In 2012, the United States and the EU signed a provisional settlement,
and the United States lifted the additional duties. In December 2016,
representatives of the U.S. beef industry filed a request with the Office of
the U.S. Trade Representative (USTR) asking that the additional duties be
reinstated, and USTR initiated a process to consider whether to reinstate the
additional duties. In 2018, the EU Commission received a mandate from the EU
Council to begin formal negotiations with the United States.
The second investigation was self-initiated by USTR in
August 2017. In April 2018, USTR determined that the acts, policies, and
practices of the Government of China related to technology transfer,
intellectual property, and innovation covered in the investigation are
unreasonable or discriminatory and burden or restrict U.S. commerce. In
response, the United States imposed in two installments (tranches) an
additional 25 percent ad valorem tariff on certain Chinese goods with an
approximate annual trade value of $50 billion in July and August 2018, and
initiated a World Trade Organization (WTO) dispute settlement case against
China. In September 2018, the United States imposed an additional 10 percent ad
valorem tariff on a third tranche of Chinese goods with an approximate trade
value of $200 billion.
Special 301:
In the
2018 Special 301
Report
, USTR examined the adequacy and effectiveness of intellectual
property rights protection in more than 100 countries. The report listed 12
countries on the priority watch list (Algeria, Argentina, Canada, Chile, China,
Colombia, India, Indonesia, Kuwait, Russia, Ukraine, and Venezuela) and 24
countries on the watch list. The
2018 Out-of-Cycle Review of Notorious
Markets report
highlighted
33 internet-based markets and 25 physical marketplaces in 19 countries that
reportedly engage in or facilitate substantial copyright piracy and trademark
counterfeiting.
Antidumping duty investigations:
The
Commission instituted 31 new antidumping investigations and made 34 preliminary
determinations and 52 final determinations during 2018. Antidumping duty orders
were issued by the U.S. Department of Commerce (USDOC) in 41 of the final
investigations on 16 products from 22 countries.
Countervailing duty investigations:
The
Commission instituted 22 new countervailing duty investigations, and made 25
preliminary determinations and 21 final determinations during 2018.
Countervailing duty orders were issued by USDOC in 18 of the final
investigations on 13 products from 8 countries.
Sunset reviews:
During 2018, the Commission
instituted 34 sunset reviews of existing antidumping duty and countervailing
duty orders and suspension agreements, as required by law, either five years
after their initial publication or five years after publication of a subsequent
determination to continue them. The Commission completed 55 reviews, resulting
in the continuation of 50 antidumping duty and countervailing duty orders for
up to five additional years, as well as the termination of 2 orders and the
revocation of 3 orders.
Section 129 investigations:
Section 129 of the U.S. Uruguay Round Agreements Act
established a procedure by which the Administration may respond to adverse WTO
panel or Appellate Body reports in trade remedy cases.
On March
29, 2018, India requested the establishment of a WTO compliance panel to review
the consistency of the United States’ section 129 determinations with its WTO
obligations in connection with the recommendations and rulings of the WTO
Dispute Settlement Body (DSB) in
United States—Countervailing Measures on
Certain Hot-Rolled Carbon Steel Flat Products from India
(DS436). The
panel is expected to complete its work and issue its report in 2019.
On June 4, 2018, USDOC completed a section 129 proceeding,
carried out in connection with the recommendations and rulings of the WTO DSB
in
United States—Anti-Dumping and Countervailing Measures on Large
Residential Washers from Korea
(DS464), and revised certain aspects of its
original determination.
Section 337 investigations:
During calendar
year 2018, there were 130 active section 337 investigations and ancillary
proceedings alleging unfair import practices, such as patent infringement.
Sixty-four of these proceedings were instituted in 2018. Of the 64 new
proceedings, 50 were new section 337 investigations and 14 were new ancillary
(secondary) proceedings relating to previously concluded investigations. The
Commission completed a total of 61 investigations and ancillary proceedings
under section 337 in 2018, and issued 3 general exclusion orders, 12 limited
exclusion orders, and 34 cease and desist orders.
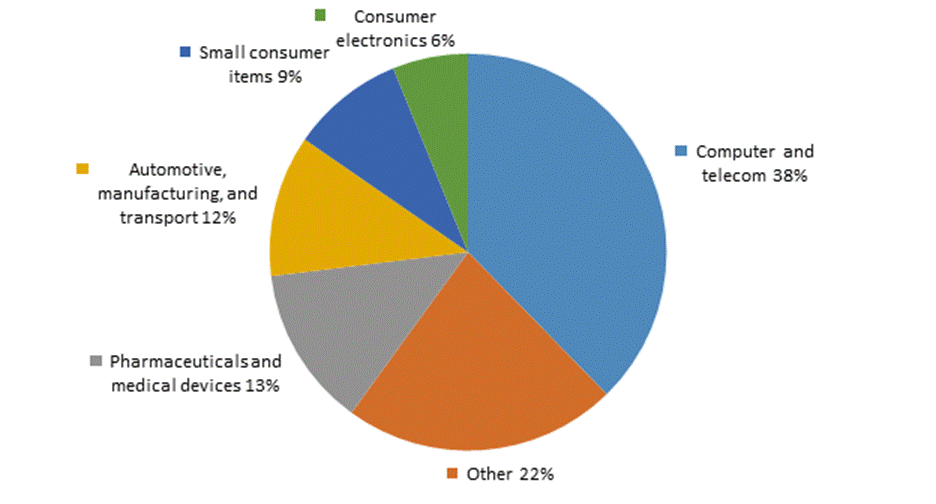
Section 337 proceedings active in 2018 involved a wide
variety of products. As in prior years, technology products were the single
largest category, with approximately 38 percent of the active proceedings
involving computer and telecommunications equipment and another 6 percent
involving consumer electronics. The second-largest category was pharmaceuticals
and medical devices, which were at issue in about 13 percent of the active
proceedings. Automotive, manufacturing, and transportation products were at
issue in about 12 percent of the active proceedings, and small consumer
products were at issue in about 9 percent of the proceedings.
Section 232 national security investigations:
On March 8, 2018, the United States announced an additional 25 percent ad
valorem additional tariff on imports of certain steel products and a 10 percent
ad valorem tariff on certain aluminum products, effective March 23, 2018 (see
table ES.1 for a summary of related actions by major U.S. trading partners in
response). These duties were applied following investigations into the national
security implications of U.S. steel and aluminum imports under section 232 of
the Trade Expansion Act of 1962. Certain countries were exempted from these
tariffs, on a permanent or temporary basis. The Secretary of Commerce initiated
two additional investigations under section 232 in 2018: one on imports of
automobiles, including cars, SUVs, vans and light trucks, and automobile parts
(initiated on May 23, 2018) and a second on imports of uranium (initiated on
July 18, 2018).
Table ES.1
Section 232 steel and
aluminum tariffs and retaliatory actions, 2018 developments for major trading
partners
Country
Subject to 25% tariff
on steel exports and 10% tariff on aluminum exports to the United States at
yearend 2018?
Date 232 tariffs applied to trading partner
Retaliation by trading partner in 2018?
WTO action in 2018?
EU
Yes
June 1, 2018
Yes. Retaliated with
maximum 25% tariffs on a first stage of products effective June 22, 2018.
Yes (DS548). Consultations
requested by EU on June 1, 2018.
China
Yes
March 23, 2018
Yes. Retaliated with
15–25% tariffs on a range of products effective April 2, 2018.
Yes (DS544). Consultations
requested by China on April 5, 2018.
Canada
a
Yes
June 1, 2018
Yes. Retaliated with
tariffs on steel, aluminum and other products effective July 1, 2018.
Yes (DS550). Consultations
requested by Canada on June 1, 2018.
Mexico
a
Yes
June 1, 2018
Yes. Retaliated with
suspension of North American Free Trade Agreement (NAFTA) preferential duty
rates, imposing tariffs of up to 25% on steel, aluminum, and agricultural
products effective June 5, 2018.
Yes (DS551). Consultations
requested by Mexico on June 5, 2018.
Japan
Yes
March 23, 2018
No
Yes. Japan notified the
WTO of its intent to impose retaliatory tariffs on May 18, 2018, but took no
further action in 2018.
South Korea
Subject to quota on steel exports
and 10% tariff on aluminum exports to the United States
May 1, 2018 (for both
steel quota and aluminum tariff)
No
No
India
Yes
March 23, 2018
No
Yes (DS547). Consultations
requested by India on May 18, 2018.
a
Canada and Mexico
terminated their retaliatory actions and the WTO disputes were terminated in
2019 after the United States reached mutually agreed solutions in May 2019 with
Canada and Mexico.
Trade Adjustment Assistance (TAA):
In
fiscal year (FY) 2018, the U.S. Department of Labor (USDOL) received 1,178
petitions for TAA, up 13.6 percent from the 1,037 petitions received in FY 2017.
The USDOL certified 895 petitions covering 76,902 workers as eligible for TAA
and denied 217 petitions covering 17,374 workers. In FY 2018, USDOC certified
82 petitions as eligible for assistance under the TAA for Firms program, and
approved 98 adjustment proposals.
Generalized System of Preferences (GSP):
U.S. imports under GSP increased 10.7 percent, reaching $23.6 billion in 2018.
These imports accounted for 9.9 percent of total U.S. imports from GSP
beneficiary countries and 0.9 percent of U.S. imports from all countries. The
top five beneficiary countries (India, Thailand, Brazil, Indonesia, and Turkey)
accounted for 73.2 percent of GSP imports.
Five country practice reviews were initiated in 2018 on
India, Indonesia, Kazakhstan, Thailand, and Turkey. Effective January 1, 2018,
Argentina’s GSP eligibility was reinstated after a nearly six-year suspension.
Ukraine’s GSP eligibility was partially removed effective April 26, 2018, due
to failure to adequately protect intellectual property rights.
Nepal Trade Preferences Act (NTPA):
The
NTPA was implemented in December 2016 to improve Nepal’s export competitiveness
and help Nepal’s economic recovery following a 2015 earthquake. In 2018, the
second full year that the NTPA was in effect, U.S. imports from Nepal under
NTPA were $3.1 million (an increase of 30.9 percent from the previous year),
accounting for 3.1 percent of all U.S. imports from Nepal.
African Growth and Opportunity Act (AGOA):
In 2018, 40 sub-Saharan African countries were eligible for AGOA benefits. Of
these countries, 28 were also eligible for AGOA textile and apparel benefits
for all or part of 2018. Apparel benefits for Eswatini (formerly known as
Swaziland) were reinstated on July 3, 2018. Rwanda’s apparel benefits were
terminated on July 31, 2018, as a result of an out-of-cycle review initiated by
USTR on June 20, 2017, for Rwanda, Tanzania, and Uganda. The President
determined that Tanzania and Uganda were in compliance with AGOA’s eligibility
requirements on March 29, 2018.
In 2018, imports entering the United States exclusively
under AGOA (excluding GSP) were valued at $10.8 billion, an 11.9 percent
decrease from 2017. These imports entering the United States under AGOA comprised
43.9 percent of all imports from AGOA beneficiary countries in 2018. The
decline in U.S. imports under AGOA in 2018 can be attributed to a decline in
the value and quantity of imports of crude petroleum and passenger motor
vehicles. An additional $1.2 billion from AGOA beneficiary countries entered
the United States duty-free under GSP. In total, AGOA and GSP preference
programs accounted for 48.8 percent of all imports from AGOA beneficiary
countries in 2018.
Caribbean Basin Economic Recovery Act (CBERA):
At yearend 2018, 17 countries and dependent territories were eligible for CBERA
preferences, and 8 of those countries were designated eligible for Caribbean
Basin Trade Partnership Act (CBTPA) preferences. In 2018, the value of U.S.
imports under CBERA (including CBTPA) increased by 9.1 percent to $1.7 billion,
mainly reflecting an increase in U.S. imports of apparel from Haiti and
methanol from Trinidad and Tobago, which are both major imports under CBERA.
U.S. imports under CBERA of crude petroleum continued to decline as U.S.
production increased. Haiti was the leading supplier of U.S. imports under
CBERA in 2018, followed by Trinidad and Tobago. Imports from CBERA programs
accounted for 27.8 percent of all imports from CBERA beneficiary countries in
2018.
Haiti initiatives:
Over the years, several amendments to CBERA have
expanded trade benefits to Haiti, benefiting Haiti’s apparel industry. Nearly
all (97.0 percent) of U.S. imports of apparel from Haiti entered duty free
under CBERA. U.S. imports from Haiti under CBERA are brought in under CBTPA, the
Haitian Hemisphere Opportunity through Partnership
Encouragement Act of 2006 and 2008 (HOPE Acts), and the Haiti Economic Lift
Program of 2010 (HELP Act) in 2018, with a growing portion entering under the
HOPE/HELP Acts.
The value of U.S. imports of apparel entering
under the HOPE/HELP Acts rose 11.9 percent to $645.5 million in 2018, and
represented nearly 70 percent of all U.S. apparel imports from Haiti.
WTO developments:
The WTO Director-General
reported toward the end of the year that little progress had been made in trade
negotiations since the Eleventh WTO Ministerial Conference in December 2017.
However, negotiations towards a plurilateral agreement on fisheries subsidies
advanced, as did exploratory work aimed at future WTO negotiations on the
trade-related aspects of e-commerce, according to the Director-General. WTO
members also discussed the functioning of the multilateral trading system and
the need for WTO reform and modernization efforts. WTO membership remained at
164 in 2018.
WTO dispute settlement:
During 2018, WTO
members filed 39 requests for WTO dispute settlement consultations in new
disputes, more than double the 17 filed in 2017. The United States was the
complainant in 8 of the 39 requests filed during 2018 and the named respondent
in 19. Nearly half of the complaints (9) filed against the United States
concerned U.S. national security tariffs on steel and aluminum products, and 6
of the 8 complaints filed by the United States concerned measures taken by
other WTO members in response to the U.S. steel and aluminum tariffs. The
remaining two new requests filed by the United States during 2018 concerned
export subsidy measures taken by India and Chinese measures concerning the
protection of intellectual property rights. The remaining 10 requests in which
the United States was the respondent involved duties on softwood lumber, fish
fillets, and other products, as well as safeguard measures on crystalline
silicon photovoltaic cells and large residential washers, and sanitary and
phytosanitary measures on seafood products, alleged subsidies in the U.S.
energy sector, and certain tariff and nontariff measures placed on imports of
goods and services.
Twenty-three dispute settlement panels were established in
2018 in which the United States was either the complainant or the respondent.
The United States was the complaining party in 8 of the disputes, and the
responding party in 15 disputes. All but 3 of the disputes were filed in 2018.
Nine of the panels were established to review U.S. measures on steel and
aluminum products, and 5 were established to review measures taken by other WTO
members in response to the U.S. tariffs on steel and aluminum. Two panel reports
were issued in 2018 involving the United States—both times as a respondent in
disputes about U.S. countervailing duty measures, one brought by Canada and the
other by Turkey.
Organisation for Economic Co-operation and
Development (OECD):
The OECD ministerial council meeting was held in
Paris, France, on May 30–31, 2018. Discussions focused on how to harness
international cooperation and improve economic policies to address global
challenges. During the year, the OECD Trade Committee focused its work on broad
areas involving trade in services, digital trade, trade in raw materials, and
trade and investment.
There were 37 OECD members following the
accession of Lithuania and Colombia on May 30, 2018.
The Global Forum on Steel Excess Capacity, which is chaired
by the OECD, held its second ministerial meeting in Paris, France, on September
20, 2018. At the meeting, members approved a report that included initial
conclusions on a process to identify and remove subsidies and other state support
to both public and private steel producers that can contribute to excess
capacity in the steel sector.
Asia-Pacific Economic Cooperation (APEC)
:
Under Papua New Guinea’s leadership in 2018, cooperation among APEC member
economies highlighted the theme of “Harnessing Inclusive Opportunities,
Embracing the Digital Future.” APEC accomplishments in 2018 include the
completion of
APEC’S Bogor Goals Progress Report
, progress made in
constructing the APEC trade in value added (TiVA) database, and various
activities conducted to facilitate digital trade and e-commerce in the APEC
region.
Trade and Investment Framework Agreements (TIFAs)
:
TIFAs provide a framework to expand trade and investment and a forum to resolve
trade and investment issues between the United States and various trading
partners. By yearend 2018, the United States had entered into 57 TIFAs, with no
new TIFAs in 2018. Though the U.S.-Paraguay TIFA was signed in 2017, it has not
yet entered into force. A number of TIFA Council meetings took place in 2018,
including those with Algeria, Argentina, Armenia, Bangladesh, Central Asia,
Indonesia, Laos, Nepal, New Zealand, Thailand, and Ukraine.
U.S. free trade agreements (FTAs) in force in 2018:
The United States was party to 14 FTAs involving a total of 20 countries as of
December 31, 2018. Starting with the most recent agreement, the FTAs in force
during 2018 were with Panama (which entered into force in 2012); Colombia
(2012); South Korea (2012); Oman (2009); Peru (2009); several countries of
Central America and the Dominican Republic (CAFTA-DR), which includes the
Dominican Republic, El Salvador, Guatemala, Honduras, and Nicaragua (2006–07)
and Costa Rica (2009); Bahrain (2006); Morocco (2006); Australia (2005); Chile
(2004); Singapore (2004); Jordan (2001); Canada and Mexico (1994); and Israel
(1985).
FTA merchandise trade flows with FTA partners:
In 2018, total two-way (exports and imports) merchandise trade between the
United States and its 20 FTA partners was $1.6 trillion, which accounted for
39.1 percent of total U.S. merchandise trade with the world. U.S. trade with
its partner countries under the North American Free Trade Agreement
(NAFTA)—Canada and Mexico—continued to contribute the most to all U.S. trade
with FTA partners, accounting for $1.2 trillion, or 74.8 percent of such trade.
From 2017 to 2018, U.S. exports to the NAFTA countries rose 7.3 percent to $563.7
billion while U.S. imports from the NAFTA countries increased 8.4 percent to
$664.9 billion. As a result, the U.S. merchandise trade deficit with its NAFTA
partners increased by 15.1 percent to $101.2 billion in 2018.
U.S. trade with its non-NAFTA FTA partners was valued at
$414.2 billion in 2018, a 9.6 percent increase from 2017. U.S. exports to these
FTA partners increased 11.2 percent to $216.5 billion in 2018, while U.S.
imports from these partners increased 8.0 percent to $197.7 billion. As result,
the U.S. merchandise trade surplus with these countries increased 62.1 percent
to $18.8 billion in 2018.
The value of imports that entered into the United States
under FTAs and are subject to FTA duty reductions and eliminations totaled
$408.0 billion in 2018, up 5.8 percent from 2017. Imports subject to FTA duty
reductions and eliminations accounted for nearly half (47.3 percent) of total
imports from FTA partners in 2018 and 16.1 percent of total U.S. imports from
the world. (The majority of U.S. imports from FTA partners that do not enter
under an FTA generally enter free of duty under normal trade relations rates,
although some also face duties.) Imports under the FTA with Singapore, which
grew $2.7 billion or 147.1 percent, represented the largest percentage increase
in 2018, while imports from Mexico accounted for the greatest absolute change
in value, rising by $17.4 billion (9.5 percent). Imports under FTAs from Panama
and Oman also increased significantly, rising by 41.5 percent ($24 million) and
28.8 percent ($202 million), respectively.
FTA negotiations:
On October 16, 2018, USTR
Lighthizer notified Congress of the President’s intent to negotiate trade
agreements with the United Kingdom (UK), the EU, and Japan. However, the UK
cannot launch formal negotiations for a new trade agreement before it exits the
EU.
On November 30, 2018, the United States, Mexico, and Canada
signed the United States-Mexico-Canada Agreement (USMCA), which the USTR stated
is intended to modernize and rebalance the North American Free Trade Agreement.
Notable differences between USMCA and NAFTA include revised rules of origin for
automobiles, updated rules regarding sanitary and phytosanitary measures and
technical barriers to trade, better market access for agricultural products,
new protections for intellectual property, and limitations on investor-state
dispute settlement. The agreement also includes new chapters on digital trade,
anticorruption, competitiveness, good regulatory practices, small and
medium-sized enterprises, macroeconomic policies and exchange rates, labor, and
the environment.
Developments with FTAs already in force:
U.S. officials met with a number of partners representing member states of the
14 U.S. FTAs in force during 2018. Discussions with U.S. partners focused on a
range of trade-related issues, as well as the labor and environmental
provisions included in most of these agreements. The United States and South
Korea signed a number of modifications and amendments to the U.S.-Korea FTA
(KORUS) on September 24, 2018. In November 2018, the United States and Israel
held the first round of negotiations on a permanent agreement to succeed the
2004 U.S.-Israel Agreement on Trade in Agricultural Products.
NAFTA developments:
The pre-existing NAFTA
remains in effect pending final actions approving the USMCA by each of the
three countries. Per article 2205 of the agreement, any of the countries may
also withdraw from NAFTA six months after issuing written notice to the other
parties.
NAFTA parties undertook commitments concerning enforcement
of environmental laws and other environment-related matters in a companion
agreement to NAFTA called the North American Agreement on Environmental
Cooperation. At the end of 2018, five cases regarding enforcement of environmental
laws subject to the review of NAFTA’s Commission for Environmental Cooperation
remained active under Articles 14 and 15. Two involved Canada: one was
submitted in 2017, and the other in 2018; and three involved Mexico, all
submitted in 2018. There were three submissions under review at the North
American Agreement on Labor Cooperation at the end of 2018: two involved Mexico,
and one involved the United States.
NAFTA dispute settlement:
In 2018, 1 active
Chapter 11 (investor-state dispute settlement) case was filed against the
United States by Canadian investors; 6 cases were filed by U.S. investors
against Canada; and 2 were filed against Mexico by U.S. investors. At the end
of 2018, the NAFTA Secretariat listed 5 binational panels active under Chapter
19 (Review and Dispute Settlement in Anti-dumping and Countervailing Duty
Matters); these are reviews of final determinations made by national
authorities in antidumping and countervailing duty cases. One of the reviews
concerns a case filed by the United States contesting Mexico’s determinations;
three concern cases filed by Canada contesting U.S. determinations; and one
concerns a case filed by Mexico contesting U.S. determinations.
This report includes a review of U.S. bilateral trade
relations with its largest trading partners each year. This year, the report
covers the following eight trading partners: the EU, China, Canada, Mexico,
Japan, South Korea, India, and Taiwan (ordered by the value of their two-way
merchandise trade). Two-way merchandise and private services trade for each
trading partner are presented in figure ES.2.
Figure ES.2
U.S. goods and services trade with major bilateral
trading partners, 2018
Source: USITC DataWeb/USDOC
(accessed May 9, 2019); USDOC, BEA, Interactive data, International
Transactions, Services, & IIP, International Transactions, tables 1.2 and
1.3, June 20, 2019.
Note: Underlying data can be found in
appendix table
B.2
.
European Union
The EU as a single entity continued to be the United States’
largest merchandise trading partner in 2018, while EU member countries
comprised 6 of the top 15 U.S. trading partners in terms of two-way (exports
plus imports) trade. U.S. two-way merchandise trade with the EU increased 12.4
percent to $806.4 billion in 2018, accounting for 19.2 percent of total U.S.
merchandise trade with the world. U.S. exports to the EU were $318.6 billion,
which placed the EU as the top U.S. export market for the third year in a row.
U.S. merchandise imports from the EU were $487.8 billion, second to those from
China. Both U.S. exports and U.S. imports with the EU increased in 2018, but
U.S. imports grew more, widening the U.S. merchandise trade deficit with the EU
to $169.1 billion, an increase of 11.8 percent from the previous year. Leading
U.S. exports to the EU included civilian aircraft, engines, and parts; crude
petroleum; medicaments (medicines); refined petroleum products; and nonmonetary
gold. Leading U.S. imports were passenger motor vehicles, medicaments, certain
immunological products, light oils, and parts of turbojets and turbopropellers.
The EU was also the United States’ largest trading partner
in terms of private services in 2018, accounting for 33.4 percent of total U.S.
trade in private services. U.S. services exports increased more than U.S.
services imports, widening the U.S. trade surplus in services with the EU from
$50.3 billion in 2017 to $53.2 billion in 2018.
Among the important U.S.-EU trade developments in 2018 were
the announcement of the establishment of a U.S.-EU Executive Working Group
aimed at reducing transatlantic barriers to trade, a joint U.S.-EU-Japan
scoping paper on damaging nonmarket economic policies of third countries, and a
joint review of the EU-U.S. Privacy Shield Framework.
China
In 2018, China remained the United States’ largest
single-country trading partner based on two-way merchandise trade, accounting
for 15.7 percent of total U.S. merchandise trade with the world. U.S. two-way
merchandise trade with China amounted to $659.8 billion in 2018, an increase of
3.9 percent from 2017. The U.S. merchandise trade deficit with China remained
far higher than the U.S. trade deficit with any other trading partner in 2018,
amounting to $419.2 billion. Its $43.6 billion increase (11.6 percent) relative
to the year before reflected a $34.0 billion increase in U.S. merchandise
imports from China and a $9.6 billion decrease in U.S. merchandise exports to
China in 2018. U.S. merchandise imports from China totaled $539.5 billion in
2018, while U.S. merchandise exports to China totaled $120.3 billion. Leading
U.S. exports to China in 2018 were civilian aircraft, engines, and parts; crude
petroleum; passenger motor vehicles; semiconductors; and soybeans. Leading U.S.
imports from China were cellphones; portable computers and tablets;
telecommunications equipment; and computer parts and accessories.
In 2018, China was the United States’ third-largest services
trading partner, with two-way services trade totaling $75.0 billion—5.6 percent
of total U.S. cross-border services trade in 2018. The U.S. cross-border trade
surplus in services with China increased $240 million in 2018 to $38.5 billion.
However, the rate of growth in the United States’ services imports from China
outpaced that of the United States’ services exports to China. From 2017 to
2018, U.S. services exports to China grew by $1.2 billion, or 2.1 percent,
while U.S. services imports from China grew by $915 million, or 5.8 percent.
In May 2018, prominent bilateral trade issues were addressed
in consultations between the U.S. Trade Representative, the Secretary of the
Treasury, and the Secretary of Commerce on the U.S. side, and the Chinese State
Council Vice Premier, and other high-ranking Chinese officials on China’s side.
Major topics addressed by U.S. and Chinese officials as part of these
consultations were increasing U.S. agricultural and energy exports to China,
intellectual property protection, and encouraging two-way bilateral investment.
China also imposed 25 percent ad valorem tariffs on selected
U.S. products in response to U.S. tariffs at that level on approximately $50
billion of Chinese imports, which the United States imposed following USTR’s
section 301 investigation. Both the United States and China imposed the first
tranche of their tariffs on July 6, 2018, and the second tranche on August 23,
2018. USTR took further action under section 301, imposing an additional 10
percent tariff on approximately $200 billion of Chinese imports on September 24,
2018.
Canada
In 2018, Canada was the United States’ second-largest
single-country trading partner after China for the fourth consecutive year. The
value of U.S. two-way merchandise trade with Canada rose 6.1 percent to $617.1
billion in 2018, accounting for 14.7 percent of total U.S. merchandise trade
with the world. Both U.S. merchandise exports and imports with Canada increased
in 2018 from the previous year, but imports outpaced exports, resulting in a
$2.6 billion increase (15.8 percent) in the U.S. merchandise trade deficit with
Canada to $19.7 billion. Leading U.S. exports to Canada included crude
petroleum; civilian aircraft, engines, and parts; motor vehicles—both for
passengers and for goods transport—as well as their parts and accessories; and
light oils. Top U.S. imports from Canada included crude petroleum; passenger
motor vehicles and their parts and accessories; refined petroleum products;
natural gas; and coniferous wood and products.
Canada remained the second-largest single-country U.S.
trading partner for services in 2018, after the UK. Two-way services trade with
Canada grew in 2018 to $99.3 billion, while the U.S. surplus in services
increased to $28.0 billion, up from $24.9 billion the year before.
In 2018, a major focus of U.S.-Canada trade relations was
the proposed USMCA, which all parties signed on November 30, 2018. Pending
final actions by the three countries, NAFTA remained in force. The WTO
established a dispute settlement panel in a case requested by Canada concerning
U.S. antidumping and countervailing duties on Canadian softwood lumber
products. However, no new negotiations on the softwood lumber agreement took place
between the United States and Canada in 2018. In other developments, U.S. and
Canadian officials signed a memorandum of understanding on the Canada-United
States Regulatory Cooperation Council, reaffirming commitments to closer
regulatory alignment.
Mexico
In 2018, Mexico was the United States’ third-largest
single-country merchandise trading partner. U.S. two-way merchandise trade with
Mexico amounted to $611.5 billion in 2018, an increase of 9.7 percent from
2017. Mexico accounted for 14.5 percent of U.S. trade with the world. U.S.
merchandise exports to Mexico totaled $265.0 billion in 2018, and U.S.
merchandise imports from Mexico amounted to $346.5 billion. Both U.S.
merchandise imports and exports with Mexico increased in 2018 from the previous
year. As the growth in imports outpaced that of exports, the merchandise trade
deficit grew by $10.6 billion (14.9 percent) from the previous year, totaling
$81.5 billion in 2018. Leading U.S. exports to Mexico included light oils;
refined petroleum products; computer parts and accessories; diesel engines; semiconductors;
parts and accessories of bodies (including cabs) for motor vehicles; and
civilian aircraft, engines, and parts. Leading U.S. imports from Mexico
included passenger motor vehicles, motor vehicles for goods transport,
telecommunications equipment, road tractors for semi-trailers, color TV
reception apparatus, and insulated ignition wiring sets.
Mexico was the United States’ sixth-largest single-country
trading partner for services in 2018. U.S. exports of services to Mexico
increased 4.0 percent ($1.3 billion) to $33.4 billion in 2018, while U.S.
services imports from Mexico increased 1.2 percent ($310 million) to $25.6
billion. This resulted in a U.S. services trade surplus of $7.7 billion with Mexico
in 2018.
A major focus of U.S.-Mexico trade relations in 2018 was the
signing of USMCA on November 30, 2018. Joint efforts to modernize border
procedures and facilities also continued in 2018, with the creation of new
customs and inspection processes, pedestrian and vehicle inspection facilities,
and vehicle processing lanes.
Since the 2015
conclusion of a pilot program to address cross-border trucking between the
United States and Mexico under NAFTA, the Federal Motor Carrier Safety
Administration has been accepting applications from Mexico-domiciled motor
carriers interested in conducting long-haul operations beyond the U.S.
commercial zones.
Japan
In 2018, Japan remained the United States’ fourth-largest
single-country trading partner in terms of two-way trade, accounting for 5.2
percent of total U.S. merchandise trade. The value of U.S. two-way merchandise
trade with Japan grew 6.6 percent from 2017, to $217.6 billion in 2018. U.S.
merchandise exports to Japan totaled $75 billion in 2018, and U.S. merchandise
imports from Japan amounted to $142.6 billion. Although both imports and
exports grew from 2017 to 2018, U.S. exports to Japan outpaced U.S. imports
from Japan, and the U.S. merchandise trade deficit with Japan declined by $1.2
billion from 2017 (1.7 percent), totaling $67.6 billion in 2018. Leading U.S.
exports to Japan were civilian aircraft, engines, and parts; liquefied propane;
corn; semiconductor manufacturing machines; and medicaments. Leading U.S.
imports from Japan were passenger motor vehicles, parts for airplanes or
helicopters, motor vehicle gearboxes, and parts for printers.
In 2018, Japan remained the United States’ third-largest
single-country services trading partner, representing 5.5 percent of U.S.
services trade. U.S. cross-border services exports to Japan fell by $805
million, or 1.8 percent, to $44.4 billion in 2018, while U.S. cross-border
services imports from Japan increased by $1.4 billion, or 4.8 percent, to $34.5
billion. As a result, the U.S. surplus in services trade with Japan declined to
$14.0 billion from $16.2 billion the year before.
In 2018, President Trump and Prime Minister Abe of Japan
agreed to initiate bilateral trade negotiations for a possible U.S.-Japan Trade
Agreement. The United States has sought to increase regulatory compatibility in
key goods sectors, and to obtain more fair and equitable trade in the motor
vehicle sector. Both the United States and Japan have reaffirmed their common
interests in addressing nonmarket economic issues including excess capacity and
forced technology transfer. Other trade-related developments in 2018 include a
reduction in Japan’s safeguard tariff on imports of frozen beef, the reopening
of the Japanese market to U.S. lamb and goat meat exports, and reforms to the
requirements for drug producers supplying the Japanese pharmaceutical market.
Republic of Korea
The Republic of Korea (South Korea) continued to be the
United States’ sixth-largest single-country merchandise trading partner in 2018
(behind Germany and ahead of the United Kingdom), accounting for 3.1 percent of
U.S. trade with the world. Two-way merchandise trade grew 9.0 percent from the
previous year to $130.6 billion in 2018. U.S. merchandise exports to South
Korea were valued at $56.3 billion in 2018, while U.S. merchandise imports from
South Korea totaled $74.2 billion. The resulting trade deficit with South Korea
was $17.8 billion in 2018, down 22.7 percent from 2017, as the increase in U.S.
exports to South Korea from 2017 to 2018 outpaced the increase in U.S. imports
from South Korea over the same period. Leading U.S. exports to South Korea
included crude petroleum; machines for the manufacture of semiconductor devices
or electronic integrated circuits; civilian aircraft, engines, and parts; beef;
passenger motor vehicles; liquefied propane; natural gas; and semiconductors.
Leading U.S. imports from South Korea included passenger motor vehicles,
cellphones, computer parts and accessories, refined petroleum products, and
immunological products.
In 2018, South Korea remained the United States’
ninth-largest single-country services trading partner based on two-way trade.
U.S. services exports to South Korea fell 6.7 percent in 2018 to $21.9 billion,
while U.S. services imports from South Korea rose by 7.0 percent in 2018 to
reach $9.9 billion. As a result, the U.S. services trade surplus with South
Korea decreased by 15.6 percent, from $14.3 billion in 2017 to $12.0 billion in
2018.
In 2018, the United States and South Korea negotiated and
signed modifications to the U.S.-Korea FTA (KORUS), which originally entered
into force on March 15, 2012. The new modifications were signed on September
24, 2018, and entered into force on January 1, 2019. The 2018 modifications to
KORUS included a 20-year extension to the phaseout of the 25 percent U.S.
tariff on South Korean trucks, provisions on doubling the annual quota per
manufacturer of U.S.-origin trucks that can meet U.S. safety standards and
enter the South Korean market without further modification eliminating
duplicative emissions testing for U.S. exports of automotive vehicles, changing
the treatment of U.S. exports under KORUS by South Korean customs to better
process claims for preferential tariff treatment, and ensuring nondiscriminatory
treatment for U.S. pharmaceutical exports, among others.
India
In 2018, India was the United States’ ninth-largest
single-country trading partner based on two-way merchandise trade (behind
France and ahead of Italy). U.S. two-way merchandise trade with India increased
by 17.8 percent to $87.1 billion in 2018, accounting for 2.1 percent of U.S.
merchandise trade with the world. Both U.S. exports to India and U.S. imports from
India grew from 2017 to 2018, with the increase in exports exceeding the increase
in imports. U.S. merchandise exports to India were $33.1 billion in 2018 and
U.S. merchandise imports from India were $54.0 billion, resulting in a U.S.
merchandise trade deficit with India of $20.9 billion in 2018, down 7.6 percent
from 2017. Leading U.S. exports to India in 2018 were nonindustrial diamonds;
crude petroleum; civilian aircraft, engines, and parts; nonmonetary gold; and
bituminous coal. Leading U.S. imports from India in 2017 were nonindustrial
diamonds, certain medicaments, frozen shrimp, light oils, and gold jewelry.
India was the United States’ seventh-largest single-country
trading partner for services and was the only country among the top eight
services trading partners with which the United States had a services trade
deficit in 2018, though this deficit has been narrowing since 2015. The
services trade deficit with India decreased by 0.6 percent to $4.8 billion in
2018. U.S. cross-border services exports to India amounted to $24.8 billion,
while U.S. cross-border services imports from India amounted to $29.5 billion
in 2018.
Among U.S.-India trade developments in 2018, USTR announced
that it was reviewing India’s eligibility for tariff preferences under GSP due
to concerns with program compliance. At the WTO, the United States submitted a
counternotification to the WTO Committee on Agriculture regarding India’s price
supports for wheat, rice, and cotton.
Taiwan
In 2018, Taiwan remained the 11th-largest single-country
U.S. trading partner (behind Italy and ahead of the Netherlands). U.S. two-way
merchandise trade with Taiwan grew 11.5 percent to $76.0 billion in 2018,
accounting for 1.8 percent of total U.S. merchandise trade with the world. U.S.
merchandise exports to Taiwan were $30.2 billion in 2018 and U.S. merchandise
imports from Taiwan were $45.8 billion, The U.S. merchandise trade deficit with
Taiwan narrowed 7.3 percent to $15.5 billion in 2018, as U.S. exports to Taiwan
rose by a larger amount than U.S. imports from Taiwan. The top U.S. exports to
Taiwan during the year were crude petroleum; civilian aircraft, engines, and
parts; machines for semiconductor or integrated circuit manufacturing; semiconductors;
and computer memories. The top U.S. imports from Taiwan during the year were
computer parts and accessories, microchips, telecommunications equipment,
semiconductor storage devices, and semiconductors.
U.S. services exports to Taiwan increased by 2.5 percent to
$9.6 billion, while U.S. services imports from Taiwan grew 3.4 percent to $8.2
billion. As a result, the U.S. services trade surplus with Taiwan continues to
decline; it decreased by 1.6 percent, from $1.40 billion in 2017 to $1.37
billion in 2018.
The primary forum for bilateral discussions on trade and
investment issues is the U.S.-Taiwan Trade and Investment Framework Agreement
(TIFA). In 2018, while there was no TIFA Council meeting, the U.S.-Taiwan trade
relationship continued through other mechanisms. The key issues remain
technical barriers to trade, digital piracy, investment, and agriculture.
This report provides factual information on the operation of
the U.S. trade agreements program and its administration for calendar year
2018. Section 163(c) of the Trade Act of 1974 (19 U.S.C. 2213(c)) states that
“the International Trade Commission shall submit to the Congress at least once
a year, a factual report on the operation of the trade agreements program.”
Section 1 of Executive Order 11846 defines the trade agreements program to
include “all activities consisting of, or related to, the negotiation or
administration of international agreements which primarily concern trade,”
[3]
and section
163(a) of the Trade Act of 1974 sets out the types of information that the
President is to include in his annual report to the Congress on the operation
of the trade agreements program.
[4]
This report seeks to provide information on the activities defined in the
Executive Order and, to the extent appropriate and to the extent that there
were developments to report and information was publicly available, the
elements set out in section 163(a). This year marks the 70th edition of the
USITC’s report on the operation of the trade agreements program.
This first chapter gives an overview of the international
economic and trade environment within which U.S. trade policy was conducted in
2018. It also provides a timeline of selected key trade activities. Chapter 2
covers the administration of U.S. trade laws and regulations in 2018, including
tariff preference programs such as the Generalized System of Preferences (GSP).
Chapter 3 focuses on U.S. participation in the World Trade Organization (WTO),
including developments in major WTO dispute settlement cases during 2018.
Chapter 4 covers 2018 developments at the Organisation for Economic
Co-operation and Development (OECD) and Asian-Pacific Economic Cooperation
(APEC) forum, as well as developments involving trade and investment framework
agreements. Chapter 5 describes U.S. negotiation of and participation in free
trade agreements (FTAs) in 2018, and chapter 6 covers trade data and trade
relations in 2018 with major U.S. trading partners.
This report is based on primary-source materials about U.S.
trade programs and administrative actions pertaining to them. These materials
chiefly encompass U.S. government reports,
Federal Register
notices,
and news releases, including publications and news releases by the U.S.
International Trade Commission (USITC or the Commission) and the Office of the
United States Trade Representative (USTR). Other primary sources of information
include publications of international institutions, such as the International
Monetary Fund, World Bank, OECD, WTO, United Nations, and foreign governments.
When primary-source information is unavailable, the report draws on
professional journals, trade publications, and news reports for supplemental
factual information.
Like past reports,
The Year in Trade 2018
relies on
data from the U.S. Census Bureau (U.S. Census) of the U.S. Department of
Commerce (USDOC) for the U.S. merchandise trade statistics presented throughout
the report. Most tables in the report present U.S. merchandise trade statistics
using “total exports” and “general imports” as measures,
[5]
except for data
on imports that have entered the United States with a claim of eligibility
under trade preference programs and FTAs. Such data require an analysis of U.S.
“imports for consumption”—the total of all goods that have been cleared by U.S.
Customs and Border Protection (U.S. Customs) to enter the customs territory of
the United States with required duties paid.
[6]
Also, much of the trade data used in the report, including U.S. services and
merchandise trade data, are revised over time, so the trade statistics for
earlier years in this report may not always match the data presented in
previous reports. New this year, a supplemental merchandise trade dataset
reflecting the data used in this report will also be released. The most current
version of the merchandise trade data used in this report can be accessed using
the USITC’s DataWeb database (
https://dataweb.usitc.gov
).
[7]
Chapters 1 and 6 also offer data on services trade. The
information on services trade is based on data for cross-border trade in
private services, which exclude government sales and purchases of goods and
services not included elsewhere. The source of these data is the Bureau of
Economic Analysis (BEA) of the USDOC.
The level of U.S. imports and exports of goods and services
depends on many factors, including the strength of the U.S. and global
economies. The United States had a $20.5 trillion economy in 2018.
[8]
The U.S. economy
grew faster in 2018 than in 2017: U.S. real gross domestic product (GDP)
increased 2.9 percent in 2018, compared to the growth rate of 2.2 percent in
2017 (figure 1.1).
[9]
The industries driving the higher growth rate were professional and business
services; manufacturing; information; and educational services, health care,
and social assistance.
[10]
Figure
1.1
U.S. real gross domestic product, percentage change, 2014–18
Source: USDOC, BEA, Interactive
data, National data, National Income and Product Accounts “Table 1.1.1, Percent
Change from Preceding Period in Real Gross Domestic Product,” June 20, 2019.
Note: Underlying data can be found in
appendix table
B.3
.
The global economic growth rate fell slightly from 3.8
percent in 2017 to 3.6 percent in 2018 (figure 1.2).
[11]
Growth in the
advanced economies slowed to 2.2 percent in 2018, down from 2.4 percent the previous
year. The growth rate of emerging market and developing economies also
fell—decreasing 0.3 percentage points from 4.8 percent in 2017 to 4.5 percent
2018. This decline was primarily due to a slight dip in the growth rates of the
Chinese and Indian economies over this period.
[12]
All of the United States’ top eight trading partners based on two-way trade
showed slower growth rates in 2018 than in 2017 (figure 1.2).
Figure
1.2
Economic growth (real GDP) trends in the world, the United States, and
major trading partners, 2016–18
Note: Underlying data can be found in appendix table
B.4
.
The moderation in global growth in 2018 can be attributed to
short-term uncertainty in certain economies, due to trade tensions and
financial market pressures in large emerging markets and a convergence towards
modest long-term growth rates among advanced economies.
[13]
Compared to its
major trading partners, the United States was the only economy to show an
improvement in its growth rate from 2017 to 2018. While growth in China (6.6
percent) and India (7.1 percent) remained relatively steady—decreasing only 0.2
percentage points for each country from 2017 levels—other economies experienced
steeper declines.
[14]
Canada’s growth rate fell by 1.2 percentage points in 2018, due in part to
lower prices for oil exports, pipeline capacity constraints, and slowing
household spending.
[15]
Japan’s growth fell from 1.9 percent in 2017 to 0.8 percent in 2018, due, in
part, to natural disasters,
[16]
and the EU saw a decrease of 0.6 percentage points in its growth rate over the
same time period. Growth rates among the United States’ top trading partners
were mostly below the world average of 3.6 percent in 2018, with the exception
of China and India.
[17]
For the latter countries, continued levels of high growth were largely due to
changes in government policies that encourage consumption and investment as
well as an expansionary stance on monetary policy.
[18]
Overall world trade volume for goods and services increased
in 2018 by 3.8 percent, a slower rate than the 5.4 percent increase seen in
2016–17.
[19]
Both advanced and emerging economies showed slower growth rates in imports and
exports in 2018.
[20]
In 2018, exports from emerging economies grew by 4.3 percent, down from 7.2
percent in 2017. Exports from advanced economies grew by 3.1 percent, down from
4.4 percent in 2017. Emerging economies’ imports grew by 5.6 percent in 2018,
down from 7.5 percent the previous year, and in advanced economies they grew by
3.3 percent, down from 4.3 percent, over the same period.
[21]
The U.S. dollar appreciated relative to the currencies in
the broad dollar index,
[22]
rising 5.5 percent between January and December 2018. This was in contrast to a
6.3 percent depreciation of the U.S. dollar as measured by the broad dollar
index from January to December 2017. The 2018 trend was driven by the
appreciation of the U.S. dollar against major world currencies, including most
of the currencies of its main trading partners (figure 1.3). Between January 1
and December 31, 2018, the U.S. dollar appreciated by 9.6 percent against the
Indian rupee; 9.1 percent against the Canadian dollar; 6.5 percent against the
British pound sterling; 5.9 percent against the Chinese yuan; 5.2 percent
against the euro; and 0.8 percent against the Mexican peso. Over the same
period, the U.S dollar depreciated by 2.2 percent against the Japanese yen.
[23]
Figure
1.3
Indexes of U.S. dollar exchange rates for selected major foreign currencies, daily, 2018
Note: This figure shows the units of
the foreign currency per unit of the U.S. dollar. A decrease in the index
represents a depreciation of the U.S. dollar relative to the foreign currency,
and an increase in the index represents an appreciation of the U.S. dollar
relative to the foreign currency.
The dollar’s rise was partly driven by the Federal Open
Market Committee’s four interest rate hikes from the 1.25–1.50 percent range to
the 2.25–2.50 range against a backdrop of stronger growth and a
lower-than-expected unemployment rate.
[24]
Investors contributed to the rise by increasing the demand for the dollar in
response to the uncertainty related to the trade conflict between the United
States and China. Investors continued to hold the dollar throughout the
conflict, anticipating that the U.S. economy would be less affected than the
economies of other countries by the uncertainty.
[25]
The appreciation
of the dollar eventually tapered off in late 2018 following a shift in market
expectations about the pace and extent of monetary policy tightening and the
U.S. government shutdown at the end of the year.
[26]
The value of U.S. merchandise exports was $1,664.1 billion
in 2018, a 7.6 percent increase from the 2017 level (figure 1.4 and appendix
table A.1). The value of U.S. merchandise imports totaled $2,541.3 billion over
the same period, an 8.6 percent increase from the 2017 level (figure 1.4 and
appendix table A.2).
[27]
U.S. imports grew more than U.S. exports, leading to an $82.7 billion increase
in the U.S. merchandise trade deficit to $877.2 billion in 2018.
[28]
None of the 11
broad merchandise sectors that make up the U.S. economy experienced a trade
surplus in 2018: these include agricultural products, forest products,
chemicals, energy, textiles and apparel, footwear, minerals and metals,
machinery, transportation equipment, electronic products, and miscellaneous
manufactures.
[29]
Figure
1.4
U.S. merchandise trade with the world, 2016–18
Source:
USITC DataWeb/USDOC (accessed May 9, 2019).
Note: Underlying data can be found in appendix table
B.5
.
Exports of energy-related products had the largest absolute
and relative (percentage) increase in terms of value. Imports in this sector
also experienced the largest relative (percentage) increase, but were second to
imports of chemicals and related products in terms of absolute increase. Energy
exports rose 35.7 percent in 2018, and imports increased by 19.4 percent over
the same period (table 1.1 and table 1.2).
Several factors contributed to the increase in exports and
imports by value in the energy sector in 2018. Crude petroleum,
[30]
which
accounts for a large portion of the trade in the energy products sector (24.1
percent of the exports and 66.8 percent of the imports), drove much of the
large changes in energy sector exports and imports in 2018.
[31]
First, both
U.S. production of and demand for crude petroleum increased in 2018, but the
increase in production exceeded the increase in demand, lowering the demand for
U.S. imports and increasing U.S. exports in volume terms. The increase in U.S.
production of crude petroleum was larger than the increase in domestic refinery
demand for the second year in a row, with domestic consumption growing from
16.6 million to 17.0 million barrels a day (3.8 percent), compared to an
increase in production from 9.4 million to 11.0 million barrels a day (17.2
percent) in 2018.
[32]
As a result, the volume of U.S. imports of crude petroleum decreased by 77.4
million barrels (2.7 percent) in 2018,
[33]
and the volume of U.S.
exports of crude petroleum grew by 308.9 million barrels (73.1 percent) from
2017 to 2018.
[34]
In addition, prices for crude petroleum rose substantially in 2018.
[35]
This price increase contributed to the 108.9 percent ($24.6 billion) increase
in the value of crude petroleum exports
[36]
and resulted in an 18.1 percent ($24.1 billion) increase in the value of
imports, outweighing the decline in import volume (appendix tables A.3 and
A.4).
Transportation equipment continued to be the largest U.S.
export sector in 2018, accounting for 20.3 percent of all U.S. exports. It was
followed by electronic products (16.6 percent of exports) and chemicals and
related products (14.6 percent of exports) (table 1.1 and appendix table A.1).
The top export products were civilian aircraft, engines, and parts; refined
petroleum products; crude petroleum; light oils; nonmonetary gold; and
nonindustrial diamonds (appendix table A.3).
Table
1.1
U.S. merchandise total exports to the world, by USITC digest sector, 2017–18
Sector
2017
2018
change 2017–18
% change 2017–18
Million $
Agricultural products
152,965
154,944
1,979
1.3
Forest products
39,592
40,862
1,270
3.2
Chemicals and related products
227,526
243,436
15,910
7.0
Energy-related products
144,319
195,897
51,578
35.7
Textiles and apparel
22,146
22,712
565
2.6
Footwear
1,432
1,559
127
8.8
Minerals and metals
136,447
146,274
9,827
7.2
Machinery
136,204
143,279
7,075
5.2
Transportation equipment
325,578
337,942
12,364
3.8
Electronic products
268,546
276,896
8,350
3.1
Miscellaneous manufactures
49,081
52,096
3,015
6.1
Special provisions
42,437
48,160
5,723
13.5
Total
1,546,273
1,664,056
117,783
7.6
Source:
USITC DataWeb/USDOC (accessed May 9, 2019).
Note: Because of rounding, figures may
not add to totals shown. For a definition of special provisions, see footnote
43.
Exports in all merchandise sectors increased in 2018 (table
1.1).
[37]
The largest increase in both value and percentage terms occurred in the energy-related
products sector (up $51.6 billion to $195.9 billion). It was followed in value
by chemicals and related products (up $15.9 billion to $243.4 billion) and
transportation equipment (up $12.4 billion to $337.9 billion). At the product
level, there were both increases and decreases in top exports. The largest
increases at the product level were all in the energy-related products sector,
including exports of crude petroleum (up $24.6 billion to $47.2 billion), light
oils (up $9.6 billion to $39.2 billion), refined petroleum products (up $6.8
billion to $55.0 billion), liquefied propane products (up $2.5 billion to $14.9
billion), and bituminous coal (up $2.2 billion to $11.7 billion). Exports of
civilian aircraft, engines, and parts increased $9.4 billion to $130.4 billion.
The largest decline was in soybeans, exports of which declined by $4.4 billion
(20.3 percent) to $17.1 billion. It was followed by passenger motor vehicles,
for which exports declined by $2.7 billion (4.6 percent) to $56.5 billion (appendix
table A.3).
[38]
Imports
Electronic products and transportation equipment continued
to be the top two import sectors in 2018, accounting respectively for 19.9
percent and 18.1 percent of total 2018 U.S. imports (table 1.2 and appendix
table A.2). Passenger motor vehicles were the largest U.S. import product,
valued at $195.5 billion in 2018.
[39]
They were followed by crude petroleum ($157.0 billion), medicaments ($56.0
billion), cellphones ($52.8 billion), and telecommunications equipment ($47.3
billion) (appendix table A.4).
Table
1.2
U.S. merchandise general imports from the world, by USITC digest
sector, 2017–18
Sector
2017
2018
change 2017–18
% change 2017–18
Million $
Agricultural products
147,329
156,588
9,259
6.3
Forest products
44,821
48,696
3,875
8.6
Chemicals and related
products
268,131
311,210
43,079
16.1
Energy-related products
196,833
234,983
38,150
19.4
Textiles and apparel
121,372
127,662
6,291
5.2
Footwear
25,640
26,567
927
3.6
Minerals and metals
200,577
215,281
14,704
7.3
Machinery
196,319
214,652
18,333
9.3
Transportation equipment
434,860
459,726
24,866
5.7
Electronic products
484,121
506,065
21,944
4.5
Miscellaneous manufactures
130,338
139,019
8,681
6.7
Special provisions
90,426
100,817
10,390
11.5
Total
2,340,768
2,541,267
200,498
8.6
Source:
USITC DataWeb/USDOC (accessed May 9, 2019).
Note: Because of rounding, figures may
not add to totals shown. For a definition of special provisions, see footnote
46.
The value of U.S. imports in all 11 sectors increased in
2018 (table 1.2 and appendix table A.2).
[40]
The largest increase in value occurred in the chemicals and related products
sector (up $43.1 billion to $311.2 billion, an increase of 16.1 percent),
followed by the energy-related products sector, which also showed the largest
percentage increase. Imports of energy-related products grew by $38.2 billion
(19.4 percent), from $196.8 billion in 2017 to $235.0 billion in 2018; U.S.
crude petroleum imports alone grew by $24.1 billion to $157.0 billion in 2018.
[41]
Other large
increases in imports were recorded in the transportation equipment sector (up
$24.9 billion to $459.7 billion in 2018) and electronic products sector (up
$21.9 billion to $506.1 billion). After crude petroleum, the largest import
increases at the product level were in petroleum oils (up $8.3 billion to $35.1
billion); computers (up $8.3 billion to $31.7 billion); medicaments (up $5.8
billion to $56.0 billion); and computer parts (up $5.1 billion to $27.1
billion).
Table 1.3 shows U.S. trade with major trading partners,
ranked by total trade (exports plus imports) in 2018. In 2018, the European
Union (EU) remained the United States’ top trading partner in terms of two-way
merchandise trade, followed by China, Canada, and Mexico. Ranked by exports,
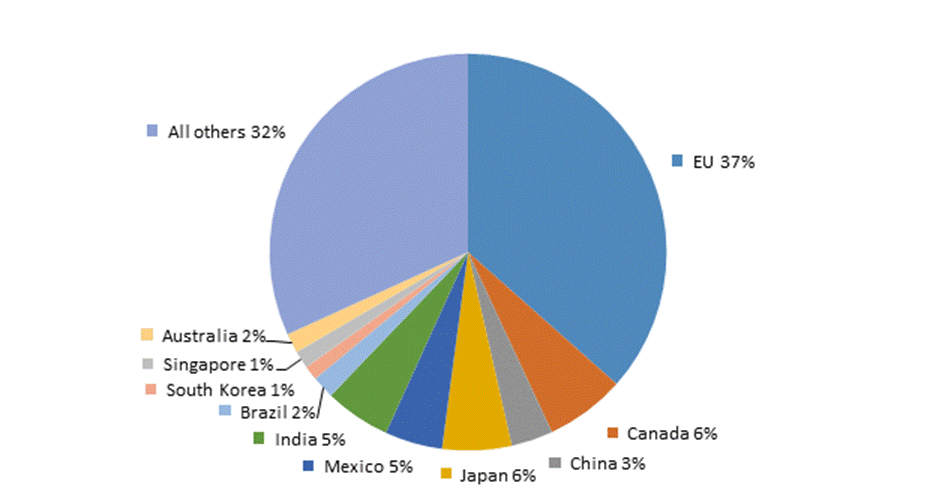
the EU was the leading market for U.S. exports at $318.6 billion (19.1 percent
of total exports). Canada followed closely at $298.7 billion (18.0 percent)
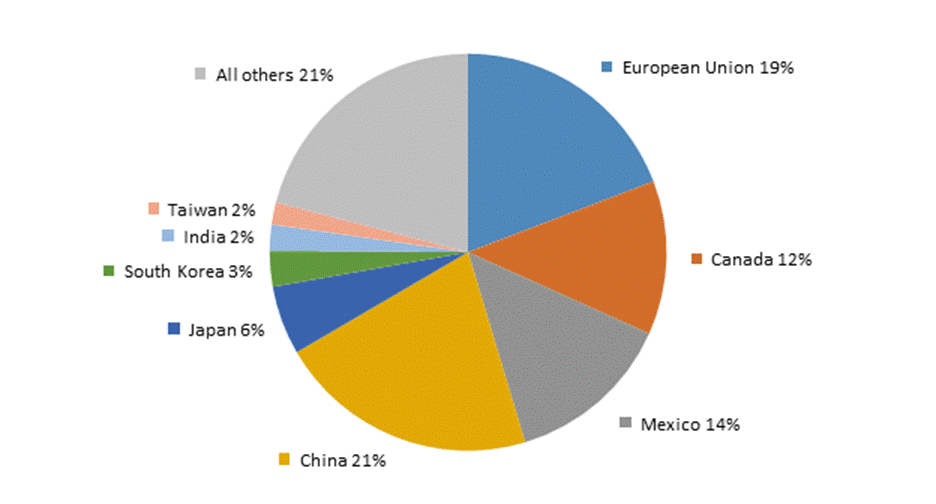
(figure 1.5). Ranked by U.S. imports, China was the leading source of imports
into the United States at $539.5 billion (21.2 percent of imports), followed by
the EU at $487.8 billion (19.2 percent) (figure 1.6).
[42]
Table
1.3
U.S. merchandise trade with major trading partners and the world, 2018
(million dollars), ranked by two-way trade
Major trading partner
U.S. total exports
U.S. general imports
Trade balance
Two-way trade (exports plus imports)
EU
318,619
487,753
-169,134
806,372
China
120,341
539,495
-419,153
659,836
Canada
298,719
318,414
-19,695
617,133
Mexico
265,010
346,524
-81,514
611,534
Japan
74,967
142,596
-67,629
217,562
South Korea
56,344
74,223
-17,879
130,568
India
33,120
54,007
-20,887
87,127
Taiwan
30,243
45,761
-15,519
76,004
All others
466,692
532,494
-65,802
999,186
Total
1,664,056
2,541,267
-877,211
4,205,322
Source: USITC DataWeb/USDOC (accessed
May 9, 2019).
Note: Because of rounding, figures may
not add to totals shown.
U.S. merchandise exports to nearly all leading trading
partners increased from 2017 to 2018 (table 1.4). Exports declined only to
China (down by $9.6 million or 7.4 percent). The largest increase in value was
a $35.4 billion increase in exports to the EU ($318.6 billion in 2018, up from
$283.3 billion in 2017). It was followed by a $21.7 billion increase in exports
to Mexico ($265 billion in 2018, up from $243.3 billion in 2017). In percentage
terms, the largest increase in exports between 2017 and 2018 was to India (28.9
percent), followed by Taiwan (17.5 percent) and South Korea (16.6 percent).
Table
1.4
U.S. merchandise total exports to major trading partners and the
world, 2017–18, ranked by total exports 2018
Trading partner
2017
2018
change 2017–18
% change 2017–18
Million $
EU
283,269
318,619
35,350
12.5
Canada
282,265
298,719
16,454
5.8
Mexico
243,314
265,010
21,696
8.9
China
129,894
120,341
-9,552
-7.4
Japan
67,605
74,967
7,362
10.9
South Korea
48,326
56,344
8,018
16.6
India
25,689
33,120
7,431
28.9
Taiwan
25,730
30,243
4,513
17.5
All others
440,180
466,692
26,512
6.0
Total
1,546,273
1,664,056
117,783
7.6
Source: USITC DataWeb/USDOC (accessed
May 9, 2019).
Note: Because of rounding, figures may
not add to totals shown.
U.S. merchandise imports from all of the major trading
partners increased in 2018 (table 1.5). The largest rise in value was a $53.3
billion increase in imports from the European Union (up 12.3 percent), followed
by a $34 billion increase in imports from China (up 6.7 percent) and a $32.3
billion increase in imports from Mexico (up 10.3 percent). In percentage terms,
the largest increases in imports between 2017 and 2018 were from the EU (12.3
percent), followed by India (11.8 percent) and Mexico (10.3 percent).
Table
1.5
U.S. merchandise general imports from major trading partners and the
world, 2017–18, ranked by general imports 2018
Trading partner
2017
2018
change 2017–18
% change 2017–18
Million $
China
505,462
539,495
34,033
6.7
EU
434,459
487,753
53,294
12.3
Mexico
314,262
346,524
32,262
10.3
Canada
299,280
318,414
19,135
6.4
Japan
136,480
142,596
6,115
4.5
South Korea
71,444
74,223
2,779
3.9
India
48,297
54,007
5,709
11.8
Taiwan
42,462
45,761
3,300
7.8
All others
488,622
532,494
43,872
9.0
Total
2,340,768
2,541,267
200,498
8.6
Source: USITC DataWeb/USDOC (accessed
May 9, 2019).
Note: Because of rounding, figures
may not add to totals shown.
Figure
1.5
Leading U.S. export markets, by share, 2018
Source: DataWeb/USDOC (accessed May
9, 2019).
Note: Underlying data can be found in
appendix table
B.6
.
Figure
1.6
Leading U.S. import sources, by share, 2018
Source: DataWeb/USDOC (accessed May
9, 2019).
Note: Underlying data can be found in
appendix table
B.6
.
In 2018, two-way merchandise trade (total exports plus
general imports) between the United States and its FTA partners totaled $1.6
trillion, accounting for 39.1 percent of total U.S. merchandise trade with the
world ($4.2 trillion).
[43]
This was higher than in 2017, when the value of two-way merchandise trade
between the United States and its FTA partners was $1.5 trillion; however, the
share in 2018 was only slightly higher than 2017, when trade with FTA partners
accounted for 39.0 percent of total U.S. merchandise trade.
The value of U.S. imports for consumption
[44]
entered under
FTAs was $408.0 billion in 2018, a 5.8 percent increase from the 2017 value of
$385.7 billion. These imports accounted for 47.3 percent of all imports from
FTA partners in 2018 and for 16.1 percent of total U.S. imports from the world.
U.S. imports under trade preference programs increased by
3.2 percent, from $35.0 billion in 2017 to $36.1 billion in 2018; they
accounted for 1.4 percent of total U.S. imports during 2018, whereas in 2017
they accounted for 1.5 percent of all imports. Imports that claimed eligibility
under the U.S. Generalized System of Preferences program totaled $23.6 billion
in 2018; imports under the African Growth and Opportunity Act totaled $10.8
billion; imports under the Caribbean Basin Economic Recovery Act and the
Caribbean Basin Trade Partnership Act totaled $1.7 billion; imports under the
Haiti initiatives totaled $0.7 billion; and imports under the Nepal Trade Preference
Program totaled $0.003 billion ($3.1 million).
[45]
Total U.S. cross-border trade in private services (hereafter
“services”) grew by 3.8 percent between 2017 and 2018.
[46]
During that
period, U.S. exports of services increased by 3.4 percent from $779.3 billion
to $805.7 billion, while U.S. services imports grew 4.3 percent from $521.8
billion to $544.3 billion.
[47]
The U.S. surplus in cross-border services trade increased 1.5 percent in 2018
to $261.4 billion (figure 1.7). All of the 10 largest U.S. services export
categories grew in 2018. The services export categories with the highest growth
rates in 2018 included maintenance and repair services (15.2 percent),
professional and management consulting services (10.0 percent), and air
transport (8.6 percent). U.S. imports of services grew in 8 of the top 10
services import categories, with declines in insurance services (down 16.0
percent) and research and development services (down 1.7 percent).
Figure
1.7
U.S. cross-border trade in private services with the world, 2016–18
Source:
USDOC, BEA, Interactive data, International Transactions, Services, and
International Investment Position, International Transactions, Table 3.1, “U.S.
International Trade in Services,” June 20, 2019.
Note: Data for 2018 are preliminary.
Underlying data can be found in appendix table
B.7
.
U.S. travel services exports, valued at $214.7 billion in
2018, accounted for the largest share (26.6 percent) of total U.S. cross-border
services exports in 2018 (appendix table A.8).
[49]
Other major U.S. services export categories included charges for the use of
intellectual property not included elsewhere (n.i.e.)
[50]
($128.8 billion
or 16.0 percent of total exports), financial services
[51]
($112.0 billion
or 13.9 percent), and professional and management consulting services ($86.8
billion or 10.8 percent). Total U.S. services exports grew by 3.4 percent in
2018, slightly slower than the 5.2 percent growth recorded in 2017. Maintenance
and repair services n.i.e.
[52]
grew the fastest, increasing by 15.2 percent in 2018, compared to 6.9 percent
growth in 2017. Professional and management consulting services also
experienced rapid growth, rising 10.0 percent in 2018, compared to 5.9 percent
in 2017. However, 6 of the 10 services categories experienced slower growth in
2018 than in previous years. These notably included technical, trade-related,
and other business services (rising 1.2 percent in 2018, compared to 13.3
percent growth in 2017) and research and development services
[53]
(rising 0.8
percent in 2018, compared to 10.3 percent growth in 2017).
Imports
Travel services also accounted for the largest share of U.S.
cross-border services imports in 2018 ($144.5 billion or 26.5 percent of total
U.S. cross-border services imports) (appendix table A.9). Other categories with
large shares included charges for the use of intellectual property n.i.e.
($56.1 billion or 10.3 percent), professional and management consulting
services ($47.6 billion or 8.7 percent), insurance services ($42.5 billion or
7.8 percent), and air passenger fares ($42.0 billion or 7.7 percent). The
fastest-growing categories of services imports were professional and management
consulting services; technical, trade-related, and other business services;
[54]
air passenger
fares; and financial services (with growth rates of 12.8 percent, 10.6 percent,
8.1 percent, and 8.1 percent, respectively). By comparison, U.S. imports in 2
of the top 10 services categories fell in 2018. Imports of both insurance
services and research and development services declined in 2018 following
growth in 2017; insurance services fell 16.0 percent
[55]
after an
increase of 0.9 percent in 2017, while research and development services fell
1.7 percent after an increase of 3.4 percent in 2017.
In 2018, the EU was the largest market for U.S. services
exports and the largest foreign supplier of U.S. services imports (table 1.6).
[56]
In that year,
the EU accounted for $251.8 billion (31.3 percent) of total U.S. services
exports and $198.6 billion (36.6 percent) of total U.S. services imports
(figures 1.8 and 1.9).
[57]
Following the EU, the top markets for U.S. services exports were Canada, China,
and Japan, while the top sources of imports were Canada, Japan, and India. The
United States maintained a services trade surplus with every major services
trading partner except for India, with which it posted a $4.8 billion deficit
in 2018.
[58]
The posted U.S. trade deficits with India in 2018 are primarily in
telecommunications and other business services sectors, such as research and
development services and professional and management consulting services.
[59]
While the U.S.
trade deficit in other business services widened by $1.0 billion during
2017–18, the total private services trade deficit with India has remained
steady at $4.8 billion due to a $1.0 billion increase in the trade balance in
travel services over the same period. Before 2018, the total private services
trade deficit with India had decreased steadily each year from $7.5 billion in
2014 to $4.8 billion in 2017.
Table
1.6
U.S. cross-border trade in private services with major trading
partners and the world, 2018 (million dollars)
Major
trading partner
U.S. exports
U.S. imports
Trade balance
Two-way trade (exports plus
imports)
EU
251,824
(a
) 198,621
53,203
450,445
Canada
63,648
35,635
28,013
99,283
China
56,710
18,261
38,449
74,971
Japan
44,422
30,397
14,025
74,819
Mexico
33,374
25,664
7,710
59,038
India
24,769
29,530
-4,761
54,299
Brazil
28,061
6,051
22,010
34,112
South Korea
21,902
9,871
12,031
31,773
Singapore
21,597
9,255
12,342
30,852
Australia
21,610
7,779
13,831
29,389
All others
237,828
371,904
64,545
411,111
Total
805,745
544,347
261,398
1,350,092
Source: USDOC, BEA, Interactive data,
International Transactions, Services, and International Investment Position,
International Transactions, table 3.2 and 3.3, “U.S. International Trade in
Services, by Area and Country,” June 20, 2019.
a
U.S. imports from the EU in 2018 are overstated because the data include
government goods and services n.i.e.
Figure
1.8
Leading U.S. export markets for private services, by share, 2018
Source:
USDOC, BEA, Interactive data, International Transactions, Services, and
International Investment Position, International Transactions, tables 3.2 and
3.3, “U.S. International Trade in Services, by Area and Country,” June 20,
2019.
Note: Data are preliminary. Because of
rounding, figures may not add to 100 percent. Underlying data can be found in
appendix table
B.8
.
Figure
1.9
Leading U.S. import sources for private services, by share, 2018
Source:
USDOC, BEA, Interactive data, International Transactions, Services, and
International Investment Position, International Transactions, tables 3.2 and
3.3, “U.S. International Trade in Services, by Area and Country,” June 20,
2019.
Note: Data are preliminary. Because of
rounding, figures may not add to 100 percent. Underlying data can be found in
appendix table
B.8
.
The
following timeline presents selected key trade events between the United States
and its trading partners in 2018. Some of these developments are presented in
more detail in chapters 2 through 6.
January
5:
The United States and South Korea meet in
Washington, DC, to negotiate modifications and amendments to the U.S.-Korea
Free Trade Agreement (KORUS). The two sides address crosscutting and
sector-specific barriers to trade affecting U.S. exports.
8:
Vietnam requests World Trade Organization (WTO)
dispute settlement consultations with the United States regarding certain U.S.
antidumping measures on fish fillets from Vietnam (DS536).
19:
The Office of the U.S. Trade Representative
(USTR) releases its 2017 Report to Congress on China’s WTO Compliance.
22:
President Donald Trump approves relief for U.S.
manufacturers in the form of safeguard tariffs on large residential washers and
crystalline silicon photovoltaic cells under section 201 of the Trade Act of
1974. Canadian imports are excluded from the safeguard measures for washers.
23–29:
The sixth round of North American Free Trade
Agreement (NAFTA) renegotiations takes place in Montreal, Canada.
January 31–February 1:
The United States and South
Korea meet in Seoul, South Korea, to negotiate amendments and modifications to
KORUS. Discussions focus on proposals related to market access and tariffs.
31:
The United States and Laos meet in Vientiane,
Laos, under the U.S.-Laos Trade and Investment Framework Agreement (TIFA).
February
14:
South Korea requests WTO dispute settlement
consultations with the United States regarding antidumping and countervailing
duty measures imposed on certain products from South Korea (DS539).
22:
Vietnam requests WTO dispute settlement
consultations with the United States regarding certain measures affecting U.S.
imports of pangasius seafood from Vietnam (DS540).
February 25–March 5:
The seventh round of NAFTA
renegotiations takes place in Mexico City, Mexico.
28:
In response to a request from India involving a
WTO case (DS456) brought by the United States on certain Indian measures
relating to solar cells and solar modules, the WTO Dispute Settlement Board
(DSB) refers compliance proceedings to the original panel. The compliance
proceedings concern a U.S. complaint that India has failed to comply with the
DSB’s recommendations and rulings within a reasonable period of time.
28:
USTR releases its 2018 Trade Policy Agenda and 2017 Annual Report.
March
6:
The United States and European Union (EU) hold the
first meeting of the Joint Committee established under the U.S.-EU bilateral
agreement on prudential insurance and reinsurance measures.
8:
President Trump issues Proclamation 9705 to impose
a 25 percent tariff on steel, and Proclamation 9704 to impose a 10 percent
tariff on aluminum under section 232 of the Trade Expansion Act of 1962.
Imports of aluminum and steel from Canada and Mexico are exempted pending
ongoing discussions.
10:
USTR Lighthizer meets with EU Commissioner for
Trade Cecilia Malmström and the Japanese Minister of Economy, Trade and
Industry Hiroshige Seko in Brussels. The ministers agree to take initial joint
actions to address issues of market distortion and overcapacity.
14:
The United States requests WTO dispute settlement
consultations with India regarding Indian export subsidies (DS541).
19:
The United States and Armenia meet in Washington,
DC, under the U.S.-Armenia TIFA. Topics including information and communication
technology, renewable energy, and wine-making are discussed.
20:
The United States and United Kingdom (UK) hold
the inaugural meeting of the new U.S.-UK Small and Medium-sized
Enterprises (SME) Dialogue. More than 100 SMEs from the United States and UK,
as well as officials from both governments, discuss ways to enhance SME
cooperation and trade participation.
21–22:
The United States and the UK hold the third
meeting of the U.S.-UK Trade and Investment Working Group, set up to strengthen
the bilateral trade relationship ahead of a possible UK exit from the EU.
Topics including intellectual property rights and enforcement and regulatory
issues related to trade are discussed.
22:
President Trump issues Proclamation 9711 adjusting
imports of steel into the United States, and Proclamation 9710 adjusting
imports of aluminum into the United States under section 232 of the Trade
Expansion Act of 1962. Steel and aluminum imports from Australia, Argentina,
South Korea, Brazil, and the EU are temporarily exempted from the steel tariffs
pending further discussion of satisfactory alternative means to address the
national security concern.
22:
USTR releases a report on the investigation of
China’s acts, policies and practices related to technology transfer,
intellectual property, and innovation under section 301 of the Trade Act of
1974.
23:
The United States requests WTO dispute settlement
consultations with China regarding the protection of intellectual property
rights (DS542).
28:
The United States and South Korea reach an
agreement on the revisions for KORUS.
29:
President Trump suspends duty-free treatment of
Rwandan goods in the apparel sector that would otherwise be eligible for such
treatment under African Growth and Opportunity Act (AGOA).
30:
USTR releases its
National Trade Estimate on
Foreign Trade Barriers
for 2018.
April
2:
Chinese retaliatory tariffs on select U.S. exports
go into effect, in response to U.S. steel and aluminum tariffs applied under
section 232 of the Trade Expansion Act of 1962. The tariffs range from 15 to 25
percent and cover various agricultural, iron, steel, and aluminum products.
3:
USTR determines that the acts, policies, and
practices of the Government of China related to technology transfer, intellectual
property, and innovation covered in the investigation under section 301 of the
Trade Act of 1974 are unreasonable or discriminatory and burden or restrict
U.S. commerce. USTR requests comments and announces a public hearing on its
proposed list of additional tariffs on Chinese products.
4:
China requests WTO dispute settlement
consultations with the United States concerning proposed U.S. tariff measures
on goods from China under section 301 of the Trade Act of 1974 (DS543).
5:
China requests WTO dispute settlement
consultations with the United States concerning U.S. duties on imports of steel
and aluminum products (DS544).
9:
The United States and Bahrain sign a Memorandum of
Understanding on Trade in Food and Agriculture Products.
9:
The WTO DSB establishes a dispute settlement panel
in response to a request from Canada regarding U.S. countervailing measures on
softwood lumber from Canada (DS533).
9:
The WTO DSB establishes a dispute settlement panel
in response to a request from Canada regarding U.S. antidumping measures
applying differential pricing methodology to softwood lumber (DS534).
10:
The United States and Thailand meet under the
U.S.-Thailand TIFA. Both countries discuss ways to resolve customs,
intellectual property, and labor barriers to U.S. exports.
13:
U.S. Secretary of Agriculture Sonny Perdue and
USTR Lighthizer announce Argentina’s finalization of technical requirements
that will allow the resumption of U.S. pork exports to Argentina for the first
time since 1992.
27:
USTR releases its
2018 Special 301 Report
on the global state of intellectual property rights protection and enforcement.
This year’s report identifies 12 countries on USTR’s Priority Watch List; these
are the countries USTR deems most problematic with respect to protection and
enforcement of intellectual property rights. The countries are Algeria,
Argentina, Canada, Chile, China, Colombia, India, Indonesia, Kuwait, Russia,
Ukraine, and Venezuela.
May
1:
A quota on U.S. steel imports from South Korea and
a 10 percent tariff on U.S. aluminum imports from South Korea goes into effect
under section 232 of the Trade Expansion Act of 1962.
4:
The United States submits a counter-notification
to the WTO Committee on Agriculture on India’s market price support for wheat
and rice. This marks the first ever notification made to this committee under
the WTO Agreement on Agriculture regarding another country’s measures.
14:
The United States and Indonesia meet in Jakarta
under their TIFA.
14:
South Korea requests dispute settlement
consultations with the United States concerning definitive safeguard measures
on U.S. imports of certain crystalline silicon photovoltaic products (DS545).
14:
South Korea requests dispute settlement
consultations with the United States concerning definitive safeguard measures
on U.S. imports of large residential washers (DS546).
15:
The WTO DSB panel circulates the Appellate Body
report in ongoing compliance proceedings related to the complaint by the United
States concerning EU subsidies for large civil aircraft (DS316).
15–17:
USTR holds public hearings at the USITC
regarding the proposed additional tariffs on approximately $50 billion worth of
Chinese imports under section 301 of the Trade Act of 1974.
18:
India requests WTO dispute settlement consultations
with the United States regarding certain U.S. measures on steel and aluminum
products (DS547).
25:
The EU General Data Protection Regulation (GDPR)
enters into force.
25–26:
The Asia-Pacific Economic Cooperation (APEC)
holds its 24th meeting of the Ministers Responsible for Trade in Papua, New
Guinea. Discussions focus on enabling trade within the internet and digital
economy, improvements to customs procedures and regulatory standards
conformance, and the reduction of nontariff measures.
28:
The WTO DSB establishes a dispute settlement
panel to review the complaint by South Korea regarding U.S. antidumping and
countervailing duties on certain products (DS539).
28:
The WTO DSB establishes a dispute settlement
panel to review the complaint by the United States regarding Indian export
subsidies (DS541).
31:
USTR Lighthizer meets with EU Commissioner for
Trade Malmström and the Japanese Minister of Economy, Trade and Industry Seko
in Paris. Officials agreed to develop stronger rules on industrial subsidies and
state-owned enterprises, and discussed technology transfer policies and
practices and the maintenance of market-oriented conditions in global trade.
June
1:
Following a statement by the United States that it
has failed to find an alternative means to remove the threat to U.S. national
security, a 25 percent tariff on steel and a 10 percent tariff on
aluminum imports from the EU, Canada, and Mexico to the United States go into
effect under section 232 of the Trade Expansion Act of 1962. The 10 percent tariff
on aluminum is also applied to U.S. imports from Brazil.
1:
President Trump permanently exempts Argentina and
Brazil from steel tariffs and Argentina from aluminum tariffs under section 232
of the Trade Expansion Act of 1962. But both countries are made subject to
absolute quotas, applied to Brazil for steel products, and to Argentina for
aluminum and steel products.
1:
The EU requests WTO dispute settlement
consultations with the United States regarding certain U.S. measures on steel
and aluminum products (DS548).
1:
Canada requests WTO dispute settlement
consultations with the United States regarding certain U.S. measures on steel
and aluminum products (DS550).
5:
Mexico requests WTO dispute settlement
consultations with the United States regarding certain U.S. measures on steel
and aluminum products (DS551).
5:
The Mexican government suspends NAFTA preferential
duty rates on U.S. products classified under 71 codes in the
international Harmonized Commodity Description and Coding System (HS); 50 of the
codes correspond to various steel products. Retaliatory tariffs imposed by
Mexico range up to 25 percent.
12:
Norway requests WTO dispute settlement
consultations with the United States regarding certain U.S. measures on steel
and aluminum products (DS552).
21:
Turkish retaliatory tariffs on select U.S.
exports go into effect, in response to U.S. steel and aluminum tariffs applied
under section 232 of the Trade Expansion Act of 1962. The tariffs range from 4
to 70 percent and cover various products including agricultural, chemical,
forest and consumer goods; and passenger motor vehicles.
22:
The first stage of EU retaliatory tariffs on the
United States goes into effect, in response to U.S. steel and aluminum tariffs
applied under section 232 of the Trade Expansion Act of 1962.
29:
USTR delivers the
2018 Biennial Report on the
Implementation of the African Growth and Opportunity Act
to Congress.
29:
The U.S. Department of Agriculture sets the
in-quota quantity for the fiscal year (FY) 2019 refined sugar tariff-rate quota
at 192,000 metric tons raw value.
29:
Russia requests WTO dispute settlement
consultations with the United States regarding certain U.S. measures on steel
and aluminum products (DS554).
July
1:
Canadian retaliatory tariffs on select U.S.
exports go into effect, in response to U.S. steel and aluminum tariffs applied
under section 232 of the Trade Expansion Act of 1962. The tariffs range from 10
to 25 percent and cover various steel and aluminum products, as well as some
food, chemical, and consumer goods.
5:
The WTO DSB circulates its panel report on the
complaint by Canada regarding U.S. countervailing duties on supercalendered
paper from Canada (DS505).
6:
U.S. tariffs of 25 percent come into effect on approximately
$34 billion of Chinese imports in response to the section 301 investigation.
9–12:
The 17th AGOA Forum is convened in Washington,
DC, with government officials, civil society leaders, and business
representatives in attendance.
9:
The second meeting of the U.S.-UK SME Dialogue is
convened in London.
9:
Switzerland requests WTO dispute settlement
consultations with the United States regarding certain U.S. measures on steel
and aluminum products (DS556).
10–11:
The fourth meeting of the bilateral U.S.-UK
Trade and Investment Working Group is held in London. Participants discuss
opportunities to strengthen the relationship in regard to trade in industrial
and agricultural goods, services and investment, digital trade, intellectual
property rights, regulatory issues, and SMEs.
16:
The United States requests WTO dispute settlement
consultations with Canada (DS557), China (DS558), the EU (DS559), Mexico
(DS560), and Turkey (DS561) regarding the increased duties imposed by these
trading partners on certain U.S. exports.
17:
USTR announces FY 2019 country-specific in-quota
tariff-rate quota allocations for raw cane sugar.
19–20:
The United States and New Zealand meet under
their TIFA.
20:
The WTO DSB establishes a dispute settlement
panel in response to a request from the United States in a case
concerning regulations governing the sale of wine in Canada (DS531).
20:
The WTO DSB establishes a dispute settlement
panel in response to a request from Vietnam concerning certain U.S. antidumping
measures on fish fillets from Vietnam (DS536).
25:
President Trump meets with EU President
Jean-Claude Juncker at the White House and establish the U.S.-EU Executive
Working Group. The Working Group aims to make progress on reducing tariff and
nontariff barriers to trade between the two countries.
30:
President Trump issues a proclamation suspending
the application of duty-free treatment available under AGOA for all apparel
products from Rwanda.
August
2:
The United States and Colombia hold the second
meeting of the U.S.-Colombia Free Trade Commission in Washington, DC. Issues
related to intellectual property, digital trade, services, agriculture, truck
scrappage, and textiles and apparel are discussed.
6:
Russian retaliatory tariffs on select U.S. exports
go into effect, in response to U.S. steel and aluminum tariffs applied under
section 232 of the Trade Expansion Act of 1962. The tariffs range from 25 to 40
percent and cover various transport vehicle, machinery, and equipment goods.
10:
USTR Lighthizer and Japanese Minister for
Economic Revitalization Toshimitsu Motegi meet for ministerial consultations in
Washington, DC.
14:
China requests WTO dispute settlement
consultations with the United States concerning safeguard measures on U.S.
imports of certain crystalline silicon photovoltaic products (DS562).
14:
China requests WTO dispute settlement
consultations with the United States over alleged subsidies given and alleged
domestic content requirements imposed by U.S. states and municipalities in
connection with products in the energy sector (DS563).
15:
Turkey increases its retaliatory tariffs on 20
out of 21 products on the list of select U.S. exports issued in June, in
response to U.S. steel and aluminum tariffs applied under section 232 of the
Trade Expansion Act of 1962. Tariffs now range from 4 to 140 percent.
15:
Turkey requests WTO dispute settlement
consultations with the United States regarding certain U.S. measures on steel
and aluminum products (DS564).
23:
U.S. tariffs of 25 percent come into effect on a
second tranche of Chinese imports of approximately $16 billion in response to
the section 301 investigation.
23:
China requests WTO dispute settlement
consultations with the United States over tariff measures imposed on certain
goods from China (DS565).
27:
USTR Lighthizer and Kenyan Cabinet Secretary for
Industry, Trade and Cooperatives Peter Munya announce the establishment of a
U.S.-Kenya Trade and Investment Working Group to explore ways to deepen the
trade and investment ties between the two countries.
27:
The United States requests consultations with
Russia concerning additional duties on certain products of U.S. origin (DS566).
31:
USTR announces that the United States and Mexico
have reached a preliminary agreement on a United States-Mexico-Canada
agreement, while negotiations with Canada continue.
31:
President Trump notifies Congress of his
intention to enter into a trade agreement with Mexico, and Canada if it is
willing. USTR requests an investigation by the USITC of the likely impact of
the agreement on the U.S. economy.
September
1:
USTR and the 10 Economic Ministers of the
Association of Southeast Asian Nations (ASEAN) hold consultations in Singapore.
The implementation of the U.S.-ASEAN TIFA and harmonization of standards in
trade between the United States and ASEAN economies are discussed.
3:
USTR publishes agreed outcomes of the negotiations
to update KORUS, including amendments and modifications to KORUS.
4–5:
OECD holds the Blockchain Policy Forum in Paris.
The impact of blockchain on government activities and global trade is
discussed.
13:
USTR and Bangladesh hold the Fourth Trade and
Investment Cooperation Forum Agreement Council Meeting in Washington, DC.
Discussions focus on the digital economy, transparency in government
procurement, market access for U.S. cotton, and labor reforms in Bangladesh.
24:
U.S. tariffs of 10 percent come into effect on additional
Chinese imports with an approximate trade value of $200 billion in response to
the section 301 investigation.
24:
USTR announces FY2019 first-come first-served
in-quota allocations pertaining to tariff-rate quotas for refined and specialty
sugar and sugar-containing products.
24:
The United States and South Korea sign an
agreement on modifications and amendments to KORUS in New York.
25:
USTR Lighthizer meets with EU Commissioner for
Trade Malmström and the Japanese Minister of Economy, Trade and Industry Seko
in New York. They discuss issues related to third countries’
non-market-oriented policies and practices and forced technology transfers;
industrial subsidies and state-owned enterprises; WTO reform; and digital trade
and e-commerce.
26:
The WTO DSB establishes a panel in response to a
request from South Korea concerning a U.S. safeguard measure on imports of
crystalline silicon photovoltaic products (DS545).
26:
The WTO DSB establishes a panel in response to a
request from South Korea concerning a U.S. safeguard measure on large
residential washers (DS546).
30:
Canada and the United States reach an agreement,
joining Mexico on a new trilateral trade agreement, the United
States-Mexico-Canada Agreement (USMCA).
October
16:
Officials from the
United States,
Uzbekistan, Kazakhstan, Kyrgyzstan, Tajikistan, and Turkmenistan convene at a
meeting of the U.S.-Central Asia TIFA Council in Washington, DC.
16:
USTR Lighthizer notifies Congress of President
Trump’s intention to negotiate three separate trade agreements with Japan, the
EU, and the United Kingdom.
17:
The 12th meeting of the U.S.-Chile Free Trade
Commission is held in Washington, DC. Issues related to intellectual property
rights protection, pharmaceutical patents, nutritional labeling, and rules of
origin are discussed.
19:
The second meeting held under the U.S.-Argentina
TIFA takes places in Washington, DC.
23:
The eighth meeting of the United States and
Ukraine under their Trade and Investment Council (TIC) convenes in Washington,
DC.
November
1:
The third meeting of the U.S.-UK SME Dialogue is
convened in Washington, DC.
2–7:
The fifth meeting of the U.S.-UK Trade and
Investment Working Group is convened in Washington, DC.
9:
The United States submits a counter- notification
to the WTO Committee on Agriculture on India’s market price support for cotton.
13:
The fourth meeting of the U.S.-Nepal TIFA council
is held in Washington, DC.
15:
The second meeting of the U.S.-Ecuador TIC is
held in Washington, DC. This is the first meeting of the TIC since 2009 and
reflects a new interest in deepening trade and investment ties.
15:
The 2018 APEC Ministerial Meeting is held in Port
Moresby, Papua New Guinea.
15:
The ninth U.S.-EU SME Workshop is held in Vienna,
Austria. Discussions focus on best practices for providing access to finance,
intellectual property protection, and entrepreneurship skills training to SMEs.
20:
USTR releases its report updating information to
its section 301 investigation of China’s acts, policies, and practices related
to technology transfer, intellectual property, and innovation.
21:
The WTO DSB establishes seven dispute settlement
panels regarding certain U.S. measures on steel and aluminum products in
response to requests from China (DS544), the EU (DS548), Canada (DS550), Mexico
(DS551), Norway (DS552), the Russian Federation (DS554), and Turkey (DS564).
21:
The WTO DSB establishes four dispute settlement
panels to review U.S. complaints regarding increased duties imposed by Canada
(DS557), China (DS558), the EU (DS559), and Mexico (DS560) on certain products
of U.S. origin.
21:
The WTO DSB establishes a dispute settlement
panel in response to a U.S. request in a case regarding the protection of
intellectual property rights in China (DS542).
30:
The United States, Canada, and Mexico sign the
United States-Mexico-Canada Agreement (USMCA) in Buenos Aires, Argentina.
December
4:
The WTO DSB establishes two dispute settlement
panels regarding certain U.S. measures on steel and aluminum products in
response to requests from India (DS547) and Switzerland (DS556).
6:
The United States-Moldova Joint Commercial Council
meets in Washington, DC.
6:
Morocco grants market access to U.S. beef exports
under the U.S.-Morocco Free Trade Agreement.
14:
The WTO DSB circulates the Appellate Body
compliance report in the case brought by Mexico regarding U.S. dolphin-safe
labeling provisions for tuna and tuna products (DS381).
18:
The WTO DSB establishes a dispute settlement
panel to review a U.S. complaint regarding additional duties imposed by Russia
on certain products of U.S. origin (DS566).
18:
The WTO DSB circulates its panel report on the
complaint by Turkey regarding U.S. countervailing measures on certain pipe and
tube products (DS523).
19:
The U.S. Department of the Treasury and USTR
notify Congress of their intention to sign the U.S.-UK Covered Agreement on
prudential measures regarding insurance and reinsurance, which is consistent
with the U.S.-EU Covered Agreement signed in 2017.
21:
USTR grants the first round of product exclusions
from the tariffs that went into effect on July 6, 2018, on approximately $34
billion of imports from China.
28:
Venezuela requests WTO dispute settlement
consultations with the United States regarding measures imposed by the United
States on goods of Venezuelan origin, gold imported from Venezuela, liquidity
and the Venezuelan public debt, Venezuelan digital currency, and services
supplied and consumed by certain Venezuelan nationals (DS574).
Source:
Compiled from official and private sources, including the U.S. Department of
Agriculture, Office of the U.S. Trade Representative, White House,
Federal
Register
, Asia-Pacific Economic Cooperation, Organisation for Economic
Co-operation and Development, World Trade Organization, Government of South
Korea, Embassy of Armenia to the United States, U.S. Embassy in Laos, and
Inside
U.S. Trade
.
This chapter surveys activities related to the
administration of U.S. trade laws during 2018, covering import relief laws,
laws against unfair trade practices, national security investigations, trade
adjustment assistance programs, and tariff preference programs. Tariff
preference programs encompass the U.S. Generalized System of Preferences, the
Nepal Trade Preferences Act, the African Growth and Opportunity Act, and the
Caribbean Basin Economic Recovery Act, including initiatives aiding Haiti.
[60]
This section covers safeguard actions under statutes
administered by the Commission, including the global safeguard provisions in
sections 201–204 of the Trade Act of 1974,
[61]
and statutes implementing safeguard provisions in various bilateral free trade
agreements involving the United States. The Commission conducted no new
safeguard investigations during 2018 under sections 201–204 of the Trade Act of
1974 or under any of the provisions that implement safeguard provisions in free
trade agreements involving the United States.
Two global safeguard measures, however, were in effect
during most of 2018. In early 2018, the President imposed new safeguard
measures on imports of crystalline silicon photovoltaic cells (CSPV cells)
[62]
and of large
residential washers (washers).
[63]
On January 23, 2018, the President issued Proclamation 9693 “to facilitate
positive adjustment to competition from imports of certain crystalline silicon
photovoltaic cells (whether or not partially or fully assembled into other
products) and for other purposes.” The proclamation imposed a tariff-rate quota
on imports of solar cells not partially or fully assembled into other products
and an increase of duties on imports of modules for a period of four years,
with annual reductions in the second, third, and fourth years. The measure was
made effective as of February 7, 2018, and applied to imports from all countries
except certain developing countries.
[64]
Also on January 23, 2018, the President issued Proclamation 9694 “to facilitate
positive adjustment to competition from imports of large residential washers.”
The proclamation imposed a tariff-rate quota on imports of washers and a
tariff-rate quota on imports of covered washer parts for a period of three
years and one day, with annual reductions in the second and third years. The
measure was made effective as of February 7, 2018, and applied to imports from
all countries except for products of Canada and certain developing countries.
[65]
The President imposed the measures after receiving
affirmative serious injury determinations and remedy recommendations from the
Commission in late 2017. The Commission made the determinations and
recommendations following the completion of investigations. It had instituted
the investigations for CSPV cells and washers in May and June 2017,
respectively, following receipt of petitions filed by domestic producers of the
named articles.
[66]
The global safeguard measures issued in January 2018 were the first such
measures imposed by the President since 2002, when the President imposed
measures on imports of certain steel products.
Section 301 of the Trade Act of 1974 is the principal U.S.
statute for addressing unfair foreign practices affecting U.S. exports of goods
or services.
[67]
Section 301 may be used to enforce U.S. rights under bilateral and multilateral
trade agreements or to respond to unjustifiable, unreasonable, or
discriminatory foreign government practices that burden or restrict U.S.
commerce. Interested persons may petition the Office of the U.S. Trade
Representative (USTR) to investigate foreign government policies or practices,
or USTR may initiate an investigation itself.
If the investigation involves a trade agreement and
consultations do not lead to a mutually acceptable resolution, section 303 of
the Trade Act of 1974 requires USTR to use the dispute settlement procedures
available under the agreement in question. If the matter is not resolved by the
conclusion of the consultations, section 304 of the Trade Act of 1974 requires
USTR to determine whether the practices in question fulfill any of three
conditions: (1) they deny U.S. rights under a trade agreement; (2) they are
unjustifiable, and burden or restrict U.S. commerce; or (3) they are
unreasonable or discriminatory, and burden or restrict U.S. commerce. If the
practices fulfill either of the first two conditions, USTR must take action.
[68]
If the
practices fulfill the third condition—that is, if they are unreasonable or
discriminatory, and they burden or restrict U.S. commerce—USTR must determine
whether action is appropriate.
[69]
In either case, the USTR must determine the appropriate action to take in
response to the practice. The time period for making these determinations
varies according to the type of practices alleged.
Section 301 Investigations
During 2018, there were two ongoing section 301
investigations: first, on various European Union (EU) meat hormone directives,
which prohibit the use of certain hormones that promote growth in farm animals;
and a second, a USTR self-initiated investigation under section 301 regarding
China’s acts, policies, and practices related to technology transfer,
intellectual property, and innovation.
EU Meat Hormones.
The first section 301
investigation that was active during 2018 related to a longstanding dispute
with respect to EU measures concerning meat and meat products. The
investigation concerned various meat hormone directives of the EU, which
prohibit the use of certain hormones that promote growth in farm animals. The
United States had successfully challenged the EU measures at the WTO, and in
1999 had imposed additional ad valorem duties
[70]
of 100 percent on about $117 million in imports from the EU in retaliation for
the EU measures.
[71]
After a series of consultations aimed at resolving the
dispute, on May 13, 2009, the United States and the EU signed a memorandum of
understanding (MOU).
[72]
Under the MOU, the EU agreed to establish a tariff-rate quota (TRQ)
[73]
with an
in-quota tariff rate of zero for high-quality beef in the amount of 20,000
metric tons (mt).
[74]
The MOU was later revised, establishing a TRQ for high-quality beef in the
amount of 45,000 mt, open to the United States and other qualifying suppliers.
[75]
In February 2016, Congress amended section 301 to authorize
USTR to reinstate any additional duties that had been previously imposed under
section 301 and then subsequently terminated.
[76]
The 2016 amendment provides that USTR may reinstate a section 301 action
following receipt of a written request from a petitioner or any representative
of the domestic industry. It requires that USTR, following the receipt of such
a request, consult with the petitioner and representatives of the domestic
industry and provide an opportunity for public comments. In addition, it
requires that USTR review the effectiveness of the reimposed additional duties.
The amendment also allows USTR to suspend concessions in the meat hormone
dispute with the EU.
On December 9, 2016, representatives of the U.S. beef
industry filed a request with USTR asking that the additional duties be
reinstated.
[77]
In 2017, USTR held a hearing
[78]
and engaged in discussions with the EU about possible modifications of the TRQ
for high-quality beef.
[79]
In September 2018, the EU Commission requested a mandate from the EU Council to
negotiate with the United States, suggesting that the United States be
allocated a part of the existing quota that is also available to other
qualifying exporting countries.
[80]
The EU Council adopted the mandate in October 2018, enabling formal
negotiations to begin.
[81]
According to European Commissioner for Agriculture Phil Hogan, the negotiation
“will not entail any changes to the level of the existing quota or the quality
of beef imported into the EU.”
[82]
China Technology Transfer.
On August 14,
2017, the President issued a memorandum directing USTR to determine, pursuant
to section 302(b) of the Trade Act of 1974, whether to investigate any of
China’s laws, policies, practices, or actions that may be unreasonable or
discriminatory and that may be harming American intellectual property rights
(IPRs), innovation, or technology development.
[83]
In accordance with the President’s memorandum, on August 18, 2017, USTR
initiated an investigation to determine whether any acts, policies, or
practices of the government of China related to technology transfer,
intellectual property, or innovation are unreasonable or discriminatory and
whether the acts, policies, or practices burden or restrict U.S. commerce.
[84]
Following publication of a report under section 302(b) of
the Trade Act of 1974 on March 22, 2018,
[85]
and a determination under section 301(b) of the Trade Act of 1974 that certain
acts, policies, and practices by China are unreasonable or discriminatory and
burden or restrict U.S. commerce, USTR (1) initiated a World Trade Organization
(WTO) dispute by requesting consultations with China regarding certain specific
aspects of China’s technology regulations, and (2) at the direction of the
President, determined to impose additional 25 percent duties on certain Chinese
products with an annual trade value of approximately $50 billion.
[86]
In response to
the U.S. action, China imposed retaliatory tariffs on U.S. goods. In accordance
with the specific direction of the President, the USTR determined to modify the
prior action in the investigation by imposing additional duties on products of
China with an approximate trade value of $200 billion.
[87]
These tariffs
went into effect on September 24, 2018.
[88]
The Trade Representative determined that the following
actions by China are unreasonable or discriminatory and burden or restrict U.S.
commerce:
[89]
China uses foreign ownership restrictions, such as joint venture requirements and
foreign equity limitations, and various administrative review and licensing
processes, to require or pressure technology transfer from U.S. companies.
China’s
regime of technology regulations forces U.S. companies seeking to license
technologies to Chinese entities to do so on non-market-based terms that favor
Chinese recipients.
China
directs and unfairly facilitates the systematic investment in, and acquisition
of, U.S. companies and assets by Chinese companies to obtain cutting-edge
technologies and intellectual property and to generate the transfer of
technology to Chinese companies.
China conducts and supports unauthorized intrusions into, and theft from, the
computer networks of U.S. companies to access their sensitive commercial
information and trade secrets.
[90]
The Trade Representative determined to address the second
category of acts, policies, and practices (involving technology-licensing
regulations) through recourse to WTO dispute settlement.
[91]
USTR initiated
a WTO dispute on March 23, 2018, titled
China—Certain Measures Concerning
the Protection of Intellectual Property Rights
(DS542).
[92]
This report
also describes this dispute in the WTO dispute settlement section in chapter 3.
USTR imposed the added 25 percent ad valorem duties on
certain Chinese goods in two tranches after public comment and public hearings.
The first tranche covered 818 tariff subheadings, with an approximate annual
trade value of $34 billion, and the second tranche covered 279 tariff
subheadings, with an approximate annual trade value of $16 billion.
[93]
USTR
established a process under which U.S. interests may request that particular
products classified within a tariff subheading be excluded from the additional
25 percent duties. On December 21, 2018, USTR approved approximately 1,000
exclusion requests, and stated it would continue to issue decisions on pending
requests on a periodic basis.
[94]
As noted above, at the direction of the President, the USTR
determined to modify the prior action by imposing additional duties on products
of China with an approximate trade value of $200 billion. The rate of this
additional duty was set initially at 10 percent ad valorem and took effect
September 24, 2018. This rate was scheduled to increase to 25 percent ad
valorem on March 2, 2019.
[95]
USTR issued an update of its March 2018 report on November
21, 2018. The update explained “that China fundamentally had not altered its
acts, policies, and practices related to technology transfer, intellectual
property, and innovation, and that in certain areas, China’s acts, policies,
and practices had become of even greater concern.”
[96]
Special 301
The Special 301 law
[97]
requires that USTR annually identify and issue a list of foreign countries that
(1) deny adequate and effective protection of IPRs, or (2) deny fair and
equitable market access to U.S. persons who rely on IPR protection.
[98]
Under the statute, a country denies adequate and effective
IPR protection if the country does not allow foreign persons “to secure,
exercise, and enforce rights relating to patents, process patents, registered
trademarks, copyrights, trade secrets, and mask works.”
[99]
A country denies fair and equitable market access if it
denies access to a market for a product that is protected by a copyright or
related right, patent, trademark, mask work, trade secret, or plant breeder’s
right using laws and practices that violate international agreements or that
constitute discriminatory nontariff trade barriers.
[100]
A country may
be found to deny adequate and effective IPR protection even if it is in
compliance with its obligations under the WTO Agreement on Trade-Related
Aspects of Intellectual Property Rights (TRIPS Agreement).
[101]
In addition, the Special 301 law directs USTR to identify
so-called “priority foreign countries.”
[102]
Priority foreign countries are countries that have the most onerous or
egregious acts, policies, or practices with the greatest adverse impact (actual
or potential) on the relevant U.S. products, and that are not entering into
good-faith negotiations or making significant progress in bilateral or
multilateral negotiations to provide adequate and effective IPR protection.
[103]
The
identification of a country as a priority foreign country triggers a section
301 investigation,
[104]
unless USTR determines that the investigation would be detrimental to U.S.
economic interests.
[105]
USTR has adopted a practice of naming countries to a “watch
list” or a “priority watch list” when the countries’ IPR laws and practices
fail to provide adequate and effective IPR protection, but the deficiencies do
not warrant listing the countries as priority foreign countries.
[106]
The priority
watch list identifies countries with significant IPR concerns that warrant
close monitoring and bilateral consultation. If a country on the priority watch
list makes progress, it may be moved to the watch list or removed from any
listing. On the other hand, a country that fails to make progress may be raised
from the watch list to the priority watch list or from the priority watch list
to the list of priority foreign countries.
In February 2016, Congress enacted amendments to the Special
301 statute that provided that USTR should develop an action plan for each
country that has been identified as a priority watch list country and that has
remained on the priority watch list for at least one year.
[107]
The action
plan should contain benchmarks designed to assist the country to achieve, or
make significant progress toward achieving, adequate and effective protection
of IPRs, and fair and equitable market access for U.S. persons that rely on IPR
protection.
In the 2018 Special 301 review, USTR examined the adequacy
and effectiveness of IPR protection in more than 100 countries.
[108]
In conducting
the review, USTR focused on a wide range of issues and policies, including
inadequate IPR protection and enforcement worldwide, compulsory technology
licensing and transfer, and the unauthorized use of unlicensed software by
foreign governments.
[109]
Although no country was identified as a priority foreign
country in the
2018 Special 301 Report
, the report identified 12
countries on the priority watch list: Algeria, Argentina, Canada, Chile, China,
Colombia, India, Indonesia, Kuwait, Russia, Ukraine, and Venezuela.
[110]
In addition,
the report identified 24 countries on the watch list.
[111]
In keeping China on the priority watch list, and continuing
Section 306 monitoring,
[112]
the report highlighted the urgent need for fundamental structural changes to
strengthen IPR protection and enforcement, as well as equitable market access
for U.S. persons that rely on IPR protection.
[113]
The report
cites many longstanding concerns, such as coercive technology transfer
requirements, structural impediments to effective IPR enforcement, and
widespread infringing activity, including trade secret theft, rampant online
piracy and counterfeiting, and high levels of pirated and counterfeit exports. India
remained on the priority watch list in 2018 due to a lack of measurable
improvement to its IPR framework on issues—both longstanding and new—that have
negatively affected U.S. rights holders over the past year.
[114]
As part of the annual Special 301 process, USTR also issues
a separate report on so-called notorious markets. USTR defines notorious
markets as online or physical marketplaces that are reported to engage in or
facilitate commercial-scale copyright piracy and trademark counterfeiting. The
most recent report,
2018 Out-of-Cycle Review of Notorious Markets
, was
issued in April 2019.
[115]
The report highlights markets where the scale of this activity is such that it
can cause significant harm to U.S. IPR holders. The 2018 report listed 33
online markets and 25 physical markets in 19 countries, including markets in
China and India, “in which pirated or counterfeit products and services
reportedly are available or that facilitate substantial piracy and
counterfeiting.”
[116]
The 2018 Notorious Markets list highlights free trade zones
(FTZs) and the role they may play in facilitating trade in counterfeit and
pirated goods. FTZs have become major facilitators of illegal and criminal
activity, including the illicit trade in pirated and counterfeit goods,
smuggling, and money laundering. FTZs are designated economic areas that are
not subject to the customs duties, taxes, or normal customs procedures of their
host countries. They can range in size from a single warehouse to entire
harbors and cities encompassing thousands of businesses. FTZs are an
increasingly important part of global trade, and they play a particularly
prominent role in the economies of developing countries. The number of FTZs
grew from 79 zones in 25 economies in 1975 to over 3,500 zones in 130 economies
in 2018.
[117]
The U.S. antidumping law is found in Title VII of the Tariff
Act of 1930, as amended.
[118]
This law offers relief to U.S. industries that are materially injured by
imports that are dumped—that is, sold at “less than fair value” (LTFV). The
U.S. government provides a remedy by imposing an additional duty on LTFV
imports.
Antidumping duties are imposed when (1) the U.S. Department
of Commerce (USDOC) has determined that imports are being, or are likely to be,
sold at LTFV in the United States, and (2) the Commission has determined that a
U.S. industry is materially injured or threatened with material injury, or that
the establishment of an industry in the United States is materially retarded,
by reason of such imports. Such a conclusion is called an “affirmative
determination.” Investigations are generally initiated in response to a
petition filed with USDOC and the Commission by or on behalf of a U.S.
industry, but can be self-initiated by USDOC. USDOC and the Commission each
make preliminary determinations and, if the Commission’s preliminary
determination is affirmative, then each agency will make final determinations
during the investigation process.
In general, imports are considered to be sold at LTFV when a
foreign firm sells merchandise in the U.S. market at a price that is lower than
the “normal value” of the merchandise.
[119]
Generally, normal value is the price the foreign firm charges for a comparable
product sold in its home market.
[120]
Under certain circumstances, the foreign firm’s U.S. sales price may also be
compared with the price the foreign firm charges in other export markets or
with the firm’s cost of producing the merchandise, taking into account the
firm’s “selling, general, and administrative expenses” and its profit. Under
the law, this latter basis for comparison is known as “constructed value.”
[121]
Finally, where
the producer is located in a nonmarket economy, a comparison is made between
U.S. prices and a “surrogate” normal value (its factors of production, as
valued by use of a “surrogate” country).
[122]
A nonmarket-economy country means any foreign country that the administering
authority determines does not operate on market principles of cost or pricing
structures, so that prices paid on sales of merchandise in such country do not
reflect the fair value of the merchandise.
[123]
In all three instances, the amount by which the normal value
exceeds the U.S. sales price is the “dumping margin.” The duty specified in an
antidumping duty order reflects the weighted average dumping margins found by
USDOC, both for the specific exporters it examined and for all other exporters.
[124]
This rate of
duty (in addition to any ordinary customs duty owed) will be applied to
subsequent imports from the specified producers/exporters in the subject
country, but it may be adjusted if USDOC receives a request for an annual
review.
[125]
The
Commission instituted 31 new antidumping investigations, and made 34
preliminary determinations and 52 final determinations in 2018.
[126]
As a result of
affirmative final USDOC and Commission determinations, in 2018, USDOC issued 41
antidumping duty orders on 16 products from 22 countries (table 2.1). The
status of all antidumping investigations active at the Commission during
2018—including, if applicable, the date of final action—is presented in
appendix table A.10. A list of all antidumping duty orders and suspension
agreements (agreements to suspend investigations)
[127]
in effect as
of the end of 2018 appears in appendix table A.11.
Table
2.1
Antidumping duty orders that became effective during 2018
a
Trade partner
Product
Range of dumping margins (percent)
Argentina
Biodiesel
60.44–86.41
Belarus
Carbon and Alloy Steel
Wire Rod
280.02
Belgium
Citric Acid and Certain
Citrate Salts
19.3
Canada
Softwood Lumber Products
3.20–7.28
China
Hardwood Plywood Products
183.36
China
Aluminum Foil
48.64–105.80
China
Carton-Closing Staples
115.65–263.40
China
Tool Chests and Cabinets
97.11–244.29
China
Cold-Drawn Mechanical
Tubing of Carbon and Alloy Steel
45.13–186.89
China
Fine Denier Polyester
Staple Fiber
65.17–103.06
China
Stainless Steel Flanges
257.11
China
Cast Iron Soil Pipe
Fittings
33.44–360.39
China
Sodium Gluconate
213.15
China
Forged Steel Fittings
8.00–142.72
Colombia
Citric Acid and Certain
Citrate Salts
28.48
Germany
Cold-Drawn Mechanical
Tubing of Carbon and Alloy Steel
3.11–209.06
India
Cold-Drawn Mechanical
Tubing of Carbon and Alloy Steel
8.26–33.80
India
Fine Denier Polyester
Staple Fiber
21.43
India
Stainless Steel Flanges
14.29–145.25
Indonesia
Biodiesel
92.52–276.65
Italy
Carbon and Alloy Steel
Wire Rod
12.41–18.89
Italy
Cold-Drawn Mechanical
Tubing of Carbon and Alloy Steel
47.87–68.95
Italy
Forged Steel Fittings
49.43–80.20
South Korea
Carbon and Alloy Steel
Wire Rod
41.1
South Korea
Cold-Drawn Mechanical
Tubing of Carbon and Alloy Steel
30.67–48.00
South Korea
Fine Denier Polyester
Staple Fiber
30.15–45.23
South Korea
Low Melt Polyester Staple
Fiber
16.27
Russia
Carbon and Alloy Steel
Wire Rod
436.80–756.93
South Africa
Carbon and Alloy Steel
Wire Rod
135.46–142.26
Spain
Carbon and Alloy Steel Wire
Rod
10.11–32.64
Spain
Ripe Olives
16.88–25.50
Switzerland
Cold-Drawn Mechanical
Tubing of Carbon and Alloy Steel
7.66–30.48
Taiwan
Fine Denier Polyester
Staple Fiber
24.43–48.86
Taiwan
Low Melt Polyester Staple
Fiber
49.93
Taiwan
Forged Steel Fittings
116.17
Thailand
Citric Acid and Certain
Citrate Salts
6.47–15.71
Turkey
Carbon and Alloy Steel
Wire Rod
4.74–7.94
Ukraine
Carbon and Alloy Steel
Wire Rod
34.98–44.03
United Arab Emirates
Carbon and Alloy Steel
Wire Rod
84.10
United Kingdom
Carbon and Alloy Steel
Wire Rod
147.63
Vietnam
Tool Chests and Cabinets
327.17
Source: Compiled by USITC from
Federal
Register
notices.
a
Antidumping duty orders become effective following final affirmative
determinations by USDOC and the Commission. The rates in the table apply in
addition to any ordinary customs duty owed.
Countervailing Duty Investigations
The U.S. countervailing duty law is also set forth in Title
VII of the Tariff Act of 1930, as amended. It provides for the imposition of
additional duties to offset (“countervail”) foreign subsidies on products
imported into the United States.
[128]
In general, procedures for such investigations are similar to those under the
antidumping law. Petitions are filed with USDOC (the administering authority)
and with the Commission. Before a countervailing duty order can be issued,
USDOC must find that a countervailable subsidy exists. In addition, the
Commission must make an affirmative determination that a U.S. industry is
materially injured or threatened with material injury, or that the
establishment of an industry is materially retarded, because of the subsidized
imports.
The Commission instituted 22 new countervailing duty
investigations and made 25 preliminary determinations and 21 final
determinations during 2018. USDOC issued 18 countervailing duty orders on 13
products from eight countries in 2018 as a result of affirmative USDOC and
Commission determinations (table 2.2). The status of all countervailing duty
investigations active at the Commission during 2018, and, if applicable, the
date of final action, is presented in appendix table A.12. A list of all
countervailing duty orders and suspension agreements
[129]
in effect at
the end of 2018 appears in appendix table A.13.
Table
2.2
Countervailing duty orders that became effective during 2018
a
Trade
partner
Product
Range
of countervailable subsidy rates (percent)
Argentina
Biodiesel
71.87–72.28
Canada
Softwood
Lumber Products
3.34–17.99
China
Hardwood
Plywood Products
22.98–194.90
China
Aluminum
Foil
17.14–80.52
China
Tool Chests
and Cabinets
14.03–95.96
China
Cold-Drawn
Mechanical Tubing of Carbon and Alloy Steel
18.27–21.41
China
Fine Denier
Polyester Staple Fiber
38.00–47.57
China
Stainless
Steel Flanges
174.73
China
Cast Iron
Soil Pipe Fittings
7.37–133.94
China
Sodium
Gluconate
194.67
China
Forged
Steel Fittings
13.41
India
Fine Denier
Polyester Staple Fiber
13.38–27.36
India
Stainless
Steel Flanges
4.92–256.16
India
Cold-Drawn
Mechanical Tubing of Carbon and Alloy Steel
8.02–42.60
Indonesia
Biodiesel
34.45–64.73
Italy
Carbon and
Alloy Steel Wire Rod
4.16–44.18
Spain
Ripe Olives
7.52–27.02
Turkey
Carbon and
Alloy Steel Wire Rod
3.81–3.88
Source: Compiled by USITC from
Federal
Register
notices.
a
Countervailing duty orders become effective following final affirmative
determinations by USDOC and the Commission. The rates in the table apply in
addition to any ordinary customs duty owed.
Reviews of Outstanding Antidumping and Countervailing Duty
Orders/Suspension Agreements
Section 751(a) of the Tariff Act of 1930 requires USDOC, if
requested, to conduct annual reviews of outstanding antidumping duty and
countervailing duty orders to ascertain the amount of any net subsidy or
dumping margin and to determine compliance with suspension agreements. Section
751(b) also authorizes USDOC and the Commission, as appropriate, to review
certain outstanding determinations and agreements after receiving information
or a petition that shows changed circumstances.
[130]
Where a
changed-circumstances review is directed to the Commission, the party that is
asking to have an antidumping duty order or countervailing duty order revoked
or a suspended investigation terminated has the burden of persuading the
Commission that circumstances have changed enough to warrant revocation.
[131]
On the basis
of either USDOC’s or the Commission’s review, USDOC may revoke an antidumping
duty or countervailing duty order in whole or in part, or may either terminate
or resume a suspended investigation.
The sunset process began in 1995. It is subject to section
751(c) of the Tariff Act of 1930, which requires both USDOC and the Commission
to conduct “sunset” reviews of existing antidumping duty and countervailing
duty orders and suspension agreements five years after their initial publication
and five years after publication of any subsequent determination to continue
them. These reviews are intended to determine whether revoking an order or
terminating a suspension agreement would be likely to lead to the continuation
or recurrence of dumping or a countervailable subsidy and to material injury.
[132]
If either
USDOC or the Commission reach negative determinations, the order will be
revoked or the suspension agreement terminated. During 2018, USDOC and the
Commission instituted 34 sunset reviews of existing antidumping and
countervailing duty orders or suspended investigations,
[133]
and the
Commission completed 55 reviews. As a result of affirmative determinations by
USDOC and the Commission, 50 antidumping duty and countervailing duty orders
were continued. Appendix table A.14 lists, by date and action, the reviews of
antidumping duty and countervailing duty orders and suspended investigations
completed in 2018.
[134]
Section 129 Investigations
Section 129 of the U.S. Uruguay Round Agreements Act sets
out a procedure by which the Administration may respond to an adverse WTO panel
or Appellate Body report concerning U.S. obligations under the WTO agreements
on safeguards, antidumping, or subsidies and countervailing measures.
Specifically, section 129 establishes a mechanism permitting USTR to request
that the agencies concerned—USDOC and the Commission—issue a consistency or
compliance determination, where such action is appropriate, to respond to the
recommendations in a WTO panel or Appellate Body report.
[135]
Hot-Rolled Steel from India
. Following the
December 19, 2014, adoption by the WTO Dispute Settlement Body (DSB) of the
panel and Appellate Body reports in
United States—Countervailing Measures
on Certain Hot-Rolled Carbon Steel Flat Products from India
(DS436), the
United States stated its intent to implement the recommendations of the DSB in
a manner that respects U.S. WTO obligations.
[136]
Subsequently, the Commission and USDOC issued consistency determinations
pursuant to section 129 in March 2016 and May 2016, respectively.
[137]
On April 22,
2016, the United States notified the DSB that it had complied with the
recommendations and rulings in this dispute.
[138]
On March 29, 2018, India requested the establishment of a
WTO panel pursuant to Articles 6 and 21.5 of the Dispute Settlement
Understanding to review the consistency of the United States’ section 129
determinations with its WTO obligations. India challenged USDOC’s findings
regarding “public body” specificity and the use of benchmarks, and the
Commission’s price effects and impact findings, in their respective consistency
determinations. India also claimed that the United States had failed to
implement a DSB finding that a never-used portion of U.S. law was “as such”
inconsistent with WTO obligations.
[139]
The parties have completed all briefing in this implementation proceeding, the
panel has held its substantive meeting with the parties, and the dispute is currently
under advisement.
[140]
The panel is expected to complete its work and issue its report in 2019.
[141]
Large Residential Washers from South Korea
. On
September 26, 2016, the DSB adopted the panel and Appellate Body reports in
United
States—Anti-Dumping and Countervailing Measures on Large Residential Washers
from Korea
(DS464).
[142]
On September 26, 2016, the United States stated that it intended to implement
the recommendations of the DSB in this dispute in a manner that respects U.S.
WTO obligations, and that it would need a reasonable period of time in which to
do so. On April 13, 2017, an Article 21.3(c) arbitrator determined that the
requested time period implementation would expire on December 26, 2017.
[143]
On December 15, 2017, USTR requested that USDOC make a determination
under section 129 of the Uruguay Round Agreements Act to address the DSB’s
recommendations related to USDOC’s CVD investigation of large residential
washers from South Korea. On December 18, 2017, USDOC initiated a section 129
proceeding, and completed that proceeding on June 4, 2018, with the issuance of
a final determination in which USDOC revised certain aspects of its original
determination.
[144]
Section 337 of the Tariff Act of 1930, as amended,
[145]
prohibits
certain unfair practices in the import trade, notably patent infringement. In
this context, section 337 prohibits the importation into the United States, the
sale for importation, and the sale within the United States after importation
of articles that infringe a valid and enforceable United States patent,
provided that an industry in the United States, relating to articles protected
by the patent concerned, exists or is in the process of being established.
[146]
Similar
requirements govern investigations involving infringement of other federally
registered IPRs, including registered trademarks, registered copyrights,
registered mask works, and registered vessel hull designs. In addition, the
Commission has general authority to investigate other unfair methods of competition
and unfair acts in the importation and sale of products in the United States
(such as products manufactured abroad using stolen U.S. trade secrets), the
threat or effect of which is to destroy or injure a U.S. industry, to prevent
the establishment of a U.S. industry, or to restrain or monopolize trade and
commerce in the United States.
[147]
The Commission may institute an investigation on the basis of a complaint or on
its own initiative.
[148]
If the Commission determines that a violation exists, it can
issue an exclusion order directing U.S. Customs and Border Protection to block
the imports in question from entry into the United States. The Commission can
also issue cease and desist orders that direct the violating parties to stop
engaging in the unlawful practices. The orders enter into force unless
disapproved for policy reasons by USTR
[149]
within 60 days of issuance.
[150]
During calendar year 2018, there were 130 active section 337
investigations and ancillary (secondary) proceedings, 64 of which were
instituted that year. Of these 64 new proceedings, 50 were new section 337
investigations and 14 were new ancillary proceedings relating to previously
concluded investigations. In 46 of the new section 337 investigations
instituted in 2018, patent infringement was the only type of unfair act
alleged. Of the remaining 4 investigations, 1 involved allegations of patent
infringement and trademark infringement; 1 involved allegations of antitrust
violations; 1 involved allegations of false advertising and unfair competition;
and 1 involved allegations of registered and common law trademark infringement,
trademark dilution, and trade dress infringement.
The Commission completed a total of 61 investigations and
ancillary proceedings under section 337 in 2018, including 2 enforcement
proceedings, 4 rescission proceedings, 2 proceedings relating to bond
forfeiture and return, 1 remand proceeding, 2 modification proceedings, and 1
combined modification and rescission proceeding.
[151]
In addition,
the Commission issued 3 general exclusion orders, 12 limited exclusion orders,
and 34 cease and desist orders during 2018. The Commission terminated 26
investigations without determining whether there had been a violation. Of these
terminated investigations, 15 were terminated on the basis of settlement
agreements and/or consent orders, 9 were terminated based on withdrawal of the
complaint, and 2 were terminated for other reasons. Commission activities
involving section 337 proceedings in 2018 are presented in appendix table A.15.
Figure
2.1
Products at issue in
active proceedings, 2018
Source: USITC calculations.
Note: Underlying data can be found in
appendix table
B.9
.
The section 337 investigations active in 2018 continued to
involve a broad spectrum of products. As in prior years, technology products
were the single largest category, with approximately 38 percent of the active
proceedings involving computer and telecommunications equipment and another 6
percent involving consumer electronics. The second-largest category was
pharmaceuticals and medical devices, which were at issue in about 13 percent of
the active proceedings. Automotive, manufacturing, and transportation products
were at issue in about 12 percent of the active proceedings, and small consumer
products were at issue in about 9 percent of the proceedings (figure 2.1). The
remaining 22 percent of active proceedings involved a wide variety of other
types of articles, including toner cartridges, heavy-duty industrial mats, LED
concert lights, beer dispensers, convertible sofas, arrow rests, baby formula
supplements, carburetors, refrigerator water filters, cover plates for switches
and outlets, and strength training systems.
At the close of 2018, 69 section 337 investigations and
related proceedings were pending at the Commission. As of December 31, 2018,
there were 114 exclusion orders based on violations of section 337 in effect.
Appendix table A.16 lists the investigations in which these exclusion orders
were issued. Copies of the exclusion orders are available on the Commission’s
website at
https://www.usitc.gov/intellectual_property/exclusion_orders.htm
.
For additional detailed information about 337 investigations instituted since
October 1, 2008, see the Commission’s “337Info” database, found at
https://pubapps2.usitc.gov/337external
.
During 2018, USDOC completed two investigations and
instituted two new investigations under the national security provisions in
section 232 of the Trade Expansion Act of 1962.
[152]
In
the two completed investigations, relating to steel and aluminum respectively
and begun in 2017, the Secretary of Commerce (the Secretary) made affirmative
findings and remedy recommendations. The President concurred with the
Secretary’s findings in both investigations and issued proclamations imposing
higher duties on the subject imports. The Secretary instituted two new
investigations under section 232 in May and July 2018, respectively, on imports
of automobiles and uranium. Both investigations were pending at the end of
2018.
On March 8, 2018, the President issued two proclamations,
Proclamation 9705 and 9704, imposing higher tariffs on certain steel and
aluminum products, respectively. The proclamations were issued following
receipt of reports and findings from the Secretary under the national security
provision, section 232 of the Trade Expansion Act of 1962.
The higher tariffs—25 percent ad valorem on
certain steel products, and 10 percent ad valorem on certain aluminum
products—remained in effect for the duration of 2018 and were still in effect
when this report was prepared in 2019. The President modified the proclamations
several times during 2018 to exempt certain countries and products.
On May 23, 2018, the Secretary initiated an investigation
under section 232 of the Trade Expansion Act to determine the effects on national
security of imports of automobiles, including cars, SUVs, vans and light
trucks, and automobile parts. USDOC scheduled public hearings in the
investigation for July 19–20, 2018.
[153]
The investigation was still in progress at the end of 2018.
[154]
For country-specific
developments in this investigation, see the European Union, Canada, Mexico,
Japan, and South Korea sections in chapter 6.
On July 18, 2018, the Secretary initiated an investigation
under section 232 of the Trade Expansion Act to determine the effects on the
national security of imports of uranium. Interested parties were invited to
submit written comments on the investigation by September 10, 2018;
[155]
this date was later extended to September 25, 2018.
[156]
The
investigation was in progress at the end of 2018.
[157]
Section 232 of the Trade Expansion Act requires the
Secretary to submit a report to the President within 270 days of instituting an
investigation. The report must include the Secretary’s findings “with respect
to the effect of the importation of such article in such quantities or under
such circumstances upon the national security” and his recommendations for
action or inaction. The statute also provides that if the Secretary finds that
the imported article “is being imported into the United States in such
quantities or under such circumstances as to threaten to impair the national
security,” he must so advise the President in his report.
[158]
Steel Proclamations
The Secretary initiated the steel investigation on April 19,
2017. On April 20, 2017, the President signed a memorandum directing the
Secretary to proceed expeditiously in conducting the investigation. The
Secretary transmitted his report to the President on his department’s national
security investigation of U.S. steel imports on January 11, 2018. Based on
findings in the report, the Secretary found “the present quantities and
circumstance of steel imports are ‘weakening our internal economy’ and threaten
to impair the national security as defined in Section 232.” He found that
several important factors—including the level of global excess capacity, the
level of U.S. imports, the reduction in basic U.S. oxygen furnace facilities
since 2001, and the potential impact of further U.S. plant closures on capacity
needed in a national emergency—supported recommending action under section 232.
[159]
To address the threat and to enable U.S. steel producers to
operate at about an 80 percent or better capacity utilization rate based on
available capacity in 2017, the Secretary recommended two alternative courses
of action: (1) apply a quota to imports of five categories of steel—flat, long,
semi-finished, pipe and tube, and stainless (“subject steel”)—at a level of 63
percent of each country’s 2017 import levels, or (2) apply a tariff to imports
of subject steel at a rate of 24 percent ad valorem.
[160]
On March 8, 2018, the President issued Proclamation 9705,
which imposed a tariff at a rate of 25 percent ad valorem on imports of subject
steel,
[161]
but exempted imports of subject steel from Canada and Mexico pending ongoing
discussions.
[162]
The President subsequently issued Proclamation 9711 of March 22, 2018,
temporarily exempting Australia, Argentina, South Korea, Brazil, and the
European Union (EU) from the tariff after having found satisfactory alternative
means to address the national security concern.
[163]
The President
subsequently issued several additional proclamations making further
adjustments.
[164]
Aluminum Proclamations
The Secretary initiated the investigation on aluminum
imports on April 26, 2017. On April 27, 2017, the President signed a memorandum
directing the Secretary to proceed expeditiously in conducting his
investigation. The President further directed that if the Secretary found that
aluminum was being imported into the United States in such quantities or under
such circumstances as to threaten to impair the national security, the
Secretary should recommend actions and steps that should be taken to adjust
aluminum imports so that they would not threaten to impair the national
security.
[165]
The Secretary transmitted his department’s report on U.S.
aluminum imports to the President on January 19, 2018. In the report, the
Secretary stated that “the present quantities and circumstances of aluminum
imports are ‘weakening our internal economy’ and threaten to impair the
national security as defined in Section 232.” He further stated that “the U.S.
Department of Defense and critical domestic industries depend on large
quantities of aluminum”; that “import trends have left the United States almost
totally reliant on foreign producers of primary aluminum” (i.e., unwrought
aluminum that is not from recycled sources); that “the United States is at risk
of becoming completely reliant on foreign producers of high-purity aluminum
essential for key military and commercial systems”; and that “the domestic
aluminum industry is at risk of becoming unable to satisfy existing national
security needs or respond to a national security emergency that requires a
large increase in domestic production.”
[166]
The Secretary again recommended two alternative courses of
action. He recommended that the President (1) impose a worldwide quota on
imports of primary aluminum and five types of wrought aluminum (collectively
“subject aluminum”
[167]
)
at a level of 86.7 percent of 2017 import levels, or apply a tariff on all
imports of subject aluminum at a rate of 7.7 percent ad valorem; or (2) impose
a tariff on imports of subject aluminum from a subset of economies (China, Hong
Kong, Russia, Venezuela, and Vietnam) at a rate of 23.6 percent ad valorem. The
Secretary stated that these five economies “are the source of substantial
imports due to significant overcapacity, and/or are potential unreliable
suppliers or likely sources of transshipped aluminum from China.”
[168]
On March 8, 2018, the President issued Proclamation 9704,
which imposed a tariff at a rate of 10 percent ad valorem, in addition to the
current rate of duty, on imports of subject aluminum, but exempted imports of
subject aluminum from Canada and Mexico pending ongoing discussions.
[169]
The President
subsequently issued Proclamation 9710, temporarily exempting Australia,
Argentina, South Korea, Brazil, and the EU from the tariff after having found
satisfactory alternative means to address the national security concern,
[170]
and later
issued additional proclamations making further adjustments.
[171]
For several decades, the United States has provided trade
adjustment assistance (TAA) to aid U.S. workers and firms adversely affected by
import competition.
[172]
On June 29, 2015, President Barack Obama signed into law the Trade Preferences
Extension Act (TPEA). Title IV of the TPEA—the Trade Adjustment Assistance
Reauthorization Act of 2015 (TAARA 2015)—amended and reauthorized TAA for six
years, until June 30, 2021.
[173]
The main TAA programs in effect in fiscal year (FY) 2018 were TAA for Workers,
administered by the U.S. Department of Labor (USDOL), and TAA for Firms,
administered by the U.S. Department of Commerce (USDOC). A third program, TAA
for Farmers, administered by the U.S. Department of Agriculture (USDA), was
reauthorized by Congress under the TPEA of 2015.
[174]
However, the
U.S. Congress did not appropriate funding for new participants in this program
for FY 2018.
[175]
As a result, USDA did not accept any new petitions or applications for benefits
in FY 2018.
[176]
Selected developments in the TAA programs for workers and
firms during FY 2018 are summarized below.
[177]
The provisions relating to TAA for Workers are set out in
chapter 2 of title II of the Trade Act of 1974.
[178]
The program
provides federal assistance to eligible workers who have been adversely
affected by import competition. The TAA program offers a variety of benefits
and services to eligible workers, including training, help with healthcare
premium costs, trade readjustment allowances, reemployment assistance, and
employment and case management services.
[179]
Current information on provisions of the TAA for Workers program, as well as
detailed information on program eligibility requirements, benefits, and
available services, is available at USDOL’s Employment and Training
Administration (ETA) website for TAA,
https://www.doleta.gov/tradeact/
.
For petitioning workers to be eligible to apply for TAA, the
Secretary of Labor must determine that they meet certain criteria relating to
the reasons they were separated from their firm, including declining sales or
production at their firm and increased imports of like or directly competitive
articles.
[180]
(Workers often apply in groups based on their former firms.) Workers at firms
that are or were suppliers to or downstream users of the output of
TAA-certified firms may also be eligible for TAA benefits.
[181]
In 2018, $667.1 million was allocated to state governments
to fund the TAA for Workers program. This funding included $397.9 million for
“training and other activities,” which includes funds for training, job search
allowances, relocation allowances, employment and case management services, and
related state administration; $242.6 million for trade readjustment allowance
benefits; and $26.7 million for reemployment trade adjustment assistance
benefits.
[182]
Groups of workers submitted 1,178 petitions for TAA in FY
2018, up 13.6 percent from the 1,037 petitions filed in FY 2017. USDOL certified
895 petitions covering 76,902 workers as eligible for TAA, and denied 217
petitions covering 17,374 workers.
[183]
The largest number of petitions certified in FY 2018 was in the Midwest census
region, followed by the West, Northeast, and South (table 2.3).
[184]
By state,
California had the most workers certified (6,193 workers), followed by Texas
(5,125), Oregon (4,482), Pennsylvania (4,463), and Ohio (4,241).
[185]
Source: USDOL, ETA, email message to USITC
staff, May 30, 2019.
The majority (57.2 percent, 512 petitions) of the TAA
petitions certified during FY 2018 were in the manufacturing sector, covering
50,849 workers, followed by the professional, scientific, and technical
services sector (14.2 percent, 127 petitions) and the finance and insurance
sector (5.7 percent, 51 petitions) (figure 2.2).
[186]
Figure
2.2
Share of TAA petitions certified by industry sector in FY 2018
a
Source: USDOL, ETA, email message to USITC staff, June 8, 2019.
a
“Other” includes all industry
sectors where less than 20 petitions were certified in FY 2018.
Note: Underlying data can be found in appendix table
B.10
.
The TAA for Firms program
[187]
provides technical assistance to help U.S. firms experiencing a decline in
sales and employment to become more competitive in the global marketplace.
[188]
The program
provides cost-sharing technical assistance to help eligible businesses create
and implement targeted business recovery plans. The program pays up to 75
percent of the costs of developing the recovery plans, with firms also
contributing a share of the cost of creating and implementing their recovery
plans.
[189]
Current information on provisions of the TAA for Firms program, as well as
detailed information on program eligibility requirements, benefits, and
available services, is available at USDOC’s Economic Development Administration
(EDA) website for TAA,
http://www.taacenters.org/
.
To be eligible for the program, a firm must show that an
increase in imports of like or directly competitive articles “contributed
importantly” to the decline in sales or production and to the separation or
threat of separation of a significant portion of the firm’s workers.
[190]
The program
supports a nationwide network of 11 nonprofit or university-affiliated Trade
Adjustment Assistance Centers to help firms to apply for a certification of
eligibility and prepare and to implement a business recovery plan or adjustment
proposal.
[191]
Firms generally have up to five years to implement an approved adjustment
proposal.
[192]
In FY 2018, EDA awarded a total of $13 million in TAA for Firms
Program funds to its national network of 11 Trade Adjustment Assistance
Centers.
[193]
During FY 2018, EDA certified 82 petitions for eligibility and approved 98
adjustment proposals.
[194]
The U.S. Generalized System of Preferences (GSP) program
authorizes the President to grant duty-free access to the U.S. market for about
3,500 products that are imported from designated developing countries and
territories.
[195]
Certain additional products (about 1,500 products) are allowed duty-free
treatment only when originating from countries designated as least-developed beneficiary
developing countries (LDBDCs).
[196]
The President’s authority to provide duty-free treatment under the GSP program,
which had expired on December 31, 2017, was reauthorized on March 23, 2018,
with retroactive coverage from January 1, 2018, through December 31, 2020. The
renewal also made technical modifications to procedures for competitive need
limitations (CNLs) and waivers.
[197]
The goal of the GSP program is to accelerate economic growth
in developing countries by offering unilateral tariff preferences for imports
into the U.S. market.
[198]
An underlying principle of the GSP program is that the creation of trade
opportunities for developing countries encourages broader-based economic
development and creates momentum for economic reform and liberalization.
[199]
Countries are designated as “beneficiary developing
countries” under the GSP program by the President. However, they can lose this
designation based on findings of country practices that violate the provisions
of the GSP statute, including inadequate protection of IPRs or of
internationally recognized worker rights.
[200]
Complaints about such violations (“country practice allegations”) are usually
brought to the attention of the interagency GSP subcommittee by a petition
process; the subcommittee may launch a country practice review in response.
The President also designates the articles that are eligible
for duty-free treatment, but may not designate articles that he determines to
be “import sensitive” in the context of the GSP. Rather, certain goods (e.g., most
footwear, textiles, and apparel) are designated by statute as “import
sensitive” and thus not eligible for duty-free treatment under the GSP program.
The statute further provides that countries “graduate” from the program when
they become “high income,” as defined by the World Bank’s per capita income
tables.
[201]
In addition, the statute allows for ending the eligibility of certain imports,
or imports from specific countries, under certain conditions.
Competitive need limitations (CNLs) are another important
part of the GSP program’s structure. CNLs are quantitative ceilings on GSP
benefits for each product and beneficiary developing country.
[202]
The GSP
statute provides that a beneficiary developing country will lose its GSP
eligibility with respect to a product if the CNLs are exceeded, though waivers
may be granted under certain conditions. Two different measures for CNLs may
apply to U.S. imports of a particular product from a beneficiary developing
country during any calendar year. One CNL measure applies to imports from a
beneficiary developing country that account for 50 percent or more of the value
of total U.S. imports of that product. The other applies to imports that exceed
a certain dollar value ($185 million in 2018).
[203]
In addition, the legislation to reauthorize the GSP program
in 2006 provided that a CNL waiver should be revoked under certain
circumstances: (1) if it has been in effect on a product for five or more
years, and (2) if total U.S. imports from a beneficiary developing country
exceed certain “super-competitive” value thresholds—that is, 75 percent of all
U.S imports or 150 percent of the current year’s CNL dollar limit.
[204]
The following developments with respect to the U.S. GSP
program occurred in 2018:
[205]
Public Law 115-141 established a new timeline for the GSP review:
The date for exclusion of items exceeding CNLs changed from July 1 to November
1. Public Law 115-141 also changed the time period used to determine whether a
product is not produced in the United States. Under prior law, the time period
was a specific date for determining whether a like or directly competitive
domestic product was not produced in the United States. That date was January
1, 1995. Public Law 115-141 amended the law to state that the product must not
have been produced in the United States ‘‘in any of the. . . three calendar
years’’ before the annual review. For the 2017/2018 Annual Review this means
calendar years 2015 to 2017.
[206]
Presidential Proclamation 9687 of December 22, 2017, also
partially removed GSP eligibility from Ukraine, effective April 26, 2018, as
the result of a country practice review of Ukraine’s protection of IPRs. This
partial removal covered 147 subheadings in the Harmonized Tariff Schedule of
the United States (HTS). Ukraine had previously lost its GSP eligibility in
2001, also because of its failure to adequately protect IPRs, but was
reinstated in 2006.
[207]
Presidential Proclamation 9687 of December 22, 2017, ended the
total suspension of Argentina’s GSP benefits, effective January 1, 2018. Argentina’s
GSP benefits had been suspended in March 2012, based on Argentina’s failure to
enforce arbitral awards in good faith. However, Argentina’s GSP benefits had
previously been partially removed as the result of a country practice review of
Argentina’s protection of IPRs. That earlier partial suspension was not ended
by Proclamation 9687, in light of ongoing concerns with Argentina’s protection
of IPRs.
[208]
The GSP Subcommittee initiated country practice reviews of India,
[209]
Indonesia,
Kazakhstan, and Thailand, and held a public hearing on those GSP countries on
June 19, 2018.
[210]
USTR also initiated a country practice review for Turkey on August 16, 2018.
[211]
Results of the 2017/2018 GSP Annual Review included denial of
petitions to add nine products to the list of those eligible to all GSP
beneficiary countries. The products that were not added included certain fresh
pears; certain melon and citrus peel; cottonseed; crude sunflower and safflower
oil; preserved or prepared apples; three different types of acids; and rubber
transmission V-belts. The products remain eligible for GSP benefits, however,
for least-developed beneficiary countries (LDBCs) only. Tart cherry juice
concentrate and other cherry juice was removed from GSP eligibility for Turkey.
A petition to remove non-adhesive plates and sheets of polymethyl methacrylate
from GSP for Indonesia and Thailand was denied. De minimis CNL waivers were not
granted for 92 eligible products.
[212]
One product (ammonium perrhenate from Kazakhstan) that had been excluded during
prior GSP reviews, but for which import levels had dropped below the threshold
amounts set for the current review, was redesignated as GSP eligible. The
President denied four other petitions for redesignations.
[213]
U.S. imports under GSP preferences rose 10.7 percent, from
$21.3 billion in 2017 to $23.6 billion in 2018 (table 2.4). These imports
accounted for 9.9 percent of total U.S. imports from GSP beneficiary countries
and 0.9 percent of U.S. imports from all countries (tables 2.4 and A.2). The
GSP utilization rate for 2018 (total imports claimed under GSP as a share of
eligible imports from GSP countries) was 49.3 percent, slightly down (0.6
percentage points) from 2017.
India was the leading source of imports entered under the
GSP program in 2018, followed by Thailand and Brazil, continuing a pattern
established in 2011 (appendix table A.17). These three countries together
accounted for 55.6 percent of all U.S. imports under GSP in 2018, while the top
five countries (including Indonesia and Turkey) accounted for 73.2 percent of
GSP imports. U.S. imports from four of the top five countries increased in 2018
over the previous year; the exception was Brazil.
Table
2.4
U.S. imports for consumption from GSP beneficiaries, 2016–18
Item
2016
2017
2018
Total imports from GSP
beneficiaries (million $)
201,315
214,626
237,541
Total imports under GSP
(million $)
19,074
21,332
23,617
Imports under LDBDC
provisions (million $)
a
19,016
21,215
23,476
Imports under non-LDBDC
provisions (million $)
b
58
117
140
Imports under GSP (as a
share of all imports from GSP countries)
9.5
9.9
9.9
Imports under GSP (as a
share of all imports eligible for GSP)
48.6
49.9
49.3
Source: USITC DataWeb/USDOC, May 23, 2019.
Note: Because of rounding, figures may not add up to totals shown.
LDBDC = least-developed beneficiary developing country.
a
LDBDC-eligible products are
those for which the rate of duty of “free” appears in the special rate column
of the HTS, followed by the symbol “A+” in parentheses. The symbol “A+”
indicates that all LDBDCs (and only LDBDCs) are eligible for duty-free
treatment with respect to all articles listed in the designated provisions.
b
Non-LDBDC-eligible products
are those for which a rate of duty of “free” appears in the special rate column
of the HTS followed by the symbols “A” or “A*” in parentheses. The symbol “A”
indicates that all beneficiary countries are eligible for duty-free treatment
with respect to all articles listed in the designated provisions. The symbol
“A*” indicates that certain beneficiary countries (specified in general note
4(d) of the HTS) are not eligible for duty-free treatment with respect to any
article listed in the designated provision.
In 2018, the chemicals sector was again the top sector for
imports claiming eligibility under GSP, up $724 million, an increase of 15.9
percent from 2017 (appendix tables A.18 and A.19). The minerals and metals
sector ranked second in 2018, as it did in 2017, but imports claiming GSP decreased
$399 million, a drop of 9.5 percent. Agricultural products made up the
third-largest sector in 2018 and saw imports claiming GSP increase $448 million
(13.6 percent) in 2018 over 2017. Energy-related products under GSP increased
872.2 percent, by far the largest percentage increase in 2018.
Among the top 15 U.S. imports under GSP in 2018, 10 imports
increased in value over 2017 levels and 5 decreased in value from 2017 levels
(appendix table A. 20). Gold jewelry imports were the leading GSP import product
by value, but dropped 0.9 percent from 2017. Turkey, Indonesia, and South
Africa accounted for 78.0 percent of this GSP trade.
[214]
Luggage and
travel goods, recently added to GSP eligibility for all beneficiaries, were the
second GSP import by value, increasing 154.5 percent over 2017. (Previously
these were eligible just for LDBDCs and AGOA beneficiary countries.)
[215]
Ferrochromium
was the third-highest GSP import by value, sourced primarily from South Africa.
[216]
GSP imports of
ferrochromium were the second-highest GSP import in 2017, but dropped 24.0
percent in 2018 from the 2017 amount.
Nepal Trade Preference Program
The Nepal Trade Preferences Act (NTPA) was established under
section 915 of the Trade Facilitation and Trade Enforcement Act of 2015.
[217]
This act
entered into effect on December 30, 2016.
[218]
The Nepal Trade Preference Program, which was launched under the authority of
NTPA, was designed to help Nepal’s economic recovery following a 2015
earthquake.
[219]
It is scheduled to expire on December 31, 2025.
[220]
NTPA authorizes the President to provide preferential
treatment to articles imported directly from Nepal into the United States if
the President determines that Nepal meets certain requirements set forth in
NTPA, in the African Growth and Opportunity Act (AGOA), and in GSP statutes.
[221]
NTPA
originally gave Nepal duty-free access to the U.S. market for goods classified
under 66 HTS 8-digit tariff lines, including certain luggage and flat goods in
HTS chapter 42, certain carpets and floor coverings in chapter 57, some apparel
in chapters 61 and 62, two non-apparel made-up textile articles in chapter 63,
and various headwear items in chapter 65.
[222]
Nepal is eligible for duty-free treatment on 77 tariff lines, 31 of which are
also duty free under GSP.
[223]
However, NTPA’s rules of origin differ from GSP’s; i.e., under NTPA, U.S.
content may be counted towards part of the 35 percent value added requirement.
[224]
In 2018, total U.S. imports from Nepal were $98.6 million;
imports from Nepal under GSP were $9.2 million; and imports under NTPA were
$3.1 million. Imports under NTPA represented 3.1 percent of total imports from
Nepal, a slight rise from 2.6 percent in 2017, the first year of the program
(table 2.5). U.S. Imports under NTPA and GSP as a share of all imports from Nepal
that were eligible for NTPA and GSP preferences rose from 59.1 percent in 2017
to 62.2 percent in 2018.
Table
2.5
U.S. imports for consumption from Nepal, 2016–18
Item
2016
2017
2018
Total imports from Nepal
(thousand $)
88,298
91,744
98,628
Imports under GSP
(thousand $)
9,438
8,567
9,176
Imports under NTPP
(thousand $)
0
2,367
3,098
Share of total imports
from Nepal:
Imports under GSP
(percent)
10.7
9.3
9.3
Imports under NTPP
(percent)
0.0
2.6
3.1
Imports under NTPP and GSP
as a share of all NTPP-eligible imports (percent)
b
(
a
)
59.1
62.2
Source: USITC DataWeb/USDOC (accessed May 23, 2019).
a
U.S. imports under NTPA were first recorded in 2017.
b
NTPP-eligible products
are those for which a rate of duty of “free” appears in the special rate column
of the HTS followed by the symbol “NP” in parentheses. The symbol “NP”
indicates that Nepal is eligible for duty-free treatment with respect to all articles
listed in the designated provisions. Includes imports for which preferential
tariff treatment was claimed for NTPP-eligible goods by U.S. importers under
GSP, for HTS rate lines with special duty symbols “A,” “A*”, or “A+.”
Enacted in 2000, the African Growth and Opportunity Act
(AGOA) gives tariff preferences to eligible sub-Saharan African (SSA) countries
pursuing political and economic reform.
[225]
In particular, AGOA provides duty-free access to the U.S. market for all
GSP-eligible products, and for more than 1,800 additional qualifying HTS
8-digit tariff-line items that are eligible under AGOA only. While AGOA’s
eligibility criteria
[226]
and rules of origin
[227]
are similar to those of the GSP program, AGOA beneficiary countries are exempt
from the GSP competitive need limitations (CNLs).
[228]
AGOA also
provides duty-free treatment for certain apparel articles cut and sewn in
designated beneficiary countries on the condition that additional eligibility
criteria are satisfied.
[229]
The current AGOA expiration date is September 30, 2025.
[230]
Each year, the President must consider whether individual
SSA countries are, or remain, eligible for AGOA benefits based on the eligibility
criteria. The Office of the U.S. Trade Representative (USTR) initiates this
annual eligibility review with the publication of a notice in the
Federal
Register
requesting comments and announcing a public hearing. In 2018, 40
SSA countries were eligible for AGOA benefits.
[231]
Of these
countries, 28 were eligible for AGOA textile and apparel benefits for all or
part of 2018.
[232]
Of the countries in the latter group, all but one (South Africa) were also
eligible for additional textile and apparel benefits intended for
lesser-developed beneficiary countries (LDBCs) for all or part of 2018.
[233]
Notable among
these extra benefits is the third-country fabric provision for LDBCs. This
provision provides duty-free treatment for certain apparel articles cut and sewn
in designated beneficiary countries from non-U.S., non-AGOA fabrics as long as
additional eligibility criteria are satisfied.
[234]
Meanwhile, as
a result of the 2018 annual review of AGOA eligibility, Mauritania’s AGOA
eligibility was terminated effective January 1, 2019; 39 SSA countries remain
eligible for AGOA benefits in 2019.
[235]
In addition to the annual review process, any interested
party may submit a petition to USTR, at any time, with respect to whether a
beneficiary SSA country is meeting the AGOA eligibility requirements for an
out-of-cycle review.
[236]
On March 21, 2017, the U.S.-based Secondary Materials and Recycled Textiles
Association filed a petition requesting an out-of-cycle review of AGOA
eligibility for Kenya, Rwanda, Tanzania, and Uganda. The petition stated that a
March 2016 decision by the four countries to raise tariffs and phase in a ban
on imports of used clothing and footwear imposed a significant economic
hardship on the U.S. used clothing industry. The petition further contended
that the decision was a violation of the AGOA eligibility criteria, which
included actions by beneficiary countries to eliminate barriers to U.S. trade
and investment.
In response to the petition, on June 20, 2017, USTR
initiated an out-of-cycle review of AGOA eligibility for Rwanda, Tanzania, and
Uganda, but not Kenya. USTR explained that Kenya had taken steps to reverse the
tariff increases, effective July 1, 2017, and had pledged not to ban imports of
used clothing.
[237]
During the course of the out-of-cycle review, Tanzania and Uganda took similar
actions to address the concerns raised in the petition.
[238]
Therefore, on
March 29, 2018, the President determined that Tanzania and Uganda were meeting
AGOA’s eligibility requirements.
[239]
On July 30, 2018, the President determined that Rwanda was no longer in
compliance with AGOA’s eligibility requirements, and issued a proclamation
suspending the application of duty-free treatment for all AGOA-eligible goods
in the apparel sector from Rwanda, effective July 31, 2018.
[240]
In 2018, the value of U.S. imports that entered free of duty
from beneficiary countries under AGOA (including imports under GSP) was $12.0
billion, an 11.5 percent decline from 2017. These imports accounted for 48.8
percent of total imports from AGOA countries in 2018. In 2018, imports entering
the United States exclusively under AGOA (excluding those entered under GSP)
were valued at $10.8 billion, accounting for 43.9 percent of U.S. imports from
AGOA countries (table 2.6).
[241]
Table
2.6
U.S. imports for consumption from AGOA beneficiaries, 2016–18
Item
2016
2017
2018
Total imports from AGOA
countries (million $)
19,997
24,876
24,527
Imports under AGOA
(million $)
a
10,326
13,545
11,972
Imports under AGOA,
excluding GSP (million $)
b
9,140
12,230
10,777
Imports under AGOA (as a
share of all imports from AGOA countries)
51.6
54.4
48.8
Imports under AGOA (as a
share of all imports eligible for AGOA)
86.8
88.6
85.8
Source: USITC DataWeb/USDOC (accessed May 23, 2019).
a
AGOA-eligible products are
those for which a rate of duty of “free” appears in the special rate column of
the HTS followed by the symbol “D” in parentheses. The symbol “D” indicates
that all AGOA beneficiaries are eligible for duty-free treatment with respect
to all articles listed in the designated provisions. In addition, provisions of
subchapters II and XIX of chapter 98 of the HTS set forth specific categories
of AGOA-eligible products, under the terms of separate country designations
enumerated in subchapter notes. Includes imports for which preferential tariff
treatment was claimed for AGOA-eligible goods by U.S. importers under GSP, for
HTS rate lines with special duty symbols “A,” “A*” (unless the AGOA beneficiary
country is excluded), or “A+.”
b
Imports under AGOA includes
AGOA-eligible products that may be imported under both AGOA and GSP. It is up
to the exporting country or importer to choose under which program it will
claim preferential treatment.
The decline in U.S. imports under AGOA in 2018 compared to
2017 mainly reflected a decline in the value and quantity of imports of crude
petroleum and passenger motor vehicles under the program.
[242]
The value of
U.S. crude petroleum imports under AGOA fell 15.1 percent ($1.3 billion) from
2017 to 2018, and the quantity fell 36.2 percent (59.8 million barrels).
[243]
The value of
U.S. imports of passenger motor vehicles under AGOA fell 54.6 percent ($644.0
million), and the quantity fell by 58.0 percent (25,043 units) (appendix A.22).
[244]
Nigeria, one
of the top petroleum-producing countries in SSA, experienced significant
declines in the value and quantity of its exports of crude petroleum to the
United States under AGOA. Meanwhile, South Africa, the major SSA exporter of
passenger motor vehicles to the United States, experienced considerable
declines in the value and quantity of their exports of passenger motor vehicles
to the United States under AGOA (appendix tables A.21 and A.22).
The major suppliers of duty-free U.S. imports under AGOA in
2018 were Nigeria (40.5 percent of total AGOA imports), Angola (18.1 percent),
South Africa (13.8 percent), Chad (5.6 percent), Kenya (4.3 percent), and Ghana
(3.1 percent). These six countries accounted for 85.3 percent of total imports
by value under AGOA, a drop of 6.3 percentage points from 2017, mainly driven
by a decline of U.S. imports under AGOA from Nigeria, Angola, and South Africa
(appendix table A.21).
[245]
Crude petroleum continued to be the leading import under
AGOA. It accounted for 69.9 percent of the total value of AGOA imports in 2018,
a 2.7 percentage point decline from 72.6 percent in 2017. The decline in value
of U.S. crude petroleum imports under AGOA was mainly due to the decline of
U.S. imports of such products from Nigeria.
Apparel products and passenger motor vehicles were two other
major U.S. imports under AGOA. They accounted for 11.2 percent and 5.0 percent
of the value of total AGOA imports in 2018, respectively (appendix table A.22).
[246]
U.S. passenger
motor vehicle imports under AGOA came exclusively from South Africa, and they
declined in value from $1.2 billion in 2017 to $534.5 million in 2018. The
decline was driven in part by a fall in U.S. sales of imported C-Class
Mercedes, which tend to come from South Africa and were mainly produced by
Mercedes-Benz South Africa (MBSA).
[247]
U.S. imports of apparel products under AGOA were valued at $1.2 billion in
2018, an 18.4 percent increase from $1.0 billion in 2017.
[248]
The increase
was mainly due to an increase in U.S. imports under AGOA from the major
apparel-producing countries in SSA, such as Kenya, Lesotho, Madagascar,
Ethiopia, and Ghana.
[249]
Section 105 of AGOA required the President to establish the
U.S.-Sub-Saharan Africa Trade and Economic Cooperation Forum (also known as the
AGOA Forum) to discuss trade, investment, and development at an annual
ministerial-level meeting with AGOA-eligible countries.
[250]
The 17th
annual AGOA Forum was held in Washington, DC, on July 11–12, 2018. The theme of
the forum was “Forging New Strategies for U.S.-Africa Trade and Investment.”
Participants from the U.S. side included senior government officials, members
of Congress, and private sector and civil society representatives. Participants
from the African side were mainly trade and commerce ministers from the
AGOA-eligible countries, heads of African regional economic communities, and
representatives from the private sector and civil society. During the forum,
U.S. Trade Representative Robert Lighthizer outlined the administration’s trade
policy approach towards Africa, and announced the administration’s intention to
establish a bilateral free trade agreement with an as-yet-undetermined African
country. The ultimate goal, according to the Trade Representative, is to have a
network of free trade agreements which could serve as building blocks to an
eventual African continental trade partnership with the United States.
[251]
The Caribbean Basin Economic Recovery Act (CBERA) was
enacted in 1983 as part of the United States’ Caribbean Basin Initiative. Its
goal was to encourage economic growth and development in the Caribbean Basin
countries by using duty preferences to promote increased production and exports
of nontraditional products.
[252]
The Caribbean Basin Trade Partnership Act (CBTPA) amended CBERA in 2000 and
expanded the list of qualified articles for eligible countries to include
certain apparel.
[253]
The CBTPA also extended “NAFTA-equivalent treatment”—that is, rates of duty
equivalent to those accorded to goods complying with the rules of origin
applicable under the North American Free Trade Agreement (NAFTA)—to a number of
other products previously excluded from CBERA. These products included certain
tuna; crude petroleum and petroleum products; certain footwear; watches and
watch parts assembled from parts originating in countries not eligible for
normal trade relations (NTR) rates of duty; and certain handbags, luggage, flat
goods, work gloves, and leather wearing apparel.
[254]
Products that
are still excluded from CBERA preferential treatment include textile and
apparel products not otherwise eligible for preferential treatment under CBTPA
(mostly textile products) and above-quota imports of certain agricultural
products subject to tariff-rate quotas (primarily sugar, beef, and dairy
products).
CBTPA preferential treatment provisions were extended in
2010 through September 30, 2020, while the original CBERA has no expiration
date.
[255]
In the section that follows, the term CBERA refers to CBERA as amended by the
CBTPA.
At the end of 2018, 17 countries and dependent territories
were designated eligible for CBERA preferences,
[256]
and 8 of those
countries were designated eligible for CBTPA preferences.
[257]
Several
countries have asked to be designated as eligible for benefits under CBERA,
CBTPA, or both, including Turks and Caicos Islands, which requested eligibility
under CBERA; Aruba, The Bahamas, Dominica, Grenada, Montserrat, Saint Kitts and
Nevis, and Saint Vincent and the Grenadines, under CBTPA;
[258]
and Sint
Maarten and Suriname, under both CBERA and CBTPA.
[259]
In 2018, the value of U.S. imports under CBERA increased by
9.1 percent to $1.7 billion from $1.5 billion in 2017 (table 2.7). The top five
imports under CBERA in 2018—methanol (HTS subheading 2905.11), T-shirts
(subheadings 6109.10 and 6109.90), and sweaters (subheadings 6110.20 and
6110.30)—comprised 65 percent of imports under the program (appendix table A.24).
The largest increase in the value of U.S. imports under CBERA was in cotton
T-shirts (subheading 6109.90), which increased by 28.9 percent to $106.2
million, primarily due to a 38.9 percent rise in the quantity imported. The
next-largest increase in import value was in methanol, which rose by 18.4
percent to $447.7 million, despite a 3.4 percent drop in the quantity imported.
However, the value of a number of U.S. imports under the program declined in
2018. U.S. imports of polystyrene declined by $13.8 million (17.6 percent),
mostly because of a decrease in quantity imported of 12.2 percent; and U.S.
imports of crude petroleum declined by $19.6 million (36.6 percent), mostly due
to a decrease in quantity imported of 27.6 percent.
[260]
Table
2.7
U.S. imports for consumption from CBERA/CBTPA beneficiaries, 2016–18
Item
2016
2017
2018
Total
imports from CBERA countries (million $)
5,320
5,798
6,071
Total
imports under CBERA/CBTPA (million $)
1,410
1,544
1,685
Imports
under CBTPA (million $)
a
931
928
1,000
Imports
under CBERA, excluding CBTPA (million $)
b
479
617
685
Imports
under CBERA (as a share of all imports from CBERA countries) (%)
26.5
26.6
27.8
Imports
under CBERA (as a share of all imports eligible for CBERA) (%)
Note: The data for U.S. imports under CBERA include U.S. imports under
CBERA as amended by both CBTPA and the HOPE and HELP Acts. In previous
Year
in Trade
reports, trade data under the
HOPE and
HELP
Acts were reported and analyzed separately only in the “Haiti Initiatives”
section. Thus, numbers from the previous report are not comparable to the
numbers in the table above. Beginning this year, USITC staff have tracked Census
data of textile and apparel imports under HOPE/HELP at the shipment level.
These data are cross-checked against aggregate figures from USDOC’S Office of
Textiles and Apparel (OTEXA), which is part of the International Trade
Administration, to ensure an accurate reporting of HOPE/HELP utilization rates.
a
CBTPA-eligible products are
those for which a special duty rate appears in the special rate column of the
HTS, followed by the symbol “R” in parentheses. The symbol “R” indicates that
all CBTPA beneficiary countries are eligible for special duty rate treatment
with respect to all articles listed in the designated provisions. In addition,
subchapters II and XX of chapter 98 set forth provisions covering specific
products eligible for duty-free entry, under separate country designations
enumerated in those subchapters (and including former CBTPA beneficiaries—El
Salvador, Guatemala, Honduras, Nicaragua, the Dominican Republic, Costa Rica,
and Panama).
b
CBERA (excluding
CBTPA)-eligible products are those for which a special duty rate appears in the
special rate column of the HTS, followed by the symbols “E” or “E*” in
parentheses. The symbol “E” indicates that all beneficiary countries are
eligible for special duty rate treatment with respect to all articles listed in
the designated provisions. The symbol “E*” indicates that certain articles,
under general note 7(d) of the HTS, are not eligible for special duty treatment
with respect to any article listed in the designated provision.
U.S. imports under CBERA accounted for 27.8 percent of all
U.S. imports from CBERA countries in 2018 and for 65.9 percent of the U.S.
imports from CBERA countries that were eligible for CBERA trade preferences.
Haiti was the leading supplier of U.S. imports under the program in 2018,
accounting for 56.8 percent of the total value. Haiti is the only supplier of
apparel under CBERA. Trinidad and Tobago was the second leading supplier of
U.S. imports under CBERA in 2018, accounting for 32.6 percent of the total
value. Trinidad and Tobago was the sole supplier of several top U.S. imports
under CBERA, including methanol, petroleum products, and melamine. Haiti and
Trinidad and Tobago together supplied about 90 percent of U.S. imports under
CBERA preferences. Jamaica and The Bahamas were the third and fourth leading
suppliers, accounting for 5.0 and 3.9 percent of the total, respectively
(appendix table A.23).
Haiti Initiatives
Starting in 2006, several amendments to CBERA have expanded
and enhanced the trade benefits available to Haiti. These benefits give Haitian
apparel producers more flexibility in sourcing yarns and fabrics beyond the
preferences available under CBTPA, which rely on the use of U.S. yarns only.
The Haitian Hemisphere Opportunity through Partnership Encouragement Act of
2006 (HOPE Act)
[261]
and of 2008 (HOPE II Act)
[262]
(collectively referred to as HOPE or the HOPE Acts) amended CBERA to expand the
rules of origin for inputs to apparel and wire harness automotive components
assembled in Haiti and imported into the United States.
[263]
The Haitian
Economic Lift Program of 2010 (HELP Act) expanded existing U.S. trade
preferences (especially duty-free treatment for certain qualifying apparel,
regardless of the origin of inputs) for Haiti that were established under CBTPA
and the HOPE Acts and extended them through September 30, 2020.
[264]
The Trade
Preferences Extension Act of 2015 extended the HOPE/HELP Acts preferences
through September 30, 2025.
[265]
To date, there have been no other changes to the HOPE/HELP Acts, and duty-free
access to the U.S. market remains a major incentive for U.S. firms to import
apparel from Haiti.
[266]
Nearly all (97.0 percent) U.S. imports of apparel from Haiti
entered duty-free under trade preference programs in 2018 (table 2.8). Existing
trade preferences under the CBTPA provisions and the HOPE Acts allow Haitian
producers and U.S. buyers to use both U.S. yarns and fabrics, and yarns and
fabrics of any origin, to take advantage of duty-free benefits.
[267]
Slightly more
than one-quarter (27.4 percent) of total U.S. imports of apparel from Haiti
($254.5 million) entered under CBTPA provisions in 2018. The share entering
under CBTPA has been falling steadily since 2014, reflecting a continued shift
of U.S. apparel imports from Haiti from entering under CBTPA provisions to entering
under the HOPE/HELP Acts.
[268]
This decline in the utilization of CBTPA preferences may be attributed not only
to the more flexible rules of origin offered under HOPE/HELP but also to
CBTPA’s approaching expiration on September 30, 2020, given that the HOPE/HELP
Acts do not expire until September 30, 2025. Between 2017 and 2018, the value
of U.S. imports of apparel entering under the HOPE/HELP Acts rose 11.9 percent,
from $577.0 million to $645.5 million. These imports represented nearly 70
percent of total U.S. apparel imports from Haiti, up from 67 percent in 2017
and 63 percent in 2016.
Table
2.8
U.S. general imports of
apparel from Haiti, 2016–18
Item
2016
2017
2018
Total
apparel imports from Haiti (million $)
848.5
862.1
928.1
Apparel
imports under a trade preference program (million $)
842.9
853.8
900.0
CBERA/CBTPA
(million $)
307.9
276.8
254.5
HOPE and
HELP Acts (million $)
535.0
577.0
645.5
Share of
total apparel imports from Haiti:
(Percent)
Apparel
imports under a trade preference program (%)
Note: These data reflect detailed U.S.
general import data under trade preference programs sorted by category and
published by the Office of Textiles and Apparel at the U.S. Department of
Commerce (accessed March–June 2019).
Because Haiti shares a border with the Dominican Republic on
the island of Hispaniola, Haiti’s apparel industry has been able to benefit
from the Dominican Republic’s infrastructure, including more developed port
facilities through which it can ship apparel to the United States.
[269]
Haiti also
exclusively benefits from rules that allow and encourage co-production with the
Dominican Republic.
[270]
This allows companies to rely on Haiti for the labor-intensive assembly
operations while placing capital investments such as knitting, dyeing, or
cutting machinery in the Dominican Republic, where commercial contracts are
more reliable and access to adequate financing and insurance is less of a
concern.
[271]
Several Dominican companies are major investors in industrial parks in Haiti.
[272]
Firms from
South Korea, Sri Lanka, and Taiwan have also invested in Haiti’s apparel
production and in the industrial parks that support that industry. Several
Asian-based apparel manufacturers, including Hansae and S&H Global (South
Korea), MAS Akansyel (Sri Lanka), and Everest (Taiwan), plan to expand their
manufacturing operations in Haiti and add additional sewing jobs.
[273]
Other companies have been more reluctant to make such
commitments in Haiti. Several industry representatives have commented that
uncertainty around the implementation of CBTPA and HOPE/HELP—namely, the
programs’ relatively short-term past extensions and revolving expiration
dates—has hindered long-term investments and plans for expanded sourcing in
Haiti.
[274]
In October 2018, the WTO Director-General Roberto Azevêdo
reported to an informal meeting of the Trade Negotiations Committee and WTO
heads of delegations that little progress had been made in trade negotiations
since the Eleventh WTO Ministerial Conference in December 2017. He asked
members to continue to work in all areas of negotiations, noting that only the
members themselves could drive issues forward.
[276]
Beyond multilateral trade negotiations in the WTO under the
Doha Development Agenda (DDA), the WTO Director-General highlighted increased
discussion in his consultations with members over the functioning of the
multilateral trade system itself, where some members saw distortions in trade
practices that might be checked through WTO reform or modernization efforts. He
said in his address to the full WTO membership in December 2018 that members
need to work to ease tensions and respond to systemic issues.
[277]
At the WTO General Council session in July 2018, members
agreed to hold the Twelfth WTO Ministerial Conference, June 8–11, 2020, in
Astana, Kazakhstan.
[278]
Work Programs, Decisions, Waivers, and Reviews
At the year-end meeting of the General Council, delegates
reviewed a variety of work programs, including the work programs on electronic
commerce, small economies, and Aid for Trade. They also reviewed progress on
the initiative on the development assistance aspects of cotton; reviewed the report
by the Council for Trade-Related Aspects of Intellectual Property Rights
(TRIPS) on the functioning of the compulsory licensing system for medicines;
and reviewed waivers, as described below.
Work Program on Electronic Commerce
The Chair of the General Council reported on the periodic
reviews held under the Work Program on Electronic Commerce during 2018. These
reviews discussed, in particular, the moratorium on imposing customs duties on
electronic transmissions. At the Eleventh WTO Ministerial conference held in
December 2017, members agreed to extend this moratorium for two years while
they worked toward possible future negotiations on electronic commerce
(e-commerce). They also discussed the possible establishment of a WTO
institutional structure, such as a working group, to provide a single WTO forum
to help focus future e-commerce discussions.
[279]
Separate but parallel discussions among a subset of WTO members in 2018
addressed possible future e-commerce negotiations under the Electronic Commerce
Initiative (see the “Electronic Commerce Initiative” section later in this
chapter).
Work Program on Small Economies
The Committee on Trade and Development reported on meetings
held during 2018 in keeping with its standing General Council mandate. These
included dedicated sessions held in June and November 2018, which focused on
the factors that contribute to higher trade costs faced by small and vulnerable
economies. They also discussed best practices and policy approaches to mitigate
the effect of each factor.
[280]
Aid for Trade Initiative
The WTO-led Aid for Trade initiative seeks to mobilize
resources to address the trade-related constraints identified by developing and
least-developed countries.
[281]
The Committee on Trade and Development carries out its activities under the Aid
for Trade initiative based on a two-year work program.
[282]
On May 7,
2018, the Committee agreed on its work program for Aid for Trade for the
2018–19 period.
[283]
The work program’s primary focus is the Aid for Trade Global Review in
2019––the seventh since 2007––that will review progress made in subjects such
as aid-for-trade financing for trade policy and regulation, trade development,
trade-related infrastructure, increasing productive trade capacity,
trade-related adjustment, and other trade-related needs.
[284]
Development Assistance Aspects of Cotton
On behalf of the WTO Director-General, the Deputy DG
reported to the General Council on the development assistance aspects of
cotton, as called for originally under the 2004 Doha Work Program
[285]
and reinforced
subsequently by decisions taken at the ministerial conferences held in 2013 and
2015.
[286]
In particular, he reported on progress made under the so-called Cotton
Initiative that looks to better coordinate trade negotiations affecting cotton,
such as domestic support and export subsidy programs in developed countries,
with the development aspects of cotton. Examples of the latter include
cotton-specific assistance channeled by the international development community
to the less developed cotton producers through bilateral, multilateral, and
regional efforts.
[287]
In addition to increases in active cotton-specific development assistance in
2018, the Deputy DG reported that discussions and work taking place under the
Director-General’s Consultative Framework Mechanism on Cotton have become more
“methodical.”
[288]
Annual Review of the TRIPS Special Compulsory Licensing System
The General Council noted in the annual report of the TRIPS
Council
[289]
covering the Special Compulsory Licensing System, an amendment to the WTO TRIPS
Agreement that entered into force on January 23, 2017.
[290]
The amendment
grew out of a 2005 decision by WTO members to waive a particular restriction on
compulsory licensing found in the TRIPS Agreement. Under TRIPS, typically a
member country that produces generic medicines under compulsory licenses must
sell those medicines only into its own domestic market. The amendment allows
generic versions of patented medicines to be produced under compulsory licenses
exclusively for export to countries that cannot manufacture the needed
medicines themselves.
[291]
All WTO members are eligible to import medicines under this additional
compulsory licensing mechanism, although industrial countries have elected not
to use it for imports.
[292]
The waiver aims to help developing and least-developed countries import needed
medicines when faced with public health problems, even if they obtain the
medicines from suppliers in another country producing under compulsory licenses.
[293]
Review of Waivers under Article IX:4 of the WTO Agreement
In 2018, the General Council adopted four draft decisions
that introduced a number of changes, made respectively in the Harmonized
System’s 2002, 2007, 2012, and 2017 versions, into the WTO Schedule of Tariff
Concessions.
[294]
The council also conducted its annual review of waivers under Article IX:4 of
the WTO Agreement, including waivers granted to the United States for the
Caribbean Basin Economic Recovery Act (through December 31, 2019), African
Growth and Opportunity Act (through September 30, 2025), Former U.S. Trust
Territory of the Pacific Islands (through December 31, 2026), and trade
preferences granted to Nepal (through December 31, 2025).
[295]
Under the
terms of the waivers, the United States is required to submit an annual report
to the General Council covering trade under these programs in the previous
year.
[296]
These waivers allow the United States to continue to provide preferential trade
access to the above partner economies.
WTO Membership
In 2018, WTO membership remained at 164.
[297]
In addition,
the WTO counted 23 observer governments, as well as numerous observer
institutions. According to the WTO Director-General, 22 of the 23 observer
governments were at some stage in the process of WTO accession at yearend 2018.
[298]
Of these 22
governments, USTR considered 11 to be engaged
[299]
in the
accession process during the year, while the remaining 11 either were dormant
[300]
or had not yet
begun the process
[301]
during 2018.
[302]
The WTO Agreement on Trade Facilitation (TFA) aims to
expedite the movement, clearance, and release of goods, including goods in
transit. It sets out measures for cooperation on trade facilitation and customs
compliance issues between customs authorities and other appropriate
authorities. In addition, the agreement contains provisions for technical
assistance and capacity building to facilitate trade.
[303]
The TFA
entered in force on February 22, 2017, after it was ratified by the necessary
two-thirds of the WTO membership.
[304]
The Committee on Trade Facilitation, established as part of the agreement, held
its first session May 16, 2017. The committee receives updates on ratifications
and notifications under the TFA, as well as on activities of the WTO Trade Facilitation
Agreement Facility.
[305]
The Committee on Trade Facilitation held four sessions in
2018. Committee discussions during the year focused on notifications,
administration, and implementation of the agreement. Members also exchanged
experiences on how national committees address trade facilitation, transit, and
other topics; possible regional approaches to trade facilitation; and subjects
such as authorized economic operators, use of a single customs window, and
advanced customs rulings.
[306]
By November 30, 2018, 140 countries had ratified the TFA,
representing over 85 percent of WTO membership.
[307]
Near yearend
2018, submission of category A, B, and C notifications also rose to 114, 71,
and 60, respectively.
[308]
The Agreement on Trade in Civil Aircraft entered into force
on January 1, 1980 as part of the Uruguay Round agreements. During the process
of establishing the WTO in 1995, the Agreement on Trade in Civil Aircraft was
one of two plurilateral agreements carried out that committed signatories to
core disciplines applicable only to those parties signing the agreement.
[310]
In 2018, there
were 32 signatories to the Agreement on Trade in Civil Aircraft, of which 20
European Union (EU) member states are signatory governments in their own right.
The agreement eliminates import duties on all civil (i.e., nonmilitary)
aircraft, as well as on other related products covered by the agreement.
Examples of covered products are civil aircraft engines and their parts and
components; components and sub-assemblies of civil aircraft; and flight
simulators and their parts and components.
[311]
In 2018, the WTO Committee on Trade in Civil Aircraft held an informal meeting
in March, as well as a formal meeting in October where signatory countries
adopted the annual report for 2018.
[312]
The Committee continued to discuss whether and how to update the tariff
classifications of the list of products covered by the agreement.
[313]
The initial Agreement on Government Procurement (GPA) was
signed in 1994 as a plurilateral agreement under the WTO, administered by the
WTO Committee on Government Procurement. The initial agreement had 19 parties,
including the United States.
[315]
The agreement aims to open bidding to all suppliers from GPA parties on
government procurement contracts covering goods, services, and construction
services.
Once the agreement came into effect, the parties opened
negotiations to improve its provisions, leading to the Revised Agreement on
Government Procurement in 2012. Signed by the initial 19 parties,
[316]
the new
agreement covered 47 WTO members overall.
[317]
On October 17, 2018, the parties approved the accession of Australia to the
GPA. Australia would officially become a party to the GPA 30 days after
submitting its formal instrument of accession to the WTO Director-General.
[318]
At the
November 27, 2018, meeting of the committee, the parties approved in principle
the final market-access offer by the United Kingdom in its own right in
preparation for Brexit. The offer was intended to replicate the EU’s current
GPA schedule of commitments that the UK accepts as a member state of the
European Union.
[319]
Expansion of the Information Technology Agreement
The Information Technology Agreement (ITA)
[320]
is a
plurilateral agreement that eliminates tariffs on certain information and
communications technology products, such as computers, telecommunication
equipment, semiconductors, semiconductor manufacturing and testing equipment,
software, and scientific instruments, as well as most of the parts and
accessories for these products.
[321]
It was concluded by 29 participants at the December 1996 Singapore Ministerial
Conference.
[322]
In 2018, no new members signed onto the ITA, which now totals 53 participants
(accounting for 82 WTO members), including the United States.
[323]
In June 2012, a subset of ITA participants initiated talks
to expand product coverage under the ITA, given advances made in information
technology products since the original ITA was signed.
[324]
By July 2015,
following 17 rounds of negotiations, participants agreed to eliminate tariffs
on an additional 201 products.
[325]
New products covered by the ITA expansion include new-generation
semiconductors, semiconductor manufacturing equipment, optical lenses, Global
Positioning System (GPS) navigation equipment, and medical equipment such as
magnetic resonance imaging products and ultrasonic scanning apparatus. To date,
more than 50 WTO members, accounting for about 90 percent of world trade in
products covered under the expansion, have confirmed their acceptance of tariff
concessions.
[326]
WTO members that participated in the negotiations to expand
the ITA implemented their third set of tariff reductions on July 1, 2018.
[327]
The Committee
of Participants on the Expansion of Trade in Information Technology Products
met twice in 2018. These meetings focused on two implementation issues
concerning India and China.
[328]
In addition, under the work program on nontariff measures, an informal group of
15 members focused on conformity assessment procedures linked to test results,
e-labeling, and transparency.
[329]
This section covers negotiations on fisheries subsidies and
exploratory talks on electronic commerce, which were active during 2018. There
have been no new developments in the negotiations on an environmental goods
agreement since 2016.
[330]
Negotiations on an Agreement on Fisheries Subsidies
[331]
WTO negotiations on fisheries subsidies were initially
launched in November 2001 at the Fourth WTO Ministerial Conference in Doha,
Qatar, and further elaborated in December 2005 at the Sixth Ministerial
Conference in Hong Kong, China. The aim of these negotiations was to improve
WTO disciplines on fisheries subsidies; in 2005, it was expanded to include
work toward prohibiting certain forms of fisheries subsidies that contribute to
overfishing and overcapacity.
In September 2015, world leaders adopted the United Nations’
Sustainable Development Goals (SDGs), and in doing so gave renewed impetus to
the WTO fisheries negotiations. In particular, SDG target 14.6 sets a target
date of 2020 for eliminating subsidies that contribute to illegal, unreported,
and unregulated (IUU) fishing, as well as prohibits certain forms of subsidies
that contribute to overcapacity and overfishing. SDG target 14.6 also includes
special and differential treatment for developing and least-developed countries
as an integral part of these negotiations.
[332]
Within the WTO Negotiating Group on Rules (Negotiating
Group), WTO members discussed proposals and exchanged views on a possible
agreement to discipline fishing subsidies in 2016 and 2017.
[333]
The chair
circulated a document––a so-called compilation matrix
[334]
––on July 28,
2017, reflecting seven proposals put forward by various negotiating groups: (1)
New Zealand, Iceland, and Pakistan; (2) the EU; (3) Indonesia; (4) the African,
Caribbean, Pacific (ACP) Group of States; (5) a Latin American group composed
of Argentina, Colombia, Costa Rica, Panama, Peru, and Uruguay; (6) the
Least-Developed Countries (LDC) Group; and (7) Norway.
[335]
The matrix
organized the seven proposals into the following six categories: (1) general
provisions; (2) prohibitions; (3) standstill;
[336]
(4) special
and differential treatment, and technical assistance and capacity building; (5)
transparency; and (6) transitional provisions and institutional arrangements/review.
[337]
Based on the
compilation matrix, the Negotiating Group on Rules produced a working document
that compiled definitions, scope, prohibited subsidies, and exceptions into a
single document.
[338]
In the December 2017 Ministerial Decision on fisheries subsidies,
[339]
members agreed
to continue negotiating a fisheries agreement with a view to adoption by the
Ministerial Conference in 2019. In early 2018 members discussed how to organize
work on fisheries subsidies,
[340]
with the Negotiating Group opening consultations on March 28, 2018.
[341]
Members agreed
on a May–July 2018 work program to include the following sets or clusters of
meetings: May 14–17, to address subsidies that contribute to overcapacity and
overfishing; June 11–14, to discuss fishing subsidies that affect overfished
stocks; and July 23–25, to focus on subsidies that relate to IUU fishing, with
all three clusters of meetings addressing aspects of special and differential
treatment.
[342]
The Negotiating Group developed its September–December 2018
work program to support more substantive talks aimed toward actual
negotiations.
[343]
Under the work program, specific topics would be assigned to four so-called
Incubator Groups that would meet just before the Negotiating Group’s cluster
meetings so as to better inform its discussions. Eighteen topics were developed
at the outset of this work program for incubator groups to address. Examples
include how to identify harmful subsidy effects on fish stocks and fishing
capacity; approaches to “positive” or “nonharmful” subsidies; how to define and
determine IUU fishing and overfished stocks; how to distinguish between
capacity and overcapacity, and fishing activity from overfishing; aspects of
fisheries management, such as regional fisheries management organizations
(RFMOs); the applicability of any disciplines established to at-sea activities,
on-shore activities, and fishing in high seas areas not under management by an
RFMO; the role of outside expertise in developing fisheries disciplines; and
overall transparency provisions.
[344]
Members opened their September–December 2018 work program on
September 17, 2018, with Incubator Group sessions, followed by the Negotiating
Group’s first cluster of meetings September 24–28.
[345]
The next set
of meetings started October 30 with Incubator Group meetings, followed by the
Negotiating Group’s second cluster of meetings November 5–9, 2018.
[346]
A third set
took place with Incubator Group sessions starting November 27, followed by the
Negotiating Group’s third cluster of meetings December 3–7, 2018.
[347]
During the
December 3–7 meetings, the Negotiating Group on Rules agreed to intensify talks
on fisheries subsidies in 2019,
[348]
and set its January–July 2019 work program.
[349]
The group was expected to move from discussions of the 2018 proposals into
negotiations on a consolidated draft text by early 2019.
[350]
Electronic Commerce Initiative
The Joint Statement on Electronic Commerce of December 13,
2017, released at the Eleventh WTO Ministerial conference in Buenos Aires,
Argentina, set out a focus on addressing electronic commerce and digital trade.
Discussions were to run in parallel with the WTO Work Program on Electronic
Commerce.
[351]
In the statement, like-minded WTO members committed to
initiate exploratory work as a group in early 2018 aimed at preparing for future
WTO negotiations on trade-related aspects of electronic commerce. The group
noted that a primary goal was to take better advantage of the opportunities
presented by e-commerce, while also recognizing the role played by the WTO in
promoting open, transparent, nondiscriminatory, and predictable regulatory
environments to facilitate e-commerce.
During 2018, these WTO Meetings for Exploratory Work on
Electronic Commerce occurred nearly monthly, for a total of nine meetings for
the year. In these meetings, roughly 80 WTO members exchanged ideas and
proposals aimed at opening negotiations on trade-related aspects of e-commerce.
Discussions focused on a set of four themes expected to provide the basis for
eventual negotiations: (1) enabling digital trade/e-commerce; (2) openness and
digital trade/e-commerce; (3) trust and digital trade/e-commerce; and (4) other
crosscutting issues.
[352]
This section gives an overview of the WTO dispute settlement
process, as well as information about proceedings during calendar year 2018,
particularly those in which the United States was a complaining or responding
party. More specifically, it provides (1) a tally of new requests for
consultations filed by WTO members during calendar year 2018 under the WTO
Dispute Settlement Understanding (DSU); (2) a table that lists the new dispute
settlement panels established during calendar year 2018 in which the United
States was either the complaining party or the named respondent; and (3) short
summaries of the procedural and substantive issues in disputes involving the
United States that moved to the panel stage during 2018, as well as summaries
of panel and Appellate Body reports issued during 2018 in disputes that
involved the United States. At the end of this section, U.S. concerns with the
WTO dispute settlement process are described.
Figure 3.1 provides a timeline for the WTO dispute
settlement process prepared by the WTO. The references in the timeline are to
articles in the WTO Dispute Settlement Understanding.
Figure
3.1
Timeline for a typical WTO dispute settlement process
This section’s summaries of issues and of findings and
recommendations in panel and Appellate Body reports are based entirely on
information in publicly available documents. Sources include summaries
published online by the WTO, summaries included in USTR’s
2019 Trade Policy
Agenda and 2018 Annual Report
, and summaries included in USTR press
releases. The summaries in this report should not be regarded as comprehensive
or as reflecting a U.S. government or Commission interpretation of the issues
raised or addressed in the disputes or in panel or Appellate Body reports. A
table showing procedural developments during 2018 in disputes in which the
United States was the complainant or respondent appears in appendix table A.25.
This section focuses on developments during 2018, including
panel and Appellate Body reports issued during 2018 and adopted by the Dispute
Settlement Body (DSB). With minor exceptions, panel and Appellate Body reports
and DSB actions after the close of 2018 will be summarized in the Commission’s
report covering 2019.
[353]
A number of disputes filed before 2018 remained inactive throughout 2018,
either at the consultation stage or with a panel established but not composed.
With minor exceptions, this report will not discuss those disputes.
[354]
Finally, this section focuses only on developments through
the panel and Appellate Body stage and does not include matters that arose
after the DSB adopted panel or Appellate Body reports in the original dispute.
As indicated in the flowchart in figure 3.1, dispute litigation often continues
beyond the adoption of the panel or Appellate Body report, particularly when
the defending party is the “losing” party. Issues may arise about the
reasonableness of the time sought by the losing party to implement findings and
recommendations, the adequacy of actions taken by that party to comply with the
findings and recommendations, and possible compensation and retaliation.
Matters may be referred to the original panel or to a new panel for further
findings and recommendations on compliance and other matters, and when
appropriate, the parties may seek the help of an arbitrator to resolve matters.
Appendix table A.25 sets out the timeline for procedural
actions in specific active WTO dispute settlement cases, including procedural
actions at the implementation, compliance, and compensation/retaliation stages.
A number of disputes were still active or were finally resolved during 2018,
well after the DSB adopted the panel and/or Appellate Body report in the original
dispute. One example is a dispute brought by the United States in 2004 against
the EU on measures affecting trade in large civil aircraft. The Appellate Body
issued a report on this dispute on May 15, 2018, in ongoing compliance
proceedings, confirming that the EU and certain EU member states had failed to
comply with the earlier WTO determination that found “launch aid”—subsidies
from several EU countries to Airbus—to be inconsistent with their WTO
obligations. On July 13, 2018, at the request of the United States, arbitration
proceedings about the level of countermeasures (suspended in January 2012) to
be applied were resumed, with a decision expected in 2019.
[355]
In another
dispute dating back to 2008, the Appellate Body issued a report in December
2018 on compliance proceedings, bringing to a close a dispute about the U.S. dolphin-safe
labeling measure affecting the importation, marketing, and sale of tuna and
tuna products.
[356]
During 2018, WTO members filed 39 new requests for dispute
settlement consultations. This number was significantly higher than the average
for the five preceding years and more than double the 17 filed in 2017.
Requests filed by three members—the United States (8 requests), China (5), and
South Korea (3)—accounted for slightly over 40 percent of the requests filed
during 2018. The United States was the named respondent in nearly half the
disputes filed during 2018 (in 19 of 39 complaints). China was a distant
second, as the named respondent in four disputes. Nearly half the complaints
(9) filed against the United States concerned U.S. national security tariffs on
steel and aluminum products, and two-thirds of the complaints filed by the
United States concerned measures taken by other WTO members in response to the
U.S. steel and aluminum tariffs. The issues presented in these disputes are
described below. The 39 new requests included 25 different named WTO members,
either as a complainant or named respondent or in both capacities.
[357]
As of the end of 2018, seven of the eight disputes filed by
the United States during 2018 were at the panel stage, with the panel composed
in one of those disputes. The eighth was still at the consultation stage.
[358]
As of the end
of 2018, 14 of the 19 disputes filed against the United States during 2018 had
advanced to the panel stage, including two in which a panel had also been
composed. The remaining five disputes were still in the consultation phase.
Four of the disputes, two filed by the United States against Canada and Mexico,
respectively, and one each filed by Canada and Mexico against the United
States, were terminated in May 2019 after the parties reached a mutually agreed
solution.
Disputes Filed by the United States
In DS541, filed in March 14, 2018, the United States requested
consultations with India concerning certain alleged export subsidy measures.
The United States claimed that the measures appear to be inconsistent with
Articles 3.1(a) and 3.2 of the Agreement on Subsidies and Countervailing
Measures (SCM Agreement). When consultations failed to resolve the dispute, the
United States requested the DSB to establish a panel. The DSB established a
panel on March 14, 2018, and the Director-General composed the panel on July
23, 2018. On December 3, 2018, the chair of the panel informed the DSB that the
panel’s work had been delayed due to lack of available resources in the
Secretariat, and that the panel did not expect to issue its final report to the
parties before the second quarter of 2019.
[359]
In the dispute the United States challenged several Indian export subsidy
programs: (1) the Export Oriented Units Scheme and sector-specific schemes,
including Electronics Hardware Technology Parks Scheme; (2) the Merchandise
Exports from India Scheme; (3) the Export Promotion Capital Goods Scheme; (4)
Special Economic Zones; and (5) a duty-free imports for exporters program.
[360]
The U.S. Trade Representative filed dispute DS542 after
having determined, under section 301(b) of the Trade Act of 1974, that certain
acts, policies, and practices by China in the form of certain specific aspects
of China’s technology regulations are unreasonable or discriminatory and burden
or restrict U.S. commerce.
[361]
The United States requested consultations with China on March 23, 2018,
concerning certain measures pertaining to the protection of intellectual
property rights. The United States claimed that China’s measures appear to be
inconsistent with Articles 3, 28.1(a) and (b), and 28.2 of the TRIPS Agreement.
After consultations failed to resolve the matter, the United States asked the
DSB to establish a panel, and the DSB did so on November 21, 2018. The
Director-General composed the panel on January 16, 2019.
[362]
In a press
release issued at the time the United States filed the dispute, the Trade
Representative stated that China appears to be breaking WTO rules “by denying
foreign patent holders, including U.S. companies, basic patent rights to stop a
Chinese entity from using the technology after a licensing contract ends” and
“by imposing mandatory adverse contract terms that discriminate against and are
less favorable for imported foreign technology.”
[363]
The United States filed the remaining six disputes—DS557,
DS558, DS559, DS560, DS561, and DS566—in response to measures imposed by
Canada, China, the EU, Mexico, Turkey, and the Russian Federation,
respectively, challenging the tariffs each WTO member imposed in response to
U.S. actions on trade in aluminum and steel.
[364]
The United States claimed that the measures appear to be inconsistent with
Articles I:1, II:1(a) and II:1(b) of the General Agreement on Tariffs and Trade
(GATT) 1994. After consultations failed to resolve the disputes, the United
States requested the establishment of a panel in each dispute, and the DSB
established panels in DS557, DS558, DS559, and DS560 on November 21, 2018; a
panel in DS566 on December 18, 2018; and a panel in DS561 on January 28, 2019.
[365]
The United
States stated that it had imposed the tariffs under section 232 of the Trade
Expansion Act of 1962 to protect U.S. national security interests.
[366]
By agreement
of the parties, two of these disputes, DS557 and DS560, were terminated in May
2019 after the United States reached mutually agreed solutions with Canada and
Mexico, respectively.
[367]
Disputes in Which the United States Was the Named Respondent
Nine of the 19 disputes filed against the United States
concerned U.S. measures imposed by the President on certain steel and aluminum
products under his section 232 national security authority.
[368]
The
complaining parties in the nine disputes claimed (with some differences between
them) that the U.S. measures appeared to be inconsistent with certain
provisions of the Agreement on Safeguards and with Articles I, II, X, XI, and
XIX of GATT 1994. After consultations failed to resolve the disputes, the
complaining WTO members requested the establishment of separate panels to
address their individual disputes. The DSB established individual panels in
DS544, DS548, DS550, DS551, DS552, DS554, and DS564 on November 21, 2018, and
established a panel in DS547 (India) and in DS556 (Switzerland) on December 4,
2018.
[369]
As indicated above, two of those disputes, brought by Canada and Mexico,
respectively, were terminated in May 2019 as part of the mutually agreed
solution reached by the United States, Canada, and Mexico.
[370]
Three of the disputes, one by China and two by South Korea,
challenged U.S. safeguard measures imposed by the President in February 2018 on
imports of crystalline silicon photovoltaic products and large residential
washers. Each of those disputes claimed that the U.S. measures are inconsistent
with certain U.S. obligations under the Safeguard Agreement and Article XIX of
GATT 1994.
[371]
The remaining seven requests for consultations were filed by
Vietnam, South Korea, China, and Venezuela.
Two
of the requests related to U.S. countervailing duty and antidumping measures.
First, in DS536, Vietnam requested consultations with the United States
concerning certain antidumping measures on fish fillets from Vietnam and other
U.S. legal instruments. Vietnam claimed that the measures appear to be
inconsistent with certain provisions in Articles 1, 2, 6, 9, 11, and 17 and
Annex II of the Antidumping Agreement; with Articles I, VI, and X of GATT 1994;
with Articles 3, 19, and 21 of DSU; with Article XVI:4 of the WTO Agreement;
and with Vietnam’s Protocol of Accession. After consultations failed to resolve
the dispute, Vietnam requested establishment of a panel. The DSB established a
panel on July 20, 2018, and the Director-General composed the panel on November
30, 2018.
[372]
In DS539, South Korea requested consultations with the
United States about certain antidumping and countervailing duty measures
imposed on products from South Korea, and certain laws, regulations, and other
measures maintained by the United States with respect to the use of facts
available in antidumping and countervailing duty proceedings. South Korea
claimed that the measures appear to be inconsistent with certain provisions in
Articles 1, 2, 3, 5, 6, 9, 11, and 18 and in Annexes I and II of the Antidumping
Agreement; with Articles 1, 10, 11, 12, 14, 15 19, 21, and 32 and Annex VI of
the SCM Agreement; with Article VI of GATT 1994; and with Article XVI:4 of the
Marrakesh Agreement. After consultations failed to resolve the dispute, South
Korea requested establishment of a panel. The DSB established a panel on May
28, 2018. Following agreement of the parties, the panel was composed on
December 5, 2018.
[373]
The five remaining disputes concerned several different
matters. In DS540, Vietnam requested consultations concerning certain U.S.
measures affecting the importation into the United States of pangasius
[374]
seafood
products from Vietnam, purportedly because of sanitary and phytosanitary
concerns. Vietnam claimed that the measures appear to be inconsistent with Articles
I:1 and XI:1 of GATT 1994. As of the end of 2018, the dispute was still in
consultations.
[375]
In DS543, filed by China, China claimed that certain tariff measures to be
imposed on Chinese goods and implemented through sections 301–310 of the U.S.
Trade Act of 1974 appear to be inconsistent with Articles 1:1 and II:1(a) and
(b) of GATT 1994 and Article 23 of the DSU. After consultations failed to
resolve the dispute, China requested the establishment of a panel.
[376]
In DS563, China requested consultations with the United
States concerning certain measures allegedly adopted and maintained by the
governments of certain U.S. states and municipalities relating to alleged
subsidies or domestic content requirements in the energy sector. China claimed
the measures appear to be inconsistent with Articles 3.1(b) and 3.2 of the SCM
Agreement, Articles 2.1 and 2.2 of the Agreement on Trade-Related Investment
Measures (TRIMS Agreement), and Article III:4 of GATT 1994. The dispute was
still in consultations at the end of 2018.
[377]
Dispute DS565, also filed by China, concerned U.S. tariff measures on certain
goods from China imposed in response to USTR’s section 301 investigation. China
claimed that the measures appear to be inconsistent with certain provisions in
Articles I and II of GATT 1994 and Article 23 of DSU. The dispute was still in
consultations at the end of 2018.
[378]
Finally, DS574, which was filed by Venezuela, concerned
measures imposed by the United States related to goods of Venezuelan origin,
imports of gold from Venezuela, the liquidity of Venezuela’s public debt,
transactions in Venezuelan digital currency, and the supply and consumption of
services by certain Venezuelan nationals, specifically those on a blocked
persons list. Venezuela claimed that the measures appear to be inconsistent
with certain provisions of Articles I, II, III, V, X, XI, XIII, and XXIII of
GATT 1994 and certain articles of the General Agreement on Trade in Services
(GATS). The dispute was in consultations at the end of 2018.
[379]
As indicated in table 3.1, 23 dispute settlement panels were
established during 2018 in which the United States was either the requesting
party (complainant) or the respondent party. The United States was the
complaining party in 8 of the disputes, and the responding party in 15
disputes. All but 3 of the listed disputes (DS531,
[380]
DS533,
[381]
and DS534
[382]
) were filed
during 2018.
Table
3.1
WTO dispute settlement
panels established during 2018 in which the United States was a party
Case
no.
Complainant
Respondent
Case
name
Panel
established
DS531
United
States
Canada
Canada—Measures
Governing the Sale of Wine in Grocery Stores (second complaint)
07/20/2018
DS533
Canada
United
States
United
States—Countervailing Measures on Softwood Lumber from Canada
04/09/2018
DS534
Canada
United
States
United
States—Anti-Dumping Measures Applying Differential Pricing Methodology to
Softwood Lumber from Canada
04/09/2018
DS536
Vietnam
United
States
United
States—Anti-Dumping Measures on Fish Fillets from Viet Nam
07/20/2018
DS539
South Korea
United
States
United
States—Anti-Dumping and Countervailing Duties on Certain Products and the Use
of Facts Available
05/28/2018
DS541
United States
India
India—Export
Related Measures
05/28/2018
DS542
United
States
China
China—Certain
Measures Concerning the Protection of Intellectual Property Rights
11/21/2018
DS544
China
United
States
United
States—Certain Measures on Steel and Aluminum Products
11/21/2018
DS545
South Korea
United
States
United
States—Safeguard Measure on Imports of Crystalline Silicon Photovoltaic
Products
09/26/2018
DS546
South Korea
United
States
United
States—Safeguard Measure on Imports of Large Residential Washers
09/26/2018
DS547
India
United
States
United
States—Certain Measures on Steel and Aluminum Products
12/04/2018
DS548
European
Union
United
States
United
States—Certain Measures on Steel and Aluminum Products
11/21/2018
DS550
a
Canada
United
States
United
States—Certain Measures on Steel and Aluminum Products
11/21/2018
DS551
a
Mexico
United
States
United
States—Certain Measures on Steel and Aluminum Products
11/21/2018
DS552
Norway
United
States
United
States—Certain Measures on Steel and Aluminum Products
11/21/2018
DS554
Russian
Federation
United
States
United
States—Certain Measures on Steel and Aluminum Products
11/21/2018
DS556
Switzerland
United
States
United
States—Certain Measures on Steel and Aluminum Products
12/04/2018
DS557
a
United States
Canada
Canada—Additional
Duties on Certain Products from the United States
11/21/2018
DS558
United
States
China
China—Additional
Duties on Certain Products from the United States
11/21/2018
DS559
United
States
European
Union
European Union—Additional
Duties on Certain Products from the United States
11/21/2018
DS560
a
United
States
Mexico
Mexico—Additional
Duties on Certain Products from the United States
11/21/2018
DS564
Turkey
United
States
United
States—Certain Measures on Steel and Aluminum Products
11/21/2018
DS566
United
States
Russian
Federation
Russian
Federation—Additional Duties on Certain Products from the United States
During 2018, a WTO dispute settlement panel issued a report
in two disputes to which the United States was a party. The United States was
the named respondent in both disputes (table 3.2). This section covers only
panel and Appellate Body reports relating to the original disputes and does not
include subsequent reports, such as those of a compliance panel or an
arbitrator. Many of the latter reports are noted in table A.25, which contains
a procedural summary of most of the dispute settlement cases that are still
active in some respect.
Table
3.2
WTO dispute settlement
panel and Appellate Body (AB) reports circulated and/or adopted in 2017 in
which the United States was a party
Case
no.
Complainant
Respondent
Case
name
Date of
report circulation or adoption
DS505
Canada
United
States
United
States—Countervailing Measures on Supercalendered Paper from Canada
Reports in Which the United States Was the Respondent
United States
—
Countervailing
Measures on Supercalendered Paper from Canada (DS505)
On March 30, 2016, Canada requested consultations with the
United States to consider claims related to U.S. countervailing duties on
supercalendered paper from Canada (USDOC Investigation C-122-854). Canada
alleged that the U.S. measures at issue were inconsistent with obligations
under Articles 1.1(a)(1), 1.1(b), 2, 10, 11.1, 11.2, 11.3, 11.6, 12.1, 12.2,
12.3, 12.7, 12.8, 14, 14(d), 19.1, 19.3, 19.4, 22.3, 22.5, and 32.1 of the SCM
Agreement and under Article VI:3 of GATT 1994. After consultations failed to
resolve the dispute, Canada requested establishment of a panel, and the DSB
established a panel on July 21, 2016. On August 31, 2016, the Director-General
composed the panel.
[383]
After the panel met in March and June 2017, it circulated
its report on July 5, 2018. The panel report, among other things, upheld
Canada’s claims with respect to the treatment by the U.S. Department of
Commerce (USDOC) of subsidies that exporters refused to disclose in response to
USDOC questionnaires, but which USDOC subsequently discovered during the course
of the countervailing duty investigation.
[384]
USDOC terminated the countervailing duties on July 5, 2018.
[385]
On August 27, 2018, the United States appealed the panel’s
findings related to the treatment of undisclosed subsidies discovered during
the course of a countervailing duty investigation. As of the end of 2018, the
appellate proceedings were ongoing.
United States
—
Countervailing
Measures on Certain Pipe and Tube Products (Turkey) (DS523)
On March 8, 2017, Turkey requested consultations with the
United States concerning countervailing duty measures imposed by the United
States under four final countervailing duty determinations issued by USDOC
pertaining to certain pipe and tube products. Turkey challenged the application
of the measures in the four determinations with respect to the provision of
hot-rolled steel for less than adequate remuneration. Specifically, Turkey
challenged USDOC’s “public bodies” determination, use of facts available, and determination
of specificity of the subsidy program. Turkey also challenged USDOC’s
calculation of benchmarks, both as applied and “as such.” With respect to
injury, Turkey challenged the USITC’s “practice” of cross-cumulating imports,
as well as the application of that practice in the underlying determinations.
[386]
Turkey claimed
that the measures appear to be inconsistent with Article 1.1(a)(1), 1.1(b),
2.1(c), 2.4, 10, 12.7, 14(d), 15.3, 19.4, and 32.1 of the SCM Agreement and
with Article VI:3 of GATT 1994. After consultations failed to resolve the
dispute, Turkey requested establishment of a panel, and the DSB established a
panel on June 19, 2017. On September 14, 2017, the Director-General composed
the panel.
[387]
The panel circulated its report on December 18, 2018. With
respect to its public body determination, the panel found that USDOC acted
inconsistently with Article 1.1(a)(1) by failing to apply the standard set out
previously by the Appellate Body, and failing to establish, based on record
evidence, that the relevant entities were public bodies. With respect to
benchmarks as such, the panel rejected Turkey’s claim that USDOC has a practice
of rejecting in-country benchmarks solely based on majority or substantial
government ownership or control of the market. For benchmarks as applied, the
panel declined to make a finding under Article 14(d) of the SCM Agreement
because the relevant determination had ceased to have legal effect before the
panel’s establishment. With respect to specificity, the panel found that USDOC
acted inconsistently with Articles 2.1(c) and 2.4 of the SCM Agreement by
failing to identify and clearly substantiate the existence of a subsidy
program, and failing to take into account the extent of diversification of
Turkey’s economy and the length of time in which the program had been in place.
With respect to facts available, the panel found that USDOC acted
inconsistently with respect to Article 12.7 of the SCM Agreement by failing to
do a comparative process of reasoning and evaluation before selecting from the
facts available in certain circumstances.
In addition, with respect to injury, the panel found that
Article 15.3 of the SCM Agreement does not permit the USITC to assess
cumulatively the effects of imports not subject to countervailing duty
investigations with the effects of imports subject to countervailing duty
investigations. The panel thus found cross-cumulation by the USITC, both in the
original investigations at issue and as a practice, to be inconsistent with
Article 15.3. With respect to cross-cumulation in sunset reviews, the panel
found that USITC did not act inconsistently with Article 15.3 of the SCM
Agreement, either “as such” or in connection with the sunset review at issue.
[388]
On January 25, 2019, the United States notified the DSB of
its decision to appeal to the Appellate Body certain issues of law and legal
interpretations in the panel report. On January 30, 2019, Turkey notified the
DSB of its decision to cross-appeal.
[389]
On March 25, 2019, the Appellate Body notified the DSB that it would not be
able to circulate its report in a timely way in accordance with Article 17.5 of
the DSU.
[390]
The President’s
2018 Trade Policy Agenda and 2018 Annual
Report
issued in March 2018 set out a number of concerns about how the WTO
dispute settlement system functions, including the concern that a number of WTO
dispute settlement reports have not followed WTO rules. The report stated that
the most significant area of concern has been panels and the Appellate Body
adding to or diminishing rights and obligations under the WTO Agreement by not
applying the WTO Agreement as written, and cited a number of examples. The
report also cited additional concerns about (1) the Appellate Body’s decision
to ignore the mandatory 90-day deadline for deciding appeals; (2) service on
the Appellate Body by persons who are no longer Appellate Body members; (3) the
tendency of WTO reports to make findings unnecessary to resolve a dispute or on
issues not presented in a dispute; (4) the Appellate Body’s approach to
reviewing facts, and about
de novo
review of a WTO member’s domestic
law; and (5) claims by the Appellate Body that its reports are entitled to be
treated as precedent.
[391]
The President’s
2019 Trade Policy Agenda and 2018 Annual
Report,
issued in March 2019, restated these concerns and noted that many
WTO members share these concerns. The President’s 2019 report stated that, as a
result, “the United States was not prepared to agree to launch the process to
fill vacancies on the WTO Appellate Body without WTO Members engaging with and
addressing these critical issues.”
[392]
This chapter summarizes trade-related activities during 2018
in two major multilateral organizations—the Organisation for Economic
Co-operation and Development (OECD) and the Asia-Pacific Economic Cooperation
(APEC) forum. It also covers the activities conducted under U.S. trade and
investment framework agreements (TIFAs).
The OECD’s membership is comprised of the world’s leading
market-based economies. It provides a policy forum for member governments to
review, discuss, and find evidence-based solutions to economic, social, and
environmental challenges facing the global economy, including trade, taxation,
and macroeconomic performance and job creation.
[393]
After the
accession of Lithuania and Colombia on May 30, there were 37 OECD members in
2018.
[394]
The OECD held its Ministerial Council Meeting on May 30–31,
2018, in Paris, France. Ministers focused on ways to harness international
cooperation and better economic policies to promote human progress for better
lives.
[395]
They also discussed a number of other topics connected with the world economy,
including:
Inequalities
in economic growth between countries, as well as how to foster more inclusive
growth within countries.
[396]
How
to promote strong and inclusive economic growth through international trade and
investment.
Issues
concerning climate and the environment.
Efforts
to achieve more sustainable development goals to promote economic development
in other countries.
How
to create more effective and responsive multilateralism in international trade
engagement by promoting collaboration with key partners, regional and country
programs, and local authorities.
[398]
In 2018, the OECD Trade Committee met in March (172nd
session), April (173rd session), and October (174th session).
[399]
One focus was
on preparations for upcoming activities in multilateral bodies, such as the May
2018 OECD Ministerial Council Meeting,
[400]
the June 2018 Group of 7 Summit,
[401]
and the November–December 2018 Group of 20 (G20) Leaders’ Summit.
[402]
In addition,
the Trade Committee spent time finalizing Colombia’s bid to become an OECD
member, as announced May 30, 2018. Besides the three plenary sessions, the
Trade Committee held confidential sessions in 2018 on March 23, April 25, and
October 23.
[403]
Working Party of the Trade Committee
The Working Party of the Trade Committee held four meetings
in 2018: March 15–16, June 18–19, October 17–18, and December 11–12.
[404]
During the
year, the Working Party addressed multiple topics, notably trade in services,
digital trade, trade in raw materials, and trade and investment. For example,
for the first two categories—services and digital trade—Working Party projects
included:
Mapping
digital trade restrictions and determining market openness in digital trade by
developing a new online tool—the Digital Services Trade Restrictiveness Index (Digital
STRI)—which focuses on crosscutting impediments that hinder services traded
digitally.
[405]
Promoting
digital trade among members of the Association of Southeast Asian Nations
(ASEAN).
[406]
Looking
at how to design service-sector reforms that would produce gains and benefits
that are widely shared across the economy, by examining how the increased use,
production, and sales of services by manufacturing firms (called
“servicification”) would affect labor market dynamics.
[407]
Developing
further insights on services exported together with goods to help with the
accurate collection of statistics, to assess the relative importance of
manufacturing and services activities, and to discuss the policy implications
of servicification.
[408]
Other
Working Party projects discussed included one addressing aspects of trade and
investment—such as measuring the effects of regional trade agreements—and
another analyzing the economic impact on particular OECD countries of the
United Kingdom’s withdrawal from the European Union (“Brexit”).
[409]
The Global Forum on Steel Excess Capacity (GFSEC) was
created following calls from leaders of the G20 to address structural problems
such as global excess capacity in the steel and other industries.
[410]
On December
16, 2016, GFSEC was formally established in Berlin, Germany,
[411]
to (1)
exchange information and data on global steel capacity developments and
government policies affecting excess steel capacity; (2) develop policy
solutions and recommendations to alleviate excess capacity in the steel
industry; and (3) report on its work to the G20 ministers.
[412]
The OECD both chairs the forum and
facilitates the work produced by the GFSEC steering group.
[413]
In 2018, 33
economies participated in the forum, including several non-OECD steel-producing
economies.
[414]
The lifespan of the GFSEC was initially set at three years, but could be
extended based on the consensus of members.
In 2017, GFSEC member economies approved the so-called
Berlin Ministerial report, which contained six guiding principles. These
principles are as follows:
1.
Understanding
that steel excess capacity is a global challenge, requiring collective policy
solutions.
2.
Refraining
from market-distorting subsidies and government support measures.
3.
Fostering
a level playing field in the steel industry.
4.
Ensuring
market-based outcomes in the steel industry.
5.
Encouraging
adjustment and thereby reducing excess capacity.
6.
Ensuring
greater transparency as well as review, discussion, and assessment of the
implementation of the Global Forum policy solutions.
GFSEC member economies also drafted policy recommendations
for governments to use. For example, to address the goals of the fifth
principle, the economies recommended reducing excess capacity in the steel
sector, while governments can address the sixth principle by formulating
recommendations to continually update members‘ information on steel capacity
and policy measures.
[415]
The forum met several times in 2018, including at the second
ministerial-level GFSEC meeting, which was held in Paris, France, on September
20, 2018. At the ministerial, the forum agreed on a report, which was presented
at the G20 leaders’ summit November 30–December 1, 2018.
[416]
The report
included initial conclusions on a process to identify and remove subsidies and
other government support measures for both public and private steel producers
that could contribute or may have contributed to excess capacity in the steel
sector.
[417]
Established in 1989 and composed of 21 member economies,
[418]
Asia-Pacific
Economic Cooperation (APEC) is a regional economic and trade forum. Since its
inception, APEC has aimed to increase prosperity in the region by supporting
regional economic integration; promoting balanced, innovative, inclusive, and
sustainable growth; and facilitating easy movement of goods, services,
investment, and people across borders. APEC organizes events, including
economic leaders’ summits, ministerial meetings, senior officials’ meetings,
policy dialogues, and workshops, to discuss various trade and economic issues.
APEC decisions are made by consensus, and commitments are undertaken
voluntarily.
[419]
Every year, one of the 21 APEC member economies plays the host to APEC meetings
and serves as the APEC chair.
[420]
In 2018, Papua New Guinea served as the APEC chair and hosted major APEC
meetings for the first time since Papua New Guinea joined APEC in 1993.
APEC’s operational structure is based on both “bottom-up”
and “top-down” approaches. Four core committees, including the Committee on
Trade and Investment (CTI), provide strategic policy recommendations to APEC
economic leaders and ministers who meet annually to set the vision for
overarching goals and initiatives. The working groups under each committee are
tasked with implementing these initiatives through a variety of APEC-funded
projects. Member economies also take individual and collective actions to carry
out APEC initiatives. Capacity building is a key element of APEC’s operation,
playing an important role in helping realize APEC’s goals by providing skill
training and technological expertise to member economies.
[421]
For the Papua New Guinea meeting, APEC adopted the theme of
“Harnessing Inclusive Opportunities, Embracing the Digital Future.” The theme
was intended to recognize the importance of facilitating e-commerce and digital
trade while emphasizing the productivity and economic gains possible through
APEC collective efforts on developing the digital economy. APEC members pledged
to promote an inclusive participation of all groups in the digital economy
through capacity building, skills development, and facilitation of access to
secure digital infrastructure.
[422]
In its 2018 annual report to ministers, CTI noted that APEC
work for the year focused on supporting and improving the multilateral trading
system, reducing trade and investment barriers, improving procedures at the
border and along supply chains, and harmonizing standards and regulations to
reduce trade costs. Three of the accomplishments highlighted for the year show
progress made in these areas:
[423]
Advancing
global value chain (GVC) development and cooperation in the APEC region under
Work Stream 2:
APEC GVCs and Trade in Value Added (TiVA) Measurement
.
In 2018, under the leadership of China and the United States, the APEC TiVA
Technical Group completed the majority of the technical work required for
constructing the APEC TiVA Database. The resulting APEC TiVA deliverables will
“serve as an important tool to help better understand the impact of global
production networks on APEC economies, and to help APEC economies to develop
effective economic policies that would improve the opportunities for business
to participate in the global economy.”
[424]
Advancing
services trade in the APEC region. APEC set up nonbinding principles for
domestic regulations of services sectors; made progress toward developing an
APEC index to measure services trade restrictiveness; completed the interim
reviews of the
Environmental Services Action Plan
and the
Manufacturing-Related
Services Action Plan
; and organized two workshops, a symposium, and a
seminar on topics related to services trade, such as professional services and
e-commerce in services.
Promoting
the participation of micro, small, and medium-sized enterprises (MSMEs) in the
global economy. Efforts included several studies on MSMEs’ integration into
GVCs in services industries such as fashion design, tourism, and software
services industries; two capacity-building workshops on promoting MSMEs’
services trade and developing MSMEs’ negotiating skills; and projects
facilitating MSMEs’ effective use of intellectual property rights, such as
strategies for managing and commercializing intellectual property, and best
practices in intellectual property licensing and in the management of technology
patents.
In addition, the CTI report noted progress made in improving
trade facilitation and regulatory cooperation, among others.
Digital Trade, Internet Economy, and E-Commerce
[425]
As noted earlier, the theme selected by Papua New Guinea for
its year as host was “Harnessing Inclusive Opportunities, Embracing the Digital
Future.” Under this theme, APEC actively worked on and discussed a number of
issues related to e-commerce and digital trade in 2018:
Implementing
the
Work Plan to Identify Building Blocks to Facilitate Digital Trade for
2018
.
[426]
The work plan sought to gather more information on domestic policies, measures,
and international efforts, as well as best practices that facilitate digital
trade. It also sought to identify capacity-building needs for developing
economies to improve cross-border regulatory cooperation.
Holding
two policy dialogues on digital trade. Topics discussed at these policy
dialogues included the evolution of emerging technologies and their impact on
trade and business models; policies on data privacy and data flows; and
opportunities and challenges to business and MSMEs presented by digital trade.
Organizing
a public-private dialogue on existing and emerging issues related to e-commerce
and the digital economy, including the development of digital content, the
diffusion of new technologies, and consumer protection.
Conducting
a study on enabling the policy and regulatory environment within APEC for
data-utilizing businesses. Through case studies and interviews with firms, the
study sought to deepen understanding of leading data-utilizing business models,
ways of protecting privacy and data security, and the policy environment that
creates opportunities and enables success for data-utilizing businesses.
Delivering
several projects on economic issues related to e-commerce and digital trade,
including a workshop on enhancing regulatory infrastructure for e-commerce and
a study on e-trade measures under the framework of regional trade agreements
(RTAs) and free trade agreements (FTAs) in the APEC region.
[427]
APEC
also made significant progress in creating a policy and regulatory environment
to ensure privacy protection in the APEC region. In 2018, Singapore became the
sixth APEC economy, alongside the United States, Mexico, Canada, Japan, and
South Korea, to participate in the Cross-border Privacy Rules System, a
regional cross-border data transfer mechanism and privacy code of conduct
developed by APEC for business. Also in 2018, Singapore and the United States
became the first two APEC economies to participate in the APEC Privacy
Recognition for Processors system, a “corollary certification system for
personal information processors” designed to help personal information
processors comply with the APEC Privacy Framework 2004.
[428]
APEC continued
to implement the APEC Cross-border Privacy Enforcement Arrangement (CPEA), the
first multilateral arrangement in the APEC region enabling privacy enforcement
agents to share information and otherwise assist in cross-border data privacy
enforcement. In 2018, the Philippines and Taiwan joined nine other APEC
economies as the latest members to participate in the CPEA.
In November 2018, APEC published the
APEC’s Bogor Goals
Progress Report
, assessing the steps its 21 member economies have made
toward achieving APEC’s Bogor Goals in recent years.
[430]
These goals,
adopted in 1994, aim to create a free and open trade and investment area in the
Asia-Pacific region by reducing tariff and nontariff barriers to trade and
investment, facilitating business, and fostering economic and technical
cooperation. The report highlighted major achievements as well as areas for
improvement:
Tariffs
:
APEC has made substantial progress in tariff liberalization since its
inception, but progress has been limited in recent years. Between 2014 and
2017,
[431]
the average most-favored-nation (MFN) tariff rate in the APEC region decreased
only from 5.6 percent to 5.3 percent. The average MFN tariff rate of
agricultural products was 11.4 percent, more than twice the average for
nonagricultural products (4.4 percent).
Nontariff
measures (NTMs)
: For some time, APEC economies have been implementing
trade-facilitating NTMs, such as expedited customs procedures, the elimination
of import licensing requirements, and the application of export rebates.
Recently, however, the adoption of new trade-facilitating NTMs has slowed down
within the APEC region. On the other hand, the number of trade-restrictive NTM
measures imposed by APEC members has also fallen in recent years. At the same
time, the number of trade remedies imposed by APEC economies— particularly
antidumping measures—increased significantly during July 2016–June 2017 versus
similar periods in previous years.
Services
:
The success of APEC economies’ policies in terms of facilitating foreign
participation in domestic services sectors has been mixed. Some services
sectors have become increasingly liberalized, such as banking, transportation,
healthcare, tertiary education, and legal services. Others, such as insurance,
communications services, and electronic payment processing services, have
become more restrictive.
Investment
:
APEC economies have been carrying out a broad range of measures to upgrade the
investment environment. These range from measures that streamline the
preliminary steps of investing—easing the entry of foreign investment, relaxing
the conditions for foreign ownership, raising the thresholds for screening
potential investments, and simplifying approval procedures—to measures that
reduce restrictions on repatriating capital, profits, or royalties. Many APEC
economies also reported adopting bilateral investment agreements or regional
trade agreements/free trade agreements that included investment chapters. These
developments, too, would liberalize investment, simplify administrative
procedures, and provide legal stability. Nonetheless, investment barriers
persist in certain sectors, with policies either prohibiting foreign investment
or accepting foreign investment only under certain conditions.
The report also noted improvements in areas such as customs
procedures, intellectual property rights protections, competition policies,
government procurement, regulatory reforms, and dispute mediation, among
others.
[432]
Trade and Investment Framework Agreements (TIFAs) provide
principles for dialogue on trade and investment issues. By yearend 2018, the
United States had entered into 56 TIFAs (table 4.1), with no new TIFAs in 2018.
TIFAs cover diverse matters, including market access, labor, environment, and
intellectual property rights.
[433]
TIFA meetings serve as a setting for the United States and other parties to the
TIFA to discuss issues of mutual interest with the objective of strengthening
trade and investment ties.
[434]
The most recent TIFA negotiations were with Paraguay. Though
the U.S.-Paraguay TIFA was signed in 2017, it has not yet entered into force.
As a result, discussions on trade and investment issues between the United
States and Paraguay are channeled through the United States-Paraguay Bilateral
Council on Trade and Investment.
[435]
Table
4.1
U.S. trade and investment framework agreements
(TIFAs) in 2018
Type and name
Date signed
Bilateral
U.S.-Afghanistan TIFA
September 21, 2004
U.S.-Algeria TIFA
July 13, 2001
U.S.-Angola TIFA
May 19, 2009
U.S.-Argentina TIFA
March 23, 2016
U.S.-Armenia TIFA
November 13, 2015
U.S.-Bahrain TIFA
June 18, 2002
U.S.-Bangladesh TICFA
November 25, 2013
U.S.-Brunei Darussalam TIFA
December 16, 2002
U.S.-Burma TIFA
May 21, 2013
U.S.-Cambodia TIFA
July 14, 2006
U.S.-Egypt TIFA
July 1, 1999
U.S.-Georgia TIFA
June 20, 2007
U.S.-Ghana TIFA
February 26, 1999
U.S.-Iceland TICF
January 15, 2009
U.S.-Indonesia TIFA
July 16, 1996
U.S.-Iraq TIFA
July 11, 2005
U.S.-Kuwait TIFA
February 6, 2004
U.S.-Laos TIFA
February 17, 2016
U.S.-Lebanon TIFA
November 30, 2006
U.S.-Liberia TIFA
February 15, 2007
U.S.-Libya TIFA
December 18, 2013
U.S.-Malaysia TIFA
May 10, 2004
U.S.-Maldives TIFA
October 17, 2009
U.S.-Mauritius TIFA
September 18, 2006
U.S.-Mongolia TIFA
July 15, 2004
U.S.-Mozambique TIFA
June 21, 2005
U.S.-Nepal TIFA
April 15, 2011
U.S.-New Zealand TIFA
October 2, 1992
U.S.-Nigeria TIFA
February 16, 2000
U.S.-Oman TIFA
July 7, 2004
U.S.-Pakistan TIFA
June 25, 2003
U.S.-Paraguay TIFA
January 13, 2017
U.S.-Philippines TIFA
November 9, 1989
U.S.-Qatar TIFA
March 19, 2004
U.S.-Rwanda TIFA
June 7, 2006
U.S.-Saudi Arabia TIFA
July 31, 2003
U.S.-South Africa TIFA
a
June 18, 2012
U.S.-Sri Lanka TIFA
July 25, 2002
U.S.-Switzerland TICF
May 25, 2006
U.S.-Taiwan TIFA
September 19, 1994
U.S.-Thailand TIFA
October 23, 2002
U.S.-Tunisia TIFA
October 2, 2002
U.S.-Turkey TIFA
September 29, 1999
U.S.-Ukraine TICA
March 28, 2008
U.S.-United Arab Emirates TIFA
March 15, 2004
U.S.-Uruguay TIFA
b
January 25, 2007
U.S.-Vietnam TIFA
June 21, 2007
U.S.-Yemen TIFA
February 6, 2004
Regional
U.S.-Association of Southeast Asian
Nations (ASEAN) TIFA
c
August 5, 2006
U.S.-Caribbean Community (CARICOM)
TIFA
d
May 28, 2013
U.S.-Central Asian TIFA
e
June 1, 2004
U.S.-Common Market for Eastern and
Southern Africa (COMESA) TIFA
f
October 29, 2001
U.S.-East African Community TIFA
g
July 16, 2008
U.S.-Economic Community of West
African States (ECOWAS) TIFA
h
August 5, 2014
U.S.-Gulf Cooperation Council (GCC)
Framework Agreement for Trade, Economic, Investment, and Technical
Cooperation
i
September 25, 2012
U.S.-Southern Africa Customs Union
(SACU) Trade, Investment, and Development Cooperative Agreement
j
July 16, 2008
U.S.-West African Economic and
Monetary Union (WAEMU) TIFA
k
Note: TICF stands for Trade and
Investment Cooperation Forum, TICA stands for Trade and Investment Cooperation
Agreement, and TICFA stands for Trade and Investment Cooperation Forum
Agreement. All are considered TIFAs by USTR. For more information, see USTR, “
Trade
and Investment Framework Agreements
” (accessed May 15, 2019).
a
The United States-South Africa TIFA was amended on June 18, 2012. It replaces
the original TIFA, signed on February 18, 1999.
b
On October 2, 2008, the United States and Uruguay signed a TIFA protocol on
trade and environment and a TIFA protocol on trade facilitation.
c
The 10 countries of ASEAN are Brunei, Burma, Cambodia, Indonesia, Laos,
Malaysia, the Philippines, Singapore, Thailand, and Vietnam.
d
The 15 members of CARICOM are Antigua and Barbuda, The Bahamas, Barbados,
Belize, Dominica, Grenada, Guyana, Haiti, Jamaica, Montserrat, Saint Lucia,
Saint Kitts and Nevis, Saint Vincent and the Grenadines, Suriname, and Trinidad
and Tobago. It also has five associate members: Anguilla, Bermuda, the British
Virgin Islands, the Cayman Islands, and the Turks and Caicos Islands.
e
The six parties to the U.S.-Central Asian TIFA are the United States,
Kazakhstan, Kyrgyzstan, Tajikistan, Turkmenistan, and Uzbekistan.
f
The 21 members of COMESA are Burundi, Comoros, the Democratic Republic of the
Congo, Djibouti, Egypt, Eritrea, Eswatini (formerly Swaziland), Ethiopia,
Kenya, Libya, Madagascar, Malawi, Mauritius, Rwanda, Seychelles, Sudan,
Somalia, Tunisia, Uganda, Zambia, and Zimbabwe.
g
The six parties to the U.S.-East African Community TIFA are the United States,
Burundi, Kenya, Rwanda, Tanzania, and Uganda.
h
The 15 members of ECOWAS are Benin, Burkina Faso, Cabo Verde, Côte d’Ivoire,
The Gambia, Ghana, Guinea, Guinea-Bissau, Liberia, Mali, Niger, Nigeria,
Senegal, Sierra Leone, and Togo.
i
The six parties to the U.S.-Gulf Cooperation Council (GCC) Framework Agreement
for Trade, Economic, Investment, and Technical Cooperation are Bahrain, Kuwait,
Oman, Qatar, Saudi Arabia, and the United Arab Emirates.
j
The five members of SACU are Botswana, Eswatini (formerly Swaziland), Lesotho,
Namibia, and South Africa.
k
The eight members of WAEMU are Benin, Burkina Faso, Côte d’Ivoire,
Guinea-Bissau, Mali, Niger, Senegal, and Togo.
During 2018, 11 TIFA councils met, with results as discussed
in this section.
Algeria
On October 2, 2018, the United States and Algeria held their
sixth TIFA Council meeting in Washington, DC. They discussed trade and
investment issues in various sectors—tourism, energy, health, handcrafts, and
agriculture. The countries also discussed issues related to the digital
economy, intellectual property rights, and modernization of the Algerian
banking sector.
[436]
Argentina
Under their TIFA, the United States and Argentina met in
Washington, DC, on October 19, 2018. During the meeting, the countries
discussed various issues, including agricultural market access, the need to
reduce steel excess capacity, intellectual property rights protection, and
continued cooperation on the World Trade Organization (WTO) initiative on
electronic commerce.
[437]
Armenia
On March 19, 2018, the United States and Armenia met in
Washington, DC, for their second TIFA council meeting. Senior government
officials discussed a range of topics, including procedures for implementing
technical standards, conformity assessment, and stakeholder consultation, as
well as sanitary and phytosanitary measures, customs clearance, intellectual
property rights, and processes for monitoring and enforcing labor laws. In
addition, the meeting included a roundtable discussion with private sector
members.
[438]
Bangladesh
Under their Trade and Investment Cooperation Forum
Agreement, the United States and Bangladesh met in Washington, DC, on September
13, 2018, to discuss expansion of their bilateral trade and investment
relationship. Topics of discussion included market access for U.S. cotton, the
digital economy, labor reforms, and transparency in government procurement.
During the 2018 meeting, the United States articulated
uneasiness on the country’s labor conditions. In 2013, Bangladesh was suspended
from the Generalized System of Preferences (GSP) program owing to issues with
workers’ rights and safety.
[439]
Although USTR recognized some progress on these issues during Bangladesh’s GSP
review in 2015, Bangladesh’s GSP eligibility has not been reinstated, given
that further progress is needed in these areas.
[440]
Central Asia
On October 16, 2018, the United States, Kazakhstan,
Kyrgyzstan, Tajikistan, Turkmenistan, and Uzbekistan met in Tashkent,
Uzbekistan, for the U.S.-Central Asia TIFA Council meeting. The Afghan and
Pakistani governments joined the meeting as observers.
[441]
Two previously
launched working groups, on intellectual property and women’s economic
empowerment, held their first meetings in 2018. Countries discussed trade and
investment issues including regional connectivity, economic cooperation,
customs issues, sanitary and phytosanitary measures, standards and technical
barriers to trade, and workers’ rights.
[442]
Indonesia
The United States and Indonesia met under their TIFA in
Jakarta, Indonesia, on May 14, 2018. The countries met with the goal of
building a stronger trade relationship and promoting free bilateral trade.
During the meeting, senior officials discussed recent updates on the GSP
country practice review for Indonesia, and agreed to work together to address
issues of agriculture, digital trade, financial services, fisheries, and labor.
[443]
In addition,
the countries approved a work plan to address intellectual property concerns
with respect to Indonesia’s citation in USTR’s
2018 Special 301 Report
.
The Special 301 report addressed various issues, including patent law in
relation to local manufacturing and use requirements, and compulsory licenses.
[444]
Laos
On January 31, 2019, the United States and Laos held the
second meeting under their TIFA in Vientiane, Laos. The countries discussed
strengthening opportunities in various areas, including electronic payments,
automotive standards, digital trade, and intellectual property.
[445]
Nepal
On November 13, 2018, the United States and Nepal held their
fourth TIFA Council meeting in Washington, DC, to strengthen trade and
investment relations. Both countries discussed a range of topics, including
business environment and labor reforms, investment promotion, execution of the
WTO Trade Facilitation Agreement, digital trade and e-commerce, sanitary and
phytosanitary measures, and market access and reform in Nepal’s agricultural
sector. The countries also addressed methods of creating and improving
innovation in the business environment by increasing intellectual property
protection and facilitating foreign investment. Nepal also cited its interest
in increasing its utilization of the Nepal Trade Preferences Act, which allows
certain products from Nepal to be imported duty free into the United States.
[446]
New Zealand
During July 19–20, 2018, the United States and New Zealand
met under their TIFA in Washington, DC. During the meetings, U.S. officials
discussed the two countries’ expanding trade and investment relations,
including cooperation on areas of mutual interest. Topics addressed included
trade barriers in third-country markets, unfair trade practices, intellectual
property, and cooperation between the United States and New Zealand at the WTO
and APEC.
[447]
Thailand
On April 10, 2018, the United States and Thailand held a
Trade and Investment Council meeting in Washington, DC. The countries discussed
ways to expand trade relations and address trade issues. Both countries
restated the importance of their relationship and cooperation on trade
expansion. Topics addressed included the U.S. trade agenda and questions
related to Thai barriers to U.S. exports, such as agriculture, customs,
intellectual property, and labor issues. Senior government officials also
addressed regional and multilateral engagements, including implementation of
the WTO Trade Facilitation Agreement and approaches to advancing the ASEAN-U.S.
Trade and Investment Framework Arrangement.
[448]
Ukraine
The United States and Ukraine met on October 23, 2018, under
their Trade and Investment Cooperation Agreement (TICA). The meeting, held in
Washington, DC, under the auspices of the U.S.-Ukraine Trade and Investment
Council, was the eighth meeting since the TICA entered into force in 2008.
During the meeting, the two countries discussed ways to expand trade in
agricultural and industrial goods, work done by working groups on technical and
sanitary and phytosanitary barriers to trade, and the new law implemented on
collective management in Ukraine. Additional topics of discussion were the
governance of electronic payment systems, the environment for refunds of
Ukraine’s value-added tax, transportation logistics, and agricultural export
controls.
[449]
This chapter summarizes developments related to U.S. free
trade agreements (FTAs) during 2018.
[450]
It describes trends in U.S. merchandise trade with FTA partners, highlights the
status of U.S. FTA negotiations during the year, and summarizes major
activities and dispute settlement developments involving the North American
Free Trade Agreement (NAFTA) and other U.S. FTAs in force during 2018.
The United States was party to 14 FTAs involving a total of
20 countries as of December 31, 2018. Starting with the most recent, the FTAs
in force during 2018 were the U.S.-Panama Trade Promotion Agreement (TPA)
(entered into force in 2012); the U.S.-Colombia TPA (2012); the U.S.-Korea FTA
(2012); the U.S.-Peru TPA (2009); the U.S.-Oman FTA (2009); a multiparty FTA
with the countries of Central America and the Dominican Republic (CAFTA-DR)
that includes the Dominican Republic, El Salvador, Guatemala, Honduras, and
Nicaragua (entered into force 2006–07) and Costa Rica (2009); the U.S.-Bahrain
FTA (2006); the U.S.-Morocco FTA (2006); the U.S.-Australia FTA (2005); the
U.S.-Chile FTA (2004); the U.S.-Singapore FTA (2004); the U.S.-Jordan FTA
(2001); NAFTA, with Canada and Mexico (1994); and the U.S.-Israel FTA (1985).
Total two-way merchandise trade between the United States
and its 20 FTA partners was $1.6 trillion in 2018, accounting for 39.1 percent
of total U.S. merchandise trade with the world.
[451]
The value of
U.S. exports to FTA partners totaled $780.3 billion, an 8.3 percent increase
from $720.3 billion in 2017; this growth exceeded the 7.6 percent increase in
total U.S. exports to the world in 2018. The value of U.S. exports to most FTA
partners increased in 2018; the exception was exports to Jordan. U.S. imports
from FTA partners were valued at $862.6 billion, also an 8.3 percent increase
from $796.6 billion in 2017. The U.S. merchandise trade deficit with all FTA
partners increased 7.9 percent to $82.4 billion in 2018 (tables 5.1–5.3).
U.S. trade with the two NAFTA countries (Canada and Mexico)
continued to contribute the most to overall U.S. trade with FTA partners. In
2018, these countries accounted for $1.2 trillion, or 74.8 percent, of total
U.S. trade with its FTA partners. From 2017 to 2018, the value of U.S. exports
to NAFTA countries rose 7.3 percent ($38.1 billion) to $563.7 billion. U.S.
imports from NAFTA countries rose 8.4 percent ($51.4 billion), to $664.9
billion in 2018. As a result, the U.S. merchandise trade deficit with its NAFTA
partners increased by 15.1 percent to $101.2 billion in 2018.
U.S. trade with its non-NAFTA FTA partners was valued at
$414.2 billion in 2018, which was a 9.6 percent increase from 2017. U.S.
exports to these FTA partners increased 11.2 percent ($21.8 billion), from
$194.7 billion in 2017 to $216.5 billion in 2018. At the same time, U.S.
imports from these partners increased 8.0 percent ($14.6 billion) from $183.1
billion in 2017 to $197.7 billion in 2018. U.S. exports increased more than
imports, causing the U.S. merchandise trade surplus with its non-NAFTA FTA
partners to increase 62.1 percent to $18.8 billion (tables 5.1–5.3).
Table
5.1
Total U.S. exports to FTA
partners, by FTA partner, 2016–18
FTA partner
2016
2017
2018
2017–18
Million $
% change
NAFTA
496,786
525,580
563,729
7.3
Canada
266,734
282,265
298,719
5.8
Mexico
230,051
243,314
265,010
8.9
Non-NAFTA
179,249
194,734
216,546
11.2
Israel
13,198
12,550
13,715
9.3
Jordan
1,459
1,921
1,606
-16.4
Chile
12,937
13,605
15,340
12.8
Singapore
26,832
29,806
33,141
11.2
Australia
22,149
24,527
25,306
3.2
Morocco
1,933
2,220
2,945
32.7
Bahrain
900
898
2,037
126.7
CAFTA-DR
a
28,682
30,619
32,175
5.1
Oman
1,804
1,985
2,421
22.0
Peru
7,927
8,663
9,634
11.2
South Korea
42,313
48,326
56,344
16.6
Colombia
13,047
13,312
14,996
12.7
Panama
6,069
6,301
6,885
9.3
FTA partner
total
676,034
720,313
780,276
8.3
Total U.S.
exports
1,451,024
1,546,273
1,664,056
7.6
FTA partner
share of total U.S. exports (percent)
46.6
46.6
46.9
Source: USITC DataWeb/USDOC (accessed May 9, 2019).
Note: Because of rounding, figures may not add to totals shown. FTA
partners are ordered according to the date of entry into force of the
respective FTA.
a
CAFTA-DR is a multiparty FTA
that includes the Dominican Republic, El Salvador, Guatemala, Honduras,
Nicaragua, and Costa Rica.
Table
5.2
U.S. general imports from FTA partners, by FTA
partner, 2016–18
FTA partner
2016
2017
2018
2017–18
Million $
% change
NAFTA
571,685
613,542
664,938
8.4
Canada
277,766
299,280
318,414
6.4
Mexico
293,920
314,262
346,524
10.3
Non-NAFTA
176,421
183,106
197,702
8.0
Israel
22,210
21,941
21,762
-0.8
Jordan
1,555
1,687
1,814
7.5
Chile
8,797
10,551
11,366
7.7
Singapore
17,832
19,367
27,256
40.7
Australia
9,509
10,045
10,125
0.8
Morocco
1,021
1,233
1,566
27.0
Bahrain
768
996
991
-0.5
CAFTA-DR
a
23,335
23,570
25,184
6.8
Oman
1,125
1,067
1,281
20.0
Peru
6,253
7,271
7,883
8.4
South Korea
69,888
71,444
74,223
3.9
Colombia
13,717
13,491
13,789
2.2
Panama
410
442
462
4.4
FTA partner
total
748,106
796,648
862,640
8.3
Total U.S.
imports
2,187,032
2,340,768
2,541,267
8.6
FTA partner
share of total U.S. imports (percent)
34.2
34.0
33.9
Source: USITC DataWeb/USDOC (accessed May 9, 2019).
Note: Because of rounding, figures may not add to totals shown.
a
CAFTA-DR is a multiparty FTA
that includes the Dominican Republic, El Salvador, Guatemala, Honduras,
Nicaragua, and Costa Rica.
Table
5.3
U.S. merchandise trade balance with FTA partners, by
FTA partner, 2016–18
2016
2017
2018
2017–18
Million $
% change
NAFTA
-74,900
-87,962
-101,209
-15.1
Canada
-11,031
-17,014
-19,695
-15.8
Mexico
-63,869
-70,948
-81,514
-14.9
Non-NAFTA
2,828
11,628
18,844
62.1
Israel
-9,012
-9,391
-8,047
14.3
Jordan
-95
234
-207
(
b
)
Chile
4,140
3,054
3,974
30.1
Singapore
8,999
10,438
5,885
-43.6
Australia
12,640
14,482
15,181
4.8
Morocco
912
987
1,380
39.8
Bahrain
131
-98
1,046
(
b
)
CAFTA-DR
c
5,347
7,049
6,991
-0.8
Oman
679
918
1,140
24.3
Peru
1674
1,392
1,750
25.8
South Korea
-27,576
-23,117
-17,879
22.7
Colombia
-670
-179
1,207
(
b
)
Panama
5,659
5,859
6,423
9.6
FTA partner
total
-72,072
-76,334
-82,364
-7.9
Total U.S.
trade balance
-736,009
-794,495
-877,211
-10.4
Source: USITC DataWeb/USDOC (accessed May 9, 2019).
Note: Because of rounding, figures may not add to totals shown.
a
Negative percentage changes
indicate an increase in the U.S. trade deficit or a decrease in the U.S. trade
surplus. Positive percentage changes indicate a decrease in the trade deficit
or an increase in the trade surplus.
b
Not meaningful.
c
CAFTA-DR is a multiparty FTA
that includes the Dominican Republic, El Salvador, Guatemala, Honduras,
Nicaragua, and Costa Rica.
The value of U.S. imports entered under FTAs totaled $408.0
billion in 2018, accounting for nearly half (47.3 percent) of total U.S.
imports from FTA partners and for 16.1 percent of U.S. imports from the world
(tables 5.4–5.5).
[452]
The value of U.S. imports
entered under FTAs in 2018 increased $22.3 billion (5.8 percent), up from
$385.7 billion in 2017. FTA imports from Singapore grew 147.1 percent ($2.7
billion), representing the largest percentage increase. The growth was
primarily driven by large increases in imports of beverage sweeteners.
[453]
Imports under
FTAs from Panama and Oman increased by 41.5 percent ($24 million) and 28.8
percent ($202 million), respectively; however, they changed from smaller
baselines. Imports from Mexico accounted for the greatest increase in value,
rising by $17.4 billion (9.5 percent) to $200.5 billion. A large part of this
increase was due to an increase in motor vehicle imports from Mexico.
[454]
On the other
hand, imports from Canada fell by $563 million (0.4 percent). In total,
combined imports from the NAFTA partners rose 5.4 percent ($16.8 billion). The
largest decline in U.S. imports under any FTA was seen in imports from Bahrain,
largely due to a 29.5 percent drop in imports of aluminum wire.
[455]
Table
5.4
U.S. imports for
consumption that entered under FTA provisions, by FTA partner, 2016–18
FTA
partner
2016
2017
2018
2017–18
Million $
% change
NAFTA
302,373
313,049
329,876
5.4
Canada
131,358
129,936
129,373
-0.4
Mexico
171,015
183,112
200,502
9.5
Non-NAFTA
72,707
72,626
78,130
7.6
Israel
2,743
2,709
2,852
5.3
Jordan
1,356
1,487
1,610
8.3
Chile
4,702
5,952
6,412
7.7
Singapore
1,845
1,814
4,481
147.1
Australia
3,732
4,018
3,738
-7.0
Morocco
194
205
243
18.1
Bahrain
499
582
489
-15.9
CAFTA-DR
a
13,665
13,707
14,710
7.3
Oman
815
702
904
28.8
Peru
2,661
3,299
3,694
11.9
South Korea
35,055
33,085
33,186
0.3
Colombia
5,387
5,010
5,731
14.4
Panama
53
56
80
41.5
FTA partner total
375,080
385,675
408,006
5.8
Total U.S. imports for
consumption
2,172,868
2,328,313
2,551,606
9.6
Source: USITC DataWeb/USDOC (accessed May 9, 2019).
Note: Because of rounding, figures may not add to totals shown.
a
CAFTA-DR is a multiparty FTA
that includes the Dominican Republic, El Salvador, Guatemala, Honduras,
Nicaragua, and Costa Rica.
Jordan remained the partner with the highest ratio of
imports entered under an FTA to general imports, with a ratio of 88.8 percent
(table 5.5). Other countries with notably high ratios include Oman (70.6
percent), Mexico (57.9 percent), and Chile (56.4 percent). The CAFTA-DR
countries as a whole also had a high ratio of FTA imports to general imports,
at 58.4 percent. Each CAFTA-DR partner had large ratios of FTA imports to
general imports , except for Costa Rica, for which the ratio was 31.4 percent.
The partners with the smallest shares of imports entered under an FTA to general
imports were Israel (13.1 percent), Morocco (15.5 percent), and Singapore (16.4
percent). The imports from these countries often entered the United States free
of duty under normal trade relations rates (this category is equivalent to
most-favored-nation rates in other countries).
Table
5.5
Ratio of U.S. imports for consumption under FTAs to
U.S. general imports, by partner, 2016–18 (percent)
FTA
partner
2016
2017
2018
NAFTA
52.9
51.0
49.6
Canada
47.3
43.4
40.6
Mexico
58.2
58.3
57.9
Non-NAFTA
41.2
39.7
39.5
Israel
12.4
12.3
13.1
Jordan
87.2
88.1
88.8
Chile
53.4
56.4
56.4
Singapore
10.3
9.4
16.4
Australia
39.3
40.0
36.9
Morocco
19.0
16.7
15.5
Bahrain
64.9
58.4
49.4
CAFTA-DR
a
58.6
58.2
58.4
Oman
72.4
65.8
70.6
Peru
42.6
45.4
46.9
South Korea
50.2
46.3
44.7
Colombia
39.3
37.1
41.6
Panama
13.0
12.7
17.2
FTA partner total
50.1
48.4
47.3
Source: USITC DataWeb/USDOC (accessed May 9, 2019).
Note: Because of rounding, figures may not add to totals shown.
a
CAFTA-DR is a multiparty FTA
that includes the Dominican Republic, El Salvador, Guatemala, Honduras,
Nicaragua, and Costa Rica.
Since 1974, Congress has enacted Trade Promotion Authority
(TPA) legislation that defines U.S. negotiating objectives and priorities for
trade agreements and establishes consultation and notification requirements for
the President to follow throughout the negotiation process. At the end of the
negotiation and consultation process, Congress gives the agreement an up or
down vote, without amendment.
The most recent renewal of this authority is contained in
the Bipartisan Congressional Trade Priorities and Accountability Act of 2015,
which was signed into law on June 29, 2015.
[456]
The Act sets out 21 principal trade negotiating objectives, including
objectives on trade in goods, trade in services, trade in agriculture, foreign
investment, intellectual property, digital trade in goods and services and
cross-border data flows, regulatory practices, and state-owned and
state-controlled enterprises. There are also two negotiating objectives on
currency and currency manipulation.
TPA sets out a timeline addressing the role of Congress in
the FTA negotiation process. TPA procedures apply to both the negotiation of
new agreements and changes to existing agreements, such as the United
States-Mexico-Canada Agreement. Ninety days before negotiations are to begin,
the President is required to notify Congress of his intent to enter into
negotiations.
[457]
Thirty days beforehand, the President is to publish negotiating objectives.
[458]
Ninety days
before an agreement is to be signed, the President is to notify Congress of his
intent to enter into an agreement,
[459]
and 60 days before signing, the President is to publish the full text of the
agreement.
[460]
The timeline also includes timeframes for House and Senate consideration once
the implementing bill is introduced.
[461]
In connection with any proposed trade agreement, USITC is to
provide advice to the President as to the probable economic effect of
modifications of tariff and nontariff measures on industries producing like or
directly competitive articles and on consumers.
[462]
The USITC is
also required to submit a report assessing the likely impact of the agreement
on the U.S. economy as a whole and on specific industry sectors 105 days after
the trade agreement is signed.
[463]
On November 30, 2018, the President signed the United
States-Mexico-Canada Agreement. Developments during 2018 leading up to his signature
are described below. On October 16, 2018, U.S. Trade Representative (USTR)
Lighthizer notified Congress of the President’s intent to negotiate trade
agreements with the United Kingdom (UK), the European Union (EU), and Japan.
[464]
This
notification launched the congressionally mandated 90-day consultation period
under Trade Promotion Authority before the launch of negotiations.
[465]
Negotiating objectives for the UK, the EU, and Japan were
released over the December 2018–February 2019 period. In addition to these
negotiating objectives, the negotiating objectives for agreements with EU and
UK also included language on regulation and competitive safeguards on dominant
carriers to ensure fair competition in the telecommunications industry;
[466]
on the
establishment of consultative mechanisms and disciplines that address subsidy
issues;
[467]
and on commitments to trade engagement with Israel.
[468]
Negotiating
objectives for the agreement with Japan also included language on preserving
fair competition in the telecommunications industry, explicitly through
“transparent regulation and an independent regulator.”
[469]
On November 16, 2018, USTR announced a request for public
comment on a proposed U.S.-UK trade agreement. To help in the development of
its negotiating objectives, USTR specifically invited comments on relevant
barriers to trade, the economic costs of tariff removal to U.S. producers and
consumers, product-specific barriers, customs issues, and other nontariff
barriers.
[470]
After considering public comments and hearing testimony, USTR published its
negotiating objectives for a trade agreement with the UK in February 2019.
[471]
The UK cannot enter into a new trade agreement with
non-European Union (EU) countries before it exits the EU because the EU has
exclusive competence over its Common Commercial Policy, including its trade
policy.
[472]
However, discussions between the UK and the United States on strengthening
bilateral trade and investment ties were initiated in two separate forums.
The U.S.-UK Trade and Investment Working Group began meeting
in July 2017 with the objective of reaffirming and strengthening commercial
relationships between U.S. and UK businesses ahead of the UK’s exit from the
EU.
[473]
The group met on four subsequent occasions in November 2017,
[474]
March 2018,
[475]
July 2018,
[476]
and November
2018.
[477]
At these meetings, the group discussed industrial and agricultural goods,
services and investment, digital trade, intellectual property rights,
regulatory issues related to trade, and small and medium-sized enterprises
(SMEs).
[478]
The U.S.-UK SME Dialogue began meeting in March 2018 to
identify resources available from both countries to assist SMEs and to hear
from SMEs on the opportunities and challenges they experience when trading
bilaterally.
[479]
The Dialogue convened on two more occasions, in London in July 2018
[480]
and in
Washington, DC, in November 2018. Discussions focused on access to finance and
wider business support for SMEs, intellectual property protection, and the use
of e-commerce tools to promote SME exports.
[481]
On November 15, 2018, USTR announced a request for public
comment on a proposed U.S.-EU trade agreement. Written public comments on the
negotiating objectives for a trade agreement were due on December 10, 2018.
Again, to aid in the development of its negotiating objectives, USTR
specifically invited comments on relevant barriers to trade, economic costs of
tariff removal to U.S. producers and consumers, product-specific barriers,
customs issues, and other nontariff barriers. USTR also held a public hearing
on negotiating objectives for a U.S.-EU trade agreement on December 14, 2018,
hearing testimony of industry representatives from the agriculture,
biotechnology, manufacturing, and telecommunications and software sectors,
among others.
[482]
After considering public comments and hearing testimony, USTR published
negotiating objectives for a trade agreement with the EU in January 2019.
[483]
President Trump and European Commission President
Jean-Claude Juncker issued a joint statement on July 25, 2018, to announce the
formation of an Executive Working Group (EWG). Headed by the EU Commissioner
for Trade Cecilia Malmström and USTR Lighthizer, the EWG was formed to make
progress on reducing transatlantic barriers to trade. Goals of the EWG included
working to eliminate non-auto industrial tariffs and nontariff barriers, and to
increase trade in services, chemicals, pharmaceuticals, medical products, and
soybeans. As part of the activities of the EWG, the United States and EU also
agreed to strengthen cooperation on trade in energy; to launch a dialogue on
standards in order to reduce trade costs and bureaucratic obstacles; and to
address unfair trading practices via World Trade Organization (WTO) reform.
[484]
After the EWG was formed, Commissioner Malmström and USTR
Lighthizer met in Brussels on September 10, 2018, to launch formal discussions
under the group. Further meetings of the EWG at the ministerial level were held
in New York on September 25, 2018, and in Washington, DC on November 14, 2018.
Additional meetings were held at the technical level between U.S. and EU
officials, including a technical meeting on regulatory issues in Washington, DC
on October 23–26, 2018. Relevant regulatory departments and agencies of the
U.S. government and the European Commission participated in these meetings.
[485]
To implement certain elements of the July 25, 2018, joint
statement, the European Commission needs specific negotiating mandates to be
authorized by the Council of the European Union, which is composed of
government ministers from each EU member state.
[486]
In preparation
for negotiations on industrial tariffs and on product conformity assessment,
the European Commission submitted draft negotiating mandates to the Council of
the European Union for member state approval on January 18, 2019.
[487]
EU member
states must approve the proposed mandates before trade negotiations can begin.
[488]
On March 14,
2019, the European Parliament rejected a draft resolution to recommend the
opening of EU-U.S. trade negotiations on industrial tariffs and on product
conformity assessment. The rejection by Parliament is not binding, however, and
on April 15, 2019, the European Council approved mandates for the Commission to
open negotiations on elimination of tariffs for industrial goods and on
conformity assessment.
[489]
On November 15, 2018, USTR announced a request for public
comment on a proposed U.S.-Japan trade agreement. Written public comments on
the negotiating objectives for a trade agreement were due on November 26, 2018.
To help it develop its negotiating objectives, USTR specifically invited
comments on relevant barriers to trade, economic costs of tariff removal to
U.S. producers and consumers, product-specific barriers, customs issues, and
other nontariff barriers. USTR also held a public hearing on negotiating
objectives for a U.S.-Japan trade agreement on December 10, 2018, hearing
testimony of industry representatives from the agriculture, biotechnology,
manufacturing, and telecommunications and software sectors, as well as others.
[490]
Negotiations
started in April 2019.
[491]
After considering public comments and hearing testimony,
USTR published negotiating objectives for a trade agreement with Japan on
December 21, 2018.
[492]
Unlike the EU and UK negotiating objectives, one of the explicit goals of the
U.S.-Japan negotiation is improving the trade balance and reducing the
bilateral trade deficit.
[493]
USTR also identified regulatory compatibility to facilitate U.S. exports in key
goods sectors, including pharmaceuticals, medical devices, cosmetics,
information and communication technology equipment, motor vehicles, and
chemicals.
[494]
With regard to motor vehicles, USTR objectives focused specifically on
obtaining fair and more equitable trade in the motor vehicle sector, including
provisions designed to address nontariff barriers in Japan as well as to
increase production and jobs in the United States.
[495]
Also, unlike
previous trade agreement negotiations, USTR has elected to pursue negotiations
with Japan in stages.
[496]
Several discussions at the ministerial and executive level
took place in 2018 between the United States and Japan. Japanese Minister for
Economic Revitalization Toshimitsu Motegi and USTR Lighthizer engaged in
ministerial consultations on August 8–9, 2018, in Washington, DC, agreeing to
deepen bilateral economic cooperation.
[497]
President Trump and Prime Minister Abe announced that the United States and
Japan would begin negotiations for a U.S.-Japan trade agreement on September
26, 2018.
[498]
Vice
President Pence and Deputy Japanese Prime Minister Taro Aso also convened the
third meeting of the U.S.-Japan Economic Dialogue in Japan in November 2018,
where participants discussed further expanding trade and investment between
Japan and the United States.
[499]
On November 30, 2018, the United States, Mexico, and Canada
signed the United States-Mexico-Canada Agreement (USMCA) in Buenos Aires,
Argentina.
[500]
NAFTA remains in effect until each country’s legislature ratifies USMCA,
although any of the countries may withdraw from NAFTA six months after issuing
written notice to the other parties.
[501]
The United States, Mexico, and Canada signed USMCA after completing the
negotiations that began on August 16, 2017, in Washington, DC.
[502]
The two
primary goals of the negotiations were (1) to update NAFTA with modern
provisions on digital trade, intellectual property, cybersecurity, good
regulatory practices, and treatment of state-owned enterprises; and (2) to
rebalance NAFTA in a way that makes it easier to reduce the U.S. trade deficit
with Canada and Mexico.
[503]
Five negotiating rounds were completed in 2017, and in 2018,
negotiations continued with round six (table 5.6).
[504]
At the end of
round six, the chapter on corruption was completed.
[505]
USTR announced
at the end of round seven that the negotiators had closed out three additional
chapters: those on good regulatory practices, administration and publication,
and sanitary and phytosanitary (SPS) measures. Negotiators also completed work
on sectoral annexes related to chemicals and proprietary food formulas, made
substantial progress on telecommunications and technical barriers to trade, and
agreed to include a chapter on energy.
[506]
Table
5.6
Timetable of major NAFTA
negotiations and signing USMCA, 2017–18
Negotiations
Date
Country/City
First round
August
16–20, 2017
Washington,
DC
Second
round
September
1–5, 2017
Mexico City
Third round
September
23–27, 2017
Ottawa,
Canada
Fourth
round
October
11–17, 2017
Arlington,
Virginia
Fifth round
November
17–21, 2017
Mexico City
Sixth round
January
23–28, 2018
Montreal,
Canada
Seventh
round
February
25–March 5, 2018
Mexico City
Negotiations
continue: Government officials provide various updates
March 6–May
14, 2018
United
States, Mexico, and Canada
Negotiations
continue: USTR provides an update
August 3,
2018
Washington,
DC
Preliminary
agreement between the United States and Mexico
August 31,
2018
Washington,
DC
Canada and
the United States reach an agreement, alongside Mexico; the text of the agreement
is released
September
30, 2018
Washington,
DC
The United
States, Mexico, and Canada sign the USMCA
After round seven, officials from all three countries
continued to engage in negotiations. In May 2018, USTR stated that after weeks
of continuous discussions, negotiators had covered a large number of complex
issues such as intellectual property, dairy and agriculture, de minimis levels,
energy, labor, and more.
[507]
In August 2018, the United States and Mexico reached a preliminary agreement,
while negotiations with Canada continued. As a result, on August 31, 2018, the
President notified Congress of his intent to sign a trade agreement with
Mexico, and Canada if it was willing, in 90 days.
[508]
Finally, on
September 30, 2018, the United States and Canada reached an agreement, alongside
Mexico, on the United States-Mexico-Canada Agreement (USMCA).
[509]
USTR published
the full text of the agreement on the same day. The agreement was signed on
November 30, 2018.
USMCA consists of 34 chapters, 4 annexes, and 14 side
letters that address trade issues among the United States, Mexico, and Canada.
It covers trade in goods and services in areas such as rules of origin, customs
facilitation, SPS measures, technical barriers to trade, foreign investment,
intellectual property, government procurement, competition policy, and labor
and environmental standards.
[510]
In addition, USMCA includes new chapters on topics such as digital trade,
anticorruption, competitiveness, good regulatory practices, and SMEs.
[511]
The chapters
on Labor and Environment, which were covered as side agreements in NAFTA are
now incorporated into the core text of the agreement and are subject to dispute
settlement.
[512]
Highlights of the signed agreement relative to NAFTA
include:
[513]
New
rules of origin for automobiles
. Under USMCA, an automobile qualifies for
duty-free treatment only if 75 percent of the content originates in the NAFTA
region, compared to 62.5 percent under NAFTA. Additionally, at least 40 percent
of a vehicle’s content—45 percent for trucks—must be produced by workers in the
NAFTA region who earn an average of at least $16 per hour.
[514]
Modernized
SPS rules and expanded food and agriculture market access
. Under USMCA,
U.S. exports of dairy products gained broader access to Canada’s market that
NAFTA did not allow. Other agricultural products, including U.S. poultry and
egg products, also gain improved access to the Canadian market.
[515]
The USMCA
chapter on SPS measures specifies that the United States, Mexico, and Canada
agree to (1) increase transparency in developing and implementing SPS measures,
(2) make decisions based on science, and (3) work together to enhance
compatibility of SPS measures in the region.
[516]
New
protections for U.S. intellectual property
. USMCA regulations offer
strengthened protection and enforcement in the following areas: trade secrets,
regulatory data protection, patents, trademarks, geographical indications,
copyright, and internet service provider provisions.
[517]
For instance,
USMCA offers protection against trade secret misappropriation, including civil
remedies and criminal penalties.
[518]
Facilitating
digital trade and e-commerce
: USMCA, if it enters into force, would be the
first U.S. free trade agreement to include a chapter on digital trade. Key
provisions would prohibit discriminatory treatment of cross-border data
transfers and forced localization of computing facilities, as well as limit
disclosure of proprietary source code and liability for third-party content.
[519]
Stronger
labor provisions:
While labor was covered in a side agreement in NAFTA,
USMCA labor provisions are in the core text as an individual chapter and
subject to dispute settlement. USMCA requires parties to adopt and maintain
labor rights as recognized by International Labor Organization declarations. An
annex to the labor chapter commits Mexico to specific legislative actions to
enhance collective bargaining rights.
[520]
Stronger
environment provisions:
While environment was covered in a side agreement
in NAFTA, USMCA environment provisions are in the core text as an individual
chapter and subject to dispute settlement. USMCA requires parties to adopt and
maintain laws, regulations, and other measures to fulfill their obligations
under the Convention on International Trade in Endangered Species and Wild
Flora and Fauna (CITES), and prohibits parties from providing certain fishery
subsidies.
[521]
Addressing
currency manipulation
:
USMCA would be the first
U.S. free trade agreement to oblige parties
to regularly report on interventions
in the foreign exchange market, a provision subject to dispute settlement.
[522]
Limitations
on investor-state dispute settlement:
USMCA would eliminate investor-state
dispute settlement (ISDS) between the United States and Canada after a
three-year phase-out period. The existing ISDS mechanism between the United
States and Mexico would be limited to five sectors; outside these sectors,
potential claims would be restricted substantively and procedurally.
[523]
Promoting
“good regulatory practices”
: USMCA lays out general requirements for
developing and promulgating regulations, including publishing proposed
regulatory changes and providing opportunities for public comment. USMCA makes
these provisions subject to dispute settlement. Parties are encouraged to promote
regulatory compatibility and regulatory cooperation under the agreement.
[524]
The North American Free Trade Agreement (NAFTA) between the
United States, Canada, and Mexico entered into force on January 1, 1994. All of
the agreement’s provisions were implemented, as scheduled, by the three parties
by January 1, 2008, with the exception of the NAFTA cross-border trucking
provisions.
[526]
NAFTA’s central oversight body is the Free Trade Commission
(FTC), which is responsible for overseeing NAFTA’s implementation, as well as
activities under its dispute settlement provisions. The FTC itself has not
officially met since 2012.
[527]
However, since October 2012, trade ministers, senior officials, and experts
from the three member countries have met regularly to consider approaches to
expand and deepen trade and investment opportunities in North America, and
beginning in 2017, met regularly to renegotiate the agreement. As noted above,
the renegotiated agreement—USMCA—was signed on November 30, 2018. The original
NAFTA remains in effect pending final actions approving the USMCA by each of
the three countries. Per article 2205 of the agreement, any of the countries
may also withdraw from NAFTA six months after issuing written notice to the
other parties.
[528]
The following sections describe the major activities of
NAFTA’s Commission for Labor Cooperation and Commission for Environmental
Cooperation during 2018, as well as dispute settlement activities under NAFTA
Chapters 11 and 19 in that year.
The Commission for Labor Cooperation (CLC), composed of a
ministerial council and an administrative secretariat, was established under
the North American Agreement on Labor Cooperation (NAALC). The NAALC is a
supplemental agreement to NAFTA that aims to promote effective enforcement of
domestic labor laws and to foster transparency in administering them. The CLC
is responsible for implementing the NAALC.
Each NAFTA partner has a national administrative office
(NAO) within its labor ministry to act as the contact point with the other
parties, the administrative secretariat, other government agencies, and the
public.
[529]
Another NAO function is to receive and respond to public communications on
labor law matters arising in another NAALC country. The United States’ NAO is
the Office of Trade and Labor Affairs in the U.S. Department of Labor (USDOL).
Each NAO sets its own domestic procedures for reviewing and responding to
public communications. Since 2010, the NAOs have also undertaken the activities
of the secretariat, including carrying out the cooperative activities of the
CLC. These activities range from seminars and conferences to joint research
projects and technical assistance.
[530]
As of the end of 2018, there were three submissions under
review at the NAALC, the same number as last year. One with the United States’
NAO (involving Mexico),
[531]
and two with the Canadian NAO (one involving Mexico and one involving the
United States).
[532]
On December 22, 2018, Mexico’s executive branch submitted
legislation to its Congress to amend Mexico’s Federal Labor Law by implementing
constitutional reforms to the labor justice system enacted in February 2017.
One of the reforms consists of transferring the authority to adjudicate labor
disputes from the current tripartite Conciliation and Administrative Boards to
new labor courts, while transferring the registration of unions and collective
bargaining agreements to a new federal institution. The U.S. Administration is
consulting with the Mexican government about the reforms so that final
legislation improves labor standards, protects Mexican workers’ rights, and
complies with Mexico’s obligations under USMCA.
[533]
The Commission for Environmental Cooperation (CEC) was
established under Article 8 of the North American Agreement on Environmental
Cooperation (NAAEC). The NAAEC is a supplemental agreement to NAFTA that came
into force at the same time as NAFTA; it was designed to support NAFTA’s
environmental goals, which are to protect and improve the environment, support
sustainable development, and increase cooperation in reaching these goals.
[534]
The CEC was
established to support cooperation among the parties to reach these goals.
[535]
Articles 14 and 15 of NAAEC offer citizens and
nongovernmental organizations a mechanism to help enforce environmental laws in
the NAFTA countries. Article 14 governs allegations of failures to effectively
enforce environmental laws submitted for review by the CEC. It sets out
guidelines about criteria for submissions and for requesting a response from
the relevant NAFTA party regarding the submission. Article 15 outlines the CEC
Secretariat’s obligations in considering the submissions and the development of
a factual record concerning the allegations raised in the submissions.
[536]
At the end of
2018, five submissions remained active under Articles 14 and 15. Two involved
Canada, with one submitted in 2017, and the other in 2018; and three involved
Mexico, all submitted in 2018 (table 5.7).
Table
5.7
Active submissions as of
yearend 2018 under Articles 14 and 15 of the North American Agreement on
Environmental Cooperation
Name
Case
First filed
Country
a
Status
Alberta Tailings Ponds II
SEM-17-001
June 26, 2017
Canada
The Secretariat posted a
request for information relevant to the factual record on its web site.
Metrobús Reforma
SEM-18-002
b
Feb. 2, 2018
Mexico
The Secretariat informed
Council (the governing body of the CEC) that the Secretariat considers that
the submission warrants development of a factual record.
Hydraulic Fracturing in
Nuevo León
SEM-18-003
Oct. 3, 2018
Mexico
The Secretariat determined
that the submission met the criteria of Article 14(1) and requested a
response from the concerned government party in accordance with Article
14(2).
Chileno Bay Club
SEM-18-004
Nov. 9, 2018
Mexico
The Secretariat received a
response from the concerned government party and began considering whether to
recommend a factual record.
Grand-Brûlé–Saint-Sauveur
Supply Line
SEM-18-005
Dec. 7, 2018
Canada
The Secretariat determined
that the revised submission did not meet the Article 14(1) criteria and
terminated the process under guideline 6.3.
At the 25th regular session of the CEC Council on June 27,
2018, in Oklahoma City, Oklahoma, the CEC focused on “Innovation and
Partnerships for Green Growth.”
[537]
The session showed ways that partnerships among indigenous, academic, youth,
and private sectors at the federal, state, and local levels can foster
innovation, entrepreneurship, and technological advances that support
environmental protection and healthier ecosystems in North America.
[538]
In Oklahoma, the three countries’ academic, government, and
private sector partners demonstrated how scientific innovations such as radar
and computer modeling assist in monitoring the atmosphere and climate
developments. In this way, they support research, policy-making, and
preparedness efforts to address extreme events and mitigate their impacts on
human health, the environment, and economic growth and productivity.
[539]
For example,
these technologies can help the CEC track North American species migrations and
protect species and their habitats—both critical to environmental sustainability
and ecotourism.
Also at this meeting, the CEC held a public session with
experts from state governments, academia, and the private sector to address
ways to promote innovation and partnerships supporting green growth in North
America.
[540]
In addition, the Council reviewed progress to date in implementing 10
cooperative projects related to supporting legal and sustainable trade in
select North American species and improving industrial energy efficiency.
[541]
The Border Environment Cooperation Commission and the North
American Development Bank were created in 1994 under a NAFTA side agreement to
address environmental issues in the U.S.-Mexico border region. The bank’s
projects are certified by the Border Environmental Cooperation Commission. As
of December 31, 2018, the bank had contracted a total of about $3.1 billion in
loans and grants to help finance 257 projects estimated to cost a total of $9.8
billion.
[542]
The dispute settlement provisions of NAFTA—found in Chapters
11 (Investment) and 19 (Review and Dispute Settlement in
Antidumping/Countervailing Duty Matters)—cover a variety of areas.
[543]
The sections
below describe developments during 2018 in NAFTA Chapter 11 investor-state
disputes and Chapter 19 binational reviews of final determinations of
antidumping and countervailing cases. Appendix table A.26 presents an overview
of developments in NAFTA Chapter 19 dispute settlement cases to which the
United States was a party in 2018.
NAFTA Chapter 11 Dispute Settlement Developments
Chapter 11 of NAFTA includes provisions designed to protect
cross-border investors and their investments. It establishes a mechanism for
the settlement of investment disputes that seeks to assure a “minimum standard
of treatment” for investors of the parties.
[544]
An individual investor who alleges that a NAFTA country has breached its
investment obligations under Chapter 11 may pursue arbitration through
internationally recognized channels.
[545]
A key feature of the Chapter 11 arbitral provisions is the enforceability in
domestic courts of final awards made by arbitration tribunals.
[546]
In 2018, there
were six active Chapter 11 cases filed against Canada by U.S. investors,
[547]
and two filed
against Mexico by U.S. investors.
[548]
There were no cases filed against the United States.
NAFTA Chapter 19 Dispute Panel Reviews
Chapter 19 of NAFTA provides for a binational panel to
review final determinations made by national investigating authorities in
antidumping and countervailing duty cases.
[549]
Such a panel serves as an alternative to judicial review by domestic courts and
may be established at the request of any involved NAFTA country.
[550]
At the end of
2018, the NAFTA Secretariat listed five binational panels active under Chapter
19 (table 5.8).
[551]
The United States filed one case contesting Mexico’s determinations; Canada
filed three cases contesting U.S. determinations; and Mexico filed one case
contesting U.S. determinations. Table A.26 lists all chapter 19 panels with
developments in 2018, including those that were terminated.
Table
5.8
NAFTA Chapter 19
binational panels, active reviews through 2018
a
The United States filed the
first case contesting Mexico’s determination. Canada filed the next three
cases, and Mexico filed the last case, both countries contesting U.S.
determinations.
b
In Canada, the Canada Border Services Agency makes final dumping determinations
and the Canadian International Trade Tribunal makes subsidy determinations and
injury determinations. In Mexico, all determinations are made by the
Secretariat of the Economy. In the United States, dumping and subsidy
determinations are made by the U.S. Department of Commerce and injury
determinations are made by USITC. NAFTA Secretariat, “
Overview
of the Dispute Settlement Provisions
” (accessed June 14, 2019).
In 2018, U.S. officials met with FTA partners for
discussions on a variety of matters, including labor and environmental issues,
enhancing trade and investment, and dispute settlement.
[552]
Highlights of
these consultations are presented in this section.
To date, the United States has implemented 14 FTAs with a
total of 20 countries.
[553]
Twelve of the 14 U.S. FTAs have labor provisions to protect worker rights and
facilitate cooperation on labor issues, and another includes such provisions in
a supplemental agreement.
[554]
The USDOL’s Bureau of International Labor Affairs monitors reports and
submissions made under the labor provisions of U.S. trade agreements.
[555]
Similarly, 12
of the 14 FTAs contain environmental provisions to facilitate cooperation on
environmental matters and to ensure that domestic environmental laws are effectively
enforced, and another includes such provisions in a supplemental agreement.
[556]
Lastly, 12 of
the 14 U.S. FTAs have investment provisions designed to protect foreign
investors and their investments, as well as to facilitate the settlement of
investment disputes.
[557]
The U.S. Department of State assists companies involved in investment disputes
with foreign governments.
[558]
Highlights of the past year’s activities are discussed below.
The U.S.-Australia Free Trade Agreement was signed on May
18, 2004, and entered into force on January 1, 2005.
[559]
In 2018,
discussions in the U.S.-Australia Free Trade Agreement’s Joint Committee
[560]
led to
Australia’s removal of a 14-year Australian ban on U.S. heat-treated beef
products in May 2018. Australia also removed its luxury car tax on reimported
cars refurbished overseas.
[561]
The U.S.-Bahrain Free Trade Agreement was signed September
14, 2004, and entered into force on August 1, 2006.
[562]
In 2018, the
United States and Bahrain signed a Memorandum of Understanding on Trade in Food
and Agriculture Products that said that Bahrain will continue to accept
existing U.S. export certifications for food and agricultural products.
[563]
Labor
The United States and Bahrain discussed various aspects of labor
rights, including (1) improving Bahrain’s capacity to counter employment
discrimination; (2) possible legal amendments to make Bahrain’s labor laws more
consistent with international labor standards; (3) enforcement of labor laws
concerning freedom of association and collective bargaining; and, (4)
encouraging dialogue among stakeholders in Bahrain on labor matters.
[564]
Environment
On March 7, 2018, senior officials from the two governments
held the inaugural meeting of the Joint Forum on Environmental Cooperation
under the Memorandum of Understanding on Environmental Cooperation––negotiated
in parallel with the U.S.-Bahrain FTA––as well as the inaugural meeting of the
Subcommittee on Environmental Affairs held under the FTA.
[565]
They reviewed
progress in implementing commitments under the FTA’s Environment chapter, and
discussed areas of potential cooperation under the 2017–2021 Work Program on
Environmental Cooperation that was approved in August 2017.
[566]
These areas
included (1) projects and programs to improve air quality and reduce adverse
health effects from air pollution; (2) protection of coastal environmental
zones and overexploitation of marine resources; (3) capacity to protect
endangered species—for example, through the Convention on International Trade
in Endangered Species of Wild Fauna and Flora (CITES); and (4) promotion of the
environmental technology business sector.
[567]
The United States-Central America-Dominican Republic Free
Trade Agreement (CAFTA-DR) was signed on May 28, 2004, with El Salvador,
Honduras, Nicaragua, Guatemala, and Costa Rica; it was signed with the
Dominican Republic on August 1, 2004. The CAFTA-DR entered into force with all
parties by January 1, 2009.
[568]
Labor
In 2018, the United States continued engagement with the
Dominican Republic over concerns identified in a 2013 USDOL report regarding
labor laws in the Dominican sugar sector. In May 2018, USDOL published its
sixth periodic review of the implementation of the 2013 report’s
recommendations.
[569]
In addition, USDOL conducted missions in 2018 to Honduras as a follow-up to the
2015 multiyear Labor Rights Monitoring and Action Plan, which set out concrete
steps that the government of Honduras must take to improve the application of
its labor laws. In October 2018, USDOL published a progress report on the
status of implementation of the plan.
[570]
In 2018, Guatemala established a National Tripartite Commission
on Labor Relations and Freedom of Association. The commission contributed to
the closure in November 2018 of a complaint by Guatemalan workers to the
International Labour Organization (ILO) alleging violations of the ILO’s
freedom of association provisions.
[571]
Environment
Officials met twice in 2018 to discuss implementation of the
environmental provisions of CAFTA-DR.
[572]
The Environmental Affairs Council met in June 2018 in Santo Domingo, Dominican
Republic, with a particular focus on combating wildlife trafficking and illegal
logging.
[573]
The council also discussed the role of environmental courts and tribunals in
enforcing environmental laws to help implement the Environmental Cooperation
Agreement established under CAFTA-DR. The Secretariat for Environmental
Matters, an independent body, received three new submissions from the public
claiming a failure to effectively enforce a CAFTA-DR party’s environmental
laws. The Secretariat has received 41 such submissions since its establishment
in 2007.
[574]
The U.S.-Chile Free Trade Agreement was signed June 6, 2003,
and entered into force on January 1, 2004.
[575]
On October 16, 2018, officials from the two countries held the 12th meeting of
the United States-Chile Free Trade Commission, which is responsible for the
ongoing implementation of the U.S.-Chile FTA.
[576]
A major focus
of that meeting was addressing longstanding intellectual property rights issues
in Chile.
[577]
Labor
In 2018, USDOL released its annual report on child labor,
citing Chile as having made “moderate advancement” in efforts to eliminate the
worst forms of child labor. The report also mentioned positive measures in the
areas of legal framework, labor and criminal law enforcement, and coordination
of government efforts, as well as government policies and social programs.
[578]
Environment
In 2018, U.S. and Chilean officials met for the eighth
meeting of the Environmental Affairs Council under the agreement, as well as
the sixth meeting of the Joint Commission for Environmental Cooperation.
[579]
The two sides
approved a Work Program covering 2018–20, which sets out work priorities,
including strengthening effective implementation and enforcement of
environmental laws, promoting conservation, and promoting improved air and
water quality.
[580]
The U.S.-Colombia Trade Promotion Agreement was signed
November 22, 2006, and entered into force on May 15, 2012.
[581]
On January 1,
2019, the eighth annual set of tariff reductions took effect under the
agreement; the agreement should be fully in effect 10 years after its entry
into force, or 2022. On August 3, 2018, the United States and Colombia held the
second meeting of the Free Trade Commission, the body established to review
implementation of the United States-Colombia Trade Promotion Agreement.
[582]
Labor
The two governments held meetings about the Labor Chapter of
the FTA in February and December 2018. Specifically, they met to discuss
Colombia’s implementation of recommendations made in the 2017 report issued by
USDOL.
[583]
These recommendations addressed issues concerning Colombia’s labor law
inspection system, fines for employers who violate labor laws, abusive
subcontracting and collective pacts, and prosecution of violence and threats
against unionists.
[584]
Environment
In July 2018, the United States and Colombia signed the
Agreement Establishing a Secretariat for Environmental Enforcement Matters
consistent with the requirements of the FTA. The independent secretariat is
responsible for receiving submissions from the public alleging that Colombia is
failing to effectively enforce its environmental laws and developing factual
records regarding such submissions when directed by an FTA party to do so. The
two partners also finalized selection of an Executive Director to oversee the
Secretariat’s functions.
[585]
The U.S.-Israel Free Trade Agreement was signed April 22,
1985, and entered into force on September 1, 1985.
[586]
The United
States-Israel Joint Committee is the central oversight body for the agreement,
but it has not met since February 2016.
[587]
In November 2018, the two sides held the first round of negotiations on an
agreement to succeed the 2004 U.S.-Israel Agreement on Trade in Agricultural
Products. The 2004 agreement, which addressed market access in agricultural
products, was supposed to expire in December 2008, but has been extended each
year to provide time to negotiate a new agreement. According to USTR, the 2004
agreement provides Israel with duty-free access to 90 percent of agricultural
tariff lines, whereas Israel provides the United States with duty-free access
to only 72 percent.
[588]
The U.S.-Jordan Free Trade Agreement was signed October 24,
2000, and entered into force on December 17, 2001; the U.S.-Jordan FTA was
fully implemented as of January 1, 2010.
[589]
The Joint Committee that oversees the agreement met last in May 2016,
discussing issues concerning trade and investment, labor, agriculture, and
technical barriers to trade in agriculture, as well as aspects of WTO
agreements.
[590]
The Qualifying Industrial Zone program allows products with a certain amount of
Israeli content to enter the United States duty free if manufactured in Jordan
(this is also true of such products when made in Egypt or in the West Bank and
Gaza). In 2018, U.S. imports from Jordan under the Qualifying Industrial Zones
were $12.9 million, less than 1.0 percent of total U.S. imports from Jordan.
[591]
Labor
The United States and Jordan signed the Implementation Plan
Related to Working and Living Conditions of Workers in Jordan in 2013. The plan
addresses concerns about Jordan’s garment factories, such as anti-union
discrimination against foreign workers, accommodation conditions for foreign
workers, and gender discrimination and harassment. In 2018, the two parties
continued work toward completing the plan, in particular addressing inspection
of living conditions for garment workers by Jordan’s Ministry of Labor. In
December 2018, the U.S. Department of Labor visited Jordan to press for the
issuance of directives under the plan, as well as of outreach materials for
migrant workers.
[592]
Environment
In February 2018, the two parties held a Joint Forum on
Environmental Cooperation in Amman, Jordan.
[593]
During the Joint Forum, the parties reviewed accomplishments under the 2014–18
Environmental Work Program and approval of a new Work Program for 2018–21. The
new work program sets out activities addressing effective enforcement of
environmental laws, protecting wildlife, and sustainably managing wildlife,
ecosystems, and natural resources by strengthening legislation implementing the
Convention on International Trade in Endangered Species of Wild Fauna and Flora
(CITES).
[594]
On January 5, 2018, representatives of the United States and
South Korea met in Washington, DC, to negotiate modifications and amendments to
the U.S.-Korea Free Trade Agreement (KORUS). The two countries discussed
solutions to crosscutting barriers as well as sector-specific barriers to trade
in key industrial goods sectors.
[595]
These discussions continued in a meeting in Seoul on January 31–February 1,
2018, where views on market access and tariffs were exchanged.
[596]
On March 28,
2018, U.S. Trade Representative Lighthizer and South Korean Minister for Trade
Hyun Chong Kim reached an agreement in principle on the general terms of the
amendments to the KORUS agreement.
[597]
As part of this last round of talks, the two countries also agreed on terms for
a country exemption for South Korea from the steel import tariffs imposed by
Presidential Proclamation 9705 in exchange for quantitative limitations on U.S.
imports of steel from South Korea.
[598]
Subsequent meetings on the progress of KORUS revisions took place in
Washington, DC, between Trade Representative Lighthizer and Trade, Industry,
and Energy Minister Paik Ungyu on April 23, 2018, and between Trade
Representative Lighthizer and Trade Minister Hyun Chong Kim on July 27, 2018.
[599]
On September 3, 2018, USTR and South Korea’s Ministry of
Trade, Industry, and Energy published the agreed outcome of the negotiations to
amend and modify KORUS.
[600]
Representatives of the United States and South Korea signed a number of
amendments to KORUS and related commitments on September 24, 2018, in New York.
[601]
Notable
changes were made on the following issues:
Automotive Products.
South Korea agreed to extend the phaseout of the 25 percent U.S. tariff on
South Korean trucks from 2021 to 2041.
[602]
It also agreed to several provisions pertaining to recognition of standards,
committing to (1) double the number of U.S.-origin vehicles per manufacturer
that may be imported annually and sold in South Korea if they meet U.S. safety
standards in lieu of South Korean safety requirements, (2) recognize U.S.
standards for auto parts needed to service U.S. vehicles, and (3) eliminate
duplicative or additional emissions testing of U.S. vehicles for the South
Korean market.
[603]
With regard to emissions standards, South Korea agreed to expand the
“eco-credit” cap from 14 grams of carbon dioxide per kilometer to 17.9 grams
(the current U.S. cap), and to consider more lenient targets for small-volume
manufacturers in the forthcoming implementing regulations for the 2021–25
Corporate Average Fuel Economy standards.
[604]
Customs.
South
Korea agreed to make changes to the procedures of the South Korean Customs
Service for verifying the origin of exports from the United States for claims
of preferential tariff treatment under KORUS. The two sides also committed to
setting up a working group to monitor and address future issues.
[605]
Pharmaceuticals.
The United States secured a commitment from South Korea to amend its Premium
Pricing Policy for Global Innovative Drugs, ensuring nondiscriminatory
treatment for U.S. pharmaceutical exports in compliance with South Korea’s
obligations under KORUS.
[606]
The revised agreement also clarifies and restricts the
investor-state dispute settlement application under KORUS,
[607]
introduces a
new provision increasing the transparency of trade remedy procedures,
[608]
and provides
preliminary modifications to the rules of origin for South Korean textiles.
[609]
Annual meetings of committees formed under KORUS continued
to convene in 2018. The Sanitary and Phytosanitary Procedures (SPS) and
Agriculture Committees, formed in efforts to align biotechnology policies and
pesticide maximum residue limits and to resolve SPS barriers to trade, met most
recently in Washington, DC, in November 2018, and made substantive progress on
a number of these issues.
[610]
The South Korean government submitted the bill to the
National Assembly for ratification on October 12, 2018, and the National
Assembly ratified the revised KORUS agreement on December 7, 2018.
[611]
On the U.S.
side, the President implemented the changes by proclamation pursuant to his
authority in section 201(b) of the United States-Korea Free Trade Agreement
Implementation Act and in accordance with the consultation and layover
requirement in section 104 of the act.
[612]
The signed KORUS modifications entered into force on January 1, 2019.
[613]
The U.S.-Morocco Free Trade Agreement was signed June 15,
2004, and entered into force on January 1, 2006.
[614]
The two
parties held their fifth meeting of the FTA Joint Committee on October 18,
2017, concentrating on a number of agriculture and SPS issues, geographical
indications (GIs), and certain textile and apparel cases. The United States and
Morocco improved their understanding of their respective views on GIs during
2018, given a pending Morocco-EU agreement on the protection of GIs. In late
2018, the United States approved modifications of certain rules of origin for
textiles and apparel under the FTA at Morocco’s request.
[615]
Agriculture and Sanitary and Phytosanitary Measures
In the area of agricultural market access, in 2018 Morocco
opened its market to imports of U.S. beef and poultry after the two sides
agreed on export certificates. Morocco also agreed to speed up the phaseout of
duties on 40 tariff lines covering wheat, beef, and poultry products, given
that Morocco applied lower duties on EU products. Morocco also agreed to
improve access to its tariff-rate quota for common wheat by increasing tenders
and improving administration of the quota.
[616]
Labor
Following concerns raised by the United States in 2014 under
the agreement’s labor provisions, Morocco continued to carry out a new domestic
worker law in 2018. This law extends protection and benefits to Moroccan
workers by setting a minimum wage, limiting weekly working hours, setting a
minimum age for employment, and providing for a day of rest for workers.
[617]
Environment
The United States-Morocco Working Group on Environmental
Cooperation met in 2018 to monitor implementation of the agreement’s
Environment chapter, review accomplishments of the 2014–17 Plan of Action, and
to approve a new Plan of Action for 2018–21. The new plan addresses
environmental cooperation regarding technological solutions in the areas of
water, air, and waste technology, as well as efforts to combat environmental
crimes. It prioritizes combating wildlife trafficking, illegal logging, and
illegal fishing through consultations and training. It also seeks to create
opportunities for innovation and technological solutions in areas such as solid
waste management, recycling, and monitoring and mitigation of pollution.
[618]
The U.S.-Oman Free Trade Agreement was signed January 19,
2006, and entered into force on January 1, 2009.
[619]
The United
States-Oman Joint Committee, which oversees the agreement, has discussed a
broad range of trade issues, including trade and investment; the FTA’s customs,
investment, and services chapters; possible cooperation in the broader Middle
East and North Africa region; and cooperative efforts related to labor rights
and environmental protection.
[620]
Labor
Stemming from the agreement’s labor provisions, in 2018 Oman
launched a new two-year “Decent Work Country Program” in conjunction with the
United Nations’ International Labour Organization. This program is aimed at
building on the previous program, which ended in 2016. The new program focuses
on social protection; employment, skills, and entrepreneurship development; and
international labor standards and labor governance.
[621]
Environment
USTR has continued to review implementation of the U.S.-Oman
FTA Environment chapter and held bilateral meetings in Muscat in March 2018
focusing on wildlife trafficking and illegal fishing. As part of these
meetings, the United States and Oman signed a new Plan of Action for 2018–21.
The plan sets out activities related to managing ecosystems and natural
resources sustainably; combating wildlife trafficking; and promoting
environmental education, training, awareness, and transparency, as well as
public participation in environmental decision-making and enforcement.
[622]
The U.S.-Panama Trade Promotion Agreement was signed June
28, 2007, and entered into force on October 31, 2012.
[623]
On January 1,
2019, the eighth round of tariff reductions under the agreement took place. The
United States-Panama Free Trade Commission (FTC) is the central oversight body
for the agreement, but did not meet in 2018.
[624]
In 2018, the two countries continued to work together to address remaining
implementation issues under the agreement. The two sides expect to hold the
third FTC meeting in 2019 to review implementation of the TPA.
[625]
Labor
The two sides met in September 2018 to discuss various
issues concerning labor law enforcement, in particular laws against child
labor.
[626]
Environment
The Environmental Affairs Council (EAC) and the
Environmental Cooperation Commission (ECC) met in October 2018 to discuss
environmental protection under the agreement’s Environment chapter,
particularly wildlife trafficking, illegal logging, illegal fishing, and
conservation of wetlands. The EAC approved a 2018–19 work program and working
procedures for the Secretariat for Environmental Enforcement Matters, which
launched at this meeting.
[627]
The independent secretariat aims to promote participation in environmental
enforcement issues and receives and considers public submissions about the
enforcement of environmental laws.
[628]
The ECC discussed environmental cooperation projects
completed under the 2014–17 Environmental Cooperation Work Program, as well as
the status of current and planned environmental cooperation projects. These
projects address issues such as illegal, unreported, and unregulated (IUU)
fishing and illegal logging; wildlife trafficking; environmental management at
ports; air quality; environmental impact assessments; and adoption of cleaner
production practices. The ECC also approved its second work program for
2018–22. It prioritizes cooperative activities to strengthen environmental laws
and regulations; improve private sector compliance with environmental laws; and
increase education, transparency, and public participation to improve
protection of the environment and enforcement of environmental laws.
[629]
The U.S.-Peru Trade Promotion Agreement (TPA) was signed
April 12, 2006, and entered into force on February 1, 2009.
[630]
All remaining
tariff reductions, which cover only agricultural products, should be complete
by 2026. The U.S.-Peru Free Trade Commission oversees the agreement and its implementation.
In 2018, four of the bodies organized under the Free Trade Commission met: the
Committee on Technical Barriers to Trade, the Committee on Sanitary and
Phytosanitary Matters, the Committee on Trade Capacity Building, and the
Working Group on Customs and Trade Facilitation. The two governments expect to
hold the next Free Trade Commission meeting in 2019.
[631]
Labor
In 2018, both sides continued to follow up on the issues
raised in a 2016 U.S. Department of Labor (USDOL) report issued in response to
a submission made under the Labor chapter of the TPA. These issues concerned
Peru’s protection of fundamental labor rights and enforcement of labor laws, in
particular as they relate to nontraditional exports and temporary contracting
in both the agriculture and the textile industries.
[632]
In April 2018,
USDOL issued its second periodic review of progress made in addressing these
concerns,
[633]
and in November 2018, officials from USTR and USDOL held a teleconference with
Peruvian officials to discuss efforts by Peru to address labor issues.
[634]
In addition,
USDOL recognized Peru’s advances in combating child labor in its most recent
report on the subject.
[635]
The USDOL report noted, among other things, that Peru increased criminal
penalties for subjecting children to forced labor and had imposed its longest
human trafficking sentence yet in a case involving minors.
[636]
Environment
In addition
to its Environment chapter, the agreement includes the Annex on Forest Sector
Governance, aimed at combating illegal logging and trade in timber and wildlife
products from Peru. In February 2018, Peru and the United States convened the
seventh meeting of the Environmental Affairs Council (EAC) and the
Environmental Cooperation Commission (ECC), as well as the ninth meeting of the
Sub-committee on Forest Sector Governance (Sub-committee) in Lima.
[637]
The EAC
reviewed the progress Peru and the United States have made to effectively
implement, and comply with, the obligations under the agreement’s Environment
chapter, including implementation of the Secretariat for Submissions on
Environmental Enforcement Matters. The secretariat received two submissions in
July 2018 claiming failure to effectively enforce environmental laws.
[638]
In addition, in July 2018, the ECC exchanged views regarding
the implementation of the United States-Peru Environmental Cooperation Work
Program for 2015–2018. The parties highlighted cooperation regarding
small-scale gold mining, environmental monitoring and enforcement, and water
management in support of the agreement’s Environment chapter.
[639]
On February 26, 2018, the United States Interagency
Committee on Trade in Timber Products from Peru (Timber Committee) requested
that Peru verify whether three shipments of timber exported to the United
States in 2017 met requirements under the agreement’s Forest Annex.
[640]
Peru issued
its timber verification report in July 2018, which could not establish the
legality of one shipment.
[641]
In August 2018, the Timber Committee released recommendations related to this
issue. Many of these included commitments already made by Peru but not yet
substantially implemented, such as upgrading Peru’s timber traceability system,
improving detection of illegally harvested timber, and taking stronger action
against those violating Peru’s forestry laws.
[642]
The U.S.-Singapore Free Trade Agreement was signed May 6,
2003, and entered into force on January 1, 2004.
[643]
Environment
In January 2018, the two governments held their biennial
review under the Memorandum of Intent between the United States of America and
the Republic of Singapore on Cooperation in Environmental Matters, which was
negotiated in parallel with the Environment chapter of the U.S.-Singapore Free
Trade Agreement. The two sides focused on shared commitments to environmental
protection and sustainable natural resource use.
[644]
The two
governments reviewed accomplishments under the 2016–17 Plan of Action, in
particular efforts to combat wildlife trafficking and illegal fishing. They
also agreed on a new Plan of Action for 2018–19, which focuses on (1)
implementation and enforcement of environmental laws; (2) conservation and
sustainable use of and trade in natural resources; and (3) the exchange of
information on environmental policies, best practices in environmental
protection, and innovative environmental technology and techniques for
pollution management.
[645]
This chapter reviews U.S. bilateral trade relations with the
United States’ top trading partners in 2018: the European Union (EU), China,
Canada, Mexico, Japan, South Korea, India, and Taiwan (ordered according to the
value of their two-way merchandise trade with the United States). For each
trading partner, the chapter summarizes U.S. bilateral trade, including trade
in both merchandise and private services,
[646]
and reports the major developments in bilateral trade policies and programs during
2018.
The EU as a single entity is the United States’ largest
two-way trading partner (i.e., exports plus imports) in terms of both goods and
services. The value of U.S. merchandise trade with the 28 member states of the
EU increased 12.4 percent, from $717.7 billion in 2017 to $806.4 billion in
2018. The EU share of total U.S. goods trade rose slightly, from 18.6 percent
in 2017 to 19.2 percent in 2018. The U.S. merchandise trade deficit with the EU
rose by $17.9 billion, from $151.2 billion in 2017 to $169.1 billion in 2018,
as U.S. imports grew more than U.S. exports in value terms (figure 6.1).
The EU was the largest market for U.S. merchandise exports
in 2018 for the third year in a row, accounting for 19.1 percent of total U.S.
exports. U.S. goods exports to the EU increased 12.5 percent, from $283.3
billion in 2017 to $318.6 billion in 2018. Leading U.S. exports to the EU
included civilian aircraft, engines, and parts; crude petroleum; medicaments
(medicines); refined petroleum products; and nonmonetary gold. Nearly all of
the top 15 U.S. goods exports to the EU increased between 2017 and 2018.
The EU
remained the second-largest source of U.S. merchandise imports, following
China, in 2018. The EU accounted for 19.2 percent of total U.S. goods imports
in 2018. U.S. imports from the EU increased 12.3 percent, from $434.5 billion
in 2017 to $487.8 billion in 2018. Leading U.S. imports were passenger motor
vehicles, medicaments, certain immunological products, light oils, and parts of
turbojets and turbopropellers. U.S.-EU merchandise trade data are shown in
appendix tables A.27 through A.30.
Figure
6.1
U.S. merchandise trade
with the EU, 2014–18
Source: USITC DataWeb/USDOC
(accessed May 17, 2019).
Note: Underlying data can be found
in appendix table
B.5
.
Figure
6.2
U.S. cross-border trade in
private services with the EU, 2014–18
Source: USDOC, BEA, U.S.
International Transactions, Services, & IIP, International Transactions,
International Services, tables 2.2 and 2.3, and International Transactions,
table 3.2, June 20, 2019.
Note: Data for 2018 are preliminary.
Underlying data can be found in appendix table
B.7
.
U.S. two-way cross-border trade in services with the EU
increased 3.4 percent to $450.4 billion in 2018 and accounted for 33.4 percent
of total U.S. trade in services that year. The United States continued to
register a trade surplus in services with the EU—one that increased from $50.3
billion in 2017 to $53.2 billion in 2018—as U.S. exports grew more than U.S.
imports (figure 6.2). The United Kingdom (UK) was the EU’s largest services
trader with the United States, with 29.8 percent of the EU total, followed by
Germany and France.
U.S. exports of services to the EU increased 3.7 percent
($8.9 billion) to $251.8 billion in 2018, while U.S. imports increased 3.1
percent ($6.0 billion) to $198.6 billion (tables A.31 and A.32). Leading U.S.
services exports to the EU included other business services,
[647]
charges for
the use of intellectual property,
[648]
travel services, and financial services. Leading U.S. services imports from the
EU included travel services, other business services, transport, and charges
for the use of intellectual property.
A potential U.S.-EU trade agreement was under discussion
beginning in July 2018. These discussions led to the establishment of an
Executive Working Group to reduce transatlantic trade barriers, which was one
of the primary trade events of the U.S.-EU relationship over the past year.
However, attention was also focused on the steel and aluminum tariffs imposed
on EU goods by the United States under section 232 of the Trade Expansion Act
of 1962, and EU retaliatory measures. Despite their disagreement over the
tariffs, the United States and EU—along with Japan—found common ground in
looking at nonmarket economic policies of third countries, on which they issued
a joint scoping paper outlining possible collective remedial actions.
[649]
Finally, the
EU’s much-discussed General Data Privacy Regulation (GDPR) went into effect in
May 2018, in concert with a joint U.S.-EU review of the EU-U.S. Privacy Shield
Framework.
[650]
All of these topics are described below.
EU automotive exports to the United States were also at
issue in 2018. On May 23, 2018, USDOC initiated an investigation under section
232 of the Trade Expansion Act to determine the effects on national security of
imports of automobiles, including cars, SUVs, vans and light trucks, and
automobile parts.
[651]
The EU submitted written comments to USDOC on June 29, 2018.
[652]
EU Ambassador
David O’Sullivan provided testimony at USDOC’s public hearing on July 19, 2018,
stating that EU automotive exports to the United States do not threaten or
impair the U.S. auto industry or national security.
[653]
In March 2018, the first Joint Committee meeting under the
Bilateral Agreement on Prudential Measures regarding Insurance and Reinsurance
(the U.S.-EU Covered Agreement) was held to reaffirm commitments made in 2017
concerning continuous review, close coordination, and full and timely
implementation of agreement provisions.
[654]
The UK continued to prepare for an expected exit from the EU (Brexit)
[655]
by signing a
separate U.S.-UK Bilateral Agreement on Prudential Measures Regarding Insurance
and Reinsurance in December 2018; this agreement upholds the terms of the
U.S.-EU Covered Agreement.
[656]
Under the framework of the Transatlantic Economic Council, the EU hosted the
ninth workshop for small and medium-sized enterprises (SMEs) in Vienna,
Austria. This workshop focused on best practices for supporting SME development
through dual vocational education programs, technology-assisted financing,
cooperative intellectual property protections, and public-private partnerships.
[657]
Lastly,
In March 2018, the EU Commission proposed a directive to establish an interim
EU-wide tax on digital services.
[658]
However, the proposal was abandoned in early 2019 when several member states
voiced opposition. By March 2019, four member states (France, Italy, Spain, UK)
had separately introduced or proposed introducing a digital services tax bill.
[659]
Also during 2018, there was a new development in the
long-running dispute on EU measures affecting trade in large civil aircraft,
based on a dispute that the United States filed with the World Trade
Organization (WTO) in 2004. On May 15, 2018, the WTO compliance panel issued a
report confirming that the EU and certain EU member states had failed to comply
with the earlier WTO determination that found launch aid to be inconsistent
with their WTO obligations (DS316).
[660]
The outcome of the WTO compliance panel report is described in more detail in
chapter 3.
Section 232 Steel and Aluminum Tariffs
On February 16, 2018, under section 232 of the Trade
Expansion Act of 1962, the U. S. Department of Commerce (USDOC) released its
report finding that imports of steel and aluminum threatened U.S. national
security.
[661]
In response to these findings, the President imposed a 25 percent ad valorem
tariff on imported steel from all countries, temporarily excluding Canada and
Mexico, and a 10 percent ad valorem tariff on imported aluminum from all
countries, also temporarily excluding Canada and Mexico, effective March 23,
2018.
[662]
On March 22, 2018, President
Trump issued two more proclamations temporarily exempting the EU and certain
other countries from the tariffs, as discussions continued with the goal of
finding “satisfactory alternative means to address the threatened impairment to
the national security.”
[663]
With respect to the EU, the new proclamations highlighted “our shared
commitment to supporting each other in national security concerns; the strong
economic and strategic partnership between the United States and the EU, and
between the United States and EU member countries; and our shared commitment to
addressing global excess capacity in steel [and aluminum] production.” If
satisfactory alternative means were not found, these exemptions would last only
through May 1, 2018.
[664]
On April 30, 2018, the President issued two more proclamations, which further
exempted the EU, Canada, and Mexico from the tariffs until June 1, 2018.
[665]
On May 16, 2018, the EU responded to the proposed imposition
of the section 232 steel and aluminum tariffs by issuing a regulation that
announced the imposition of additional ad valorem duties on selected U.S.
products in two stages. The first stage included ad valorem duties of up to 25
percent on imports from the United States valued at $3.1 billion, including
agricultural products, processed food, beverages, tobacco, eye makeup, cotton
T-shirts, steel and aluminum products, and more.
[666]
On June 1, 2018, the United States imposed the section 232
tariffs on steel and aluminum imports from the EU; on June 20, 2018, the
European Commission adopted the regulation imposing retaliatory tariffs,
effective June 22.
[667]
Also on June 1, the EU requested WTO dispute settlement consultations with the
United States (DS548) concerning the imposition of the section 232 tariffs.
[668]
On July 16,
2018, the United States responded by requesting WTO consultations with the EU
regarding the EU imposition of retaliatory tariffs (DS559).
[669]
For more
information about these WTO dispute settlement cases, see chapter 3.
The second stage of the two-stage EU response, announced in
May 2018, included extra ad valorem duties of 10, 25, 35, and 50 percent on
about $3.9 billion worth of U.S. goods, including motor vehicles, cranberries,
textile fabrics, footwear, tableware, washing machines, and more. These tariffs
are to be applied either starting March 23, 2021, or after the WTO Dispute
Settlement Body rules that the “United States’ safeguard measures are
inconsistent with the relevant provisions of the WTO Agreement,” if that ruling
comes earlier.
[670]
In 2017, the last full year before tariffs were imposed, the
EU was the largest source of U.S. steel imports, comprising 19.8 percent of all
U.S. steel product imports.
[671]
The EU was also the fifth-largest source for U.S. aluminum imports, comprising
6.6 percent of all U.S. aluminum imports in 2017.
[672]
Trade Agreement Negotiations
On July 25, 2018, President Trump and European Commission
President Jean-Claude Juncker established a U.S.-EU Executive Working Group to
work together to (1) eliminate non-auto industrial tariffs and nontariff
barriers; (2) increase trade in several key industries, including services,
chemicals, pharmaceuticals, medical products, and soybeans; and (3) work
together with other WTO partners on WTO reform to address such issues as
industrial subsidies, intellectual property theft, forced technology transfer,
overcapacity, and other distortions imposed by state-owned enterprises.
[673]
The two sides
also agreed to launch a dialogue on standards, following up on past work, and
to cooperate in the area of energy, in particular to facilitate U.S. exports of
liquefied natural gas to the EU.
[674]
On October 16, 2018, the Office of the U.S. Trade
Representative (USTR) notified Congress of the Administration’s intent to
initiate negotiations on a trade agreement with the EU under the Bipartisan
Congressional Trade Priorities and Accountability Act of 2015.
[675]
USTR’s letter
to Congress set out broad goals of securing higher-paying jobs in the United
States, and improving trade and investment opportunities with the EU. In
addition to consulting with Congress, USTR solicited comments from the public
and held a hearing on December 14, 2018. Using this input, in January 2019,
USTR published negotiating objectives for the agreement.
[676]
For more
information, see chapter 5.
Non-market Economic Policy
On May 31, 2018, a trilateral meeting of the U.S., EU, and
Japanese trade ministers produced a joint scoping paper on the issue of
non-market-oriented policies of third countries that lead to unfair competitive
conditions. All parties agreed to “deepen and accelerate” discussions on
possible new WTO rules for industrial subsidies and state-owned enterprises,
with a view toward future negotiations. The three parties also released two
joint statements on cooperating to address forced technology transfer, and on
identifying the elements that signal market conditions and the means to
maintain these conditions.
[677]
The scoping paper defined the basis for developing strong
rules on market-distorting industrial subsidies.
Specific objectives outlined included
improving transparency by incentivizing WTO members to notify the WTO of
subsidies granted or maintained. The ministers also recognized the need to
better address the market-distorting behavior of public bodies and state-owned
enterprises by defining a “public body” and dealing with “state-influenced
market-distorting behavior” of entities not defined as public bodies. The paper
also suggested ways to improve the effectiveness of subsidy rules, including prohibiting
the most harmful subsidies, providing a targeted remedy to address subsidies
that contribute to overcapacity, and enhancing information-gathering rules at
the WTO.
[678]
The group’s first joint statement addressed (1) policies
that pressure foreign companies to transfer technology to domestic entities and
(2) government-supported “unauthorized intrusion into, and theft from, the
computer networks of foreign companies to access their sensitive commercial
information and trade secrets and use that information for commercial gain.”
Specific objectives outlined in the statement included pinpointing and sharing
best practices for stopping governments’ direct and unfair support for
systematic investment in—and acquisition of—foreign companies’ assets in order
to obtain their technology and intellectual property. The three parties also
agreed to work with like-minded partners to stop policies and practices that
contribute to forced technology transfer, through the WTO dispute settlement
process if necessary.
[679]
The second joint statement addressed non-market-oriented
policies and practices that lead to overcapacity and uncompetitive markets. The
statement affirmed a list of elements that signal market-oriented
conditions—including freely determined decisions on prices, costs, inputs,
purchases, sales, investments, and capital allocation based on market signals;
market-determined prices of capital, labor, and technology; and recognition of
international accounting standards, corporation law, bankruptcy law, and private
property law—and pledged to add to this list if possible. The parties also
agreed to work with other countries on finding ways to maintain market-oriented
conditions.
[680]
GDPR and the U.S.-EU Privacy Shield
The EU’s General Data Protection Regulation (GDPR), intended
to modernize and replace the EU’s 1995 Data Protection Directive, lays out a
comprehensive approach to data protection and privacy.
[681]
It took effect
on May 25, 2018.
[682]
GDPR establishes strict privacy rights for individuals as regards the processing,
collection, dissemination, erasure, and portability of their personal data.
[683]
The GDPR characteristic that most concerns U.S. companies
and trade associations is GDPR’s “extraterritorial jurisdiction”—the fact that
it applies outside the EU’s boundaries.
[684]
Companies that handle personal data of EU data subjects
[685]
fall under EU
legal jurisdiction with respect to obeying GDPR rules regardless of the
companies’ physical location. Complying with GDPR adds legal and administrative
expenses and raises costs of data storage and processing for affected firms.
Moreover, firms that fail to comply with GDPR data protection rules not only
may be liable as “controllers” of personal data, but also may be jointly liable
with their contractors that are “processers” of those personal data. Violators
may be fined up to 4 percent of their annual global firm revenue.
[686]
Despite widespread concern over the anticipated costs of
complying GDPR’s policies, some experts have acknowledged a benefit to the
competitiveness of larger digital services companies that have adequate
resources to bear the compliance costs of such legislation.
[687]
A further concern for U.S. companies is the possible spread
of the GDPR approach. Given the large size of the EU market and the breadth of
its authority, many countries outside the EU often use EU regulations as a
model for their own. This tendency could have the effect of duplicating these
stringent data policies in other markets in which U.S. firms operate.
[688]
Though GDPR only came into force in 2018, data privacy has
long been part of the U.S.-EU economic policy agenda. In fact, 2018 saw the
second annual review of the U.S.-EU Privacy Shield framework, which gives
companies a mechanism for transferring personal data from the EU to the United
States that is consistent with EU law.
[689]
At the second annual review in Brussels, Belgium, in October 2018, the European
Commission concluded that the Privacy Shield framework “continues to provide an
adequate level of privacy protection under EU law.”
[690]
The EU
highlighted improvements made by USDOC following the first annual review in
2017, including setting up a system of checks on random firms to ensure
compliance, and the verification of public access to firms’ privacy policies
online.
[691]
The EU also reiterated the need for the United States to nominate a permanent
ombudsperson to address potential disputes. Despite the overall positive
review, the Privacy Shield framework was the subject of cases before the EU
General Court and Irish Supreme Court in 2018.
[692]
In 2018, China remained the United States’ top
single-country trading partner in terms of two-way merchandise trade,
accounting for 15.7 percent of total U.S. trade. Total U.S. merchandise trade
with China increased 3.9 percent, from $635.4 billion in 2017 to $659.8 billion
in 2018. Over the same period, the U.S. merchandise trade deficit with China
grew by $43.6 billion in 2018 to $419.2 billion. The growth in the bilateral
merchandise trade deficit was attributable to a $9.6 billion decrease in U.S.
exports to China, accompanied by a $34.0 billion increase in U.S. imports
(figure 6.3).
In 2018, China was the third-largest single-country
destination for U.S. merchandise exports, accounting for 7.2 percent of global
U.S. merchandise exports. Between 2017 and 2018, U.S. exports of merchandise to
China declined 7.4 percent, from $129.9 billion in 2017 to $120.3 billion in
2018. Agricultural exports contributed to the vast majority of this decline,
particularly soybeans. Leading U.S. exports to China were civilian aircraft,
engines, and parts; passenger motor vehicles;
[693]
crude
petroleum; semiconductors; and soybeans.
China remained the largest source of U.S. merchandise
imports in 2018, accounting for 21.2 percent of global U.S. imports. The value
of U.S. imports from China increased 6.7 percent in 2018, from $505.5 billion
in 2017 to $539.5 billion in 2018. Leading U.S. imports from China were
cellphones; portable computers and tablets; telecommunications equipment; and
computer parts and accessories. Imports in all of these top four categories
rose from 2017 to 2018, with the exception of cellphone imports, which declined
3.1 percent. U.S.-China merchandise trade data are shown in appendix tables
A.33–A.36.
China was the United States’ third-largest services trading
partner in 2018, with two-way services trade growing by 2.8 percent from $72.9
billion in 2017 to $75.0 billion in 2018. U.S. services exports grew by 2.1
percent to $56.7 billion, while services imports grew by 5.3 percent, reaching
$18.3 billion. As a result, the U.S. services trade surplus with China grew by
0.6 percent in 2018, reaching $38.5 billion (figure 6.4).
In 2018, top services exports to China included travel
services ($32.1 billion); charges for intellectual property use ($8.5 billion);
and transport ($5.3 billion) (table A.37). Travel services is by far the
largest of these sectors, comprising 56.5 percent of 2018 U.S. services exports
to China. The fastest-growing category of services exports to China in 2018 was
maintenance and repair services, growing 20.0 percent since 2017. The top U.S.
services imports from China included other business services ($5.4 billion);
transport ($5.0 billion); and travel services ($4.5 billion) (table A.38).
These three sectors accounted for 82.1 percent of 2018 U.S. services imports
from China. The fastest-growing import category, however, was insurance
services, growing 63.5 percent since 2017.
Figure
6.3
U.S. merchandise trade
with China, 2014–18
Source: USITC DataWeb/USDOC
(accessed May 9, 2018).
Note: Underlying data can be found in
appendix table
B.5
.
Figure
6.4
U.S. cross-border trade in private services with China, 2014–18
Source: USDOC, BEA U.S.
International Transactions, Services, & IIP, International Transactions,
International Services, tables 2.2 and 2.3, and International Transactions,
table 3.2, June 20, 2019.
Note: Data for 2018 are preliminary.
Underlying data can be found in appendix table
B.7
.
Since China’s accession to the WTO in 2001, the United
States has filed 23 WTO disputes against China. Of the 20 WTO disputes China
has filed since its accession, 15 have been against the United States. In 2018,
the United States filed 2 new WTO disputes against China. The first one was
filed on March 23, 2018, following the release of USTR’s
Findings of the
Investigation into China’s Acts, Policies, and Practices Related to Technology
Transfer, Intellectual Property, and Innovation under Section 301 of the Trade
Act of 1974
, discussed below
.
[694]
In that
dispute, the United States requested consultations with China concerning
measures pertaining to the protection of intellectual property rights (IPRs).
[695]
In the second dispute, filed on July 16, 2018, the United
States requested consultations about China’s imposition of additional duties on
imported U.S. products.
[696]
Developments in these and other WTO disputes during 2018 are described in more
detail in chapter 3 and appendix table A.25.
In 2018, high-level U.S.-China official dialogue did not
follow the same structure as in the past. Previously, high-level U.S.-China
bilateral discussions fell under the umbrella of the U.S.-China Joint
Commission on Commerce and Trade, the U.S.-China Strategic Economic Dialogue,
the U.S.-China Strategic and Economic Dialogue,
[697]
and the
relatively new U.S.-China Comprehensive Economic Dialogue, which the Trump
Administration established in April 2017. But USTR deemed efforts before 2018
to be “largely ineffective,” citing what it viewed as the marginal progress
made by each of these groups.
[698]
As a result, institutions such as the U.S.-China Economic and Security Review
Commission noted that high-level institutional bilateral discussions were less
structured in 2018, and even called into question the future of such forums.
[699]
A series of high-level bilateral consultations took place in
May 2018 between U.S. Secretary of the Treasury Steven Mnuchin, U.S. Secretary
of Commerce Wilbur L. Ross, U.S. Trade Representative Robert Lighthizer,
Chinese State Council Vice Premier Liu He, and other high-ranking Chinese
officials. On May 19, 2018, as a result of those discussions, the United States
and China released a joint statement of progress regarding a number of
bilateral trade issues.
[700]
According to the statement, both sides agreed to meaningful increases in U.S.
agricultural and energy exports to China, the importance of IPR protection, and
the need to encourage two-way bilateral investment.
[701]
Despite these developments, on May 29, 2018, the United
States announced that it planned to proceed with the tariff hikes against China
under section 301.
[702]
In response, China declared those actions to be “clearly contrary to the recent
agreement between the two sides,” and said it would not carry out the
market-opening efforts it had planned to pursue if threatened by the higher
tariffs.
[703]
After the imposition of tariffs from both sides, as described further below,
President Trump and China’s President Xi Jinping met at the G20 conference in
Argentina on December 1, 2018. At this meeting, they agreed that the United
States would suspend raising the tariff rate from 10 percent to 25 percent on
the third tranche of approximately $200 billion worth of Chinese goods.
[704]
The suspension
was aimed at providing the negotiators with more time to find a mutually
acceptable solution.
[705]
Tariff Escalation
In 2018, the United States implemented a variety of trade
measures as trade tensions rose. In particular, it imposed higher tariffs and
implemented several related policies, including short-term relief programs for
U.S. agriculture and enhanced reviews for Chinese investment (described below).
China, too, increased its tariffs on U.S. imports at various periods throughout
2018 in response to U.S. actions, and an increasing number of U.S. companies
operating in China have expressed concerns over increased regulatory barriers.
[706]
Section 232 Steel and Aluminum Tariffs.
On
February 16, 2018, under section 232 of the Trade Expansion Act of 1962, USDOC
released its report finding that imports of steel and aluminum threatened to
impair U.S. national security.
[707]
In response to these findings, the President imposed a 25 percent ad valorem
tariff on imported steel from China and all other countries (except Canada and
Mexico) and a 10 percent ad valorem tariff on imported aluminum from China and
all other countries (except Canada and Mexico), effective March 23, 2018.
[708]
In response,
China requested dispute settlement consultations with the United States at the
WTO on April 5, 2018.
[709]
In April 2018, China also imposed additional tariffs of 15 to 25 percentage
points on selected U.S. exports, including aluminum waste and scrap, pork,
fruits and nuts, wine, modified ethanol, ginseng roots, and stainless steel
pipes.
[710]
The United States requested WTO dispute settlement consultations with China on
the imposition of these additional duties on July 16, 2018.
[711]
Dispute
Settlement Body panels were established for both WTO disputes on November 21,
2018.
[712]
In 2017, the last full year before tariffs were imposed,
China was the 10th-largest source of U.S. steel imports, accounting for 3.4
percent of all U.S. steel imports in that year.
[713]
China was also
the 2nd-largest source of U.S. aluminum imports in 2017, accounting for 12.8
percent of all U.S. aluminum imports.
[714]
Although China was the world’s largest producer of primary aluminum, producing
over half the world’s supply in 2017, U.S. aluminum imports from China are
shipped mostly in the form of semifinished products such as bars, rods, and
wire.
[715]
Intellectual Property Rights, Technology Transfer,
and Innovation.
The United States and China have had longstanding consultations
on issues related to IPRs, technology transfer, and innovation, particularly
since China’s WTO accession and its acceptance of the WTO Trade-Related Aspects
of Intellectual Property Rights (TRIPS) Agreement.
[716]
On August 14,
2017, President Trump issued a memorandum directing USTR to conduct a section
301 investigation to determine whether any of China’s laws, policies,
practices, or actions might be unreasonable or discriminatory and might harm
American IPRs, innovation, or technology development.
[717]
USTR initiated
a section 301 investigation on August 18, 2017, and issued its report on March
22, 2018.
[718]
The investigation focused on whether the following practices were unreasonable
or discriminatory and whether they burdened or restricted U.S. commerce:
1.
China’s use of foreign ownership restrictions
2.
China’s regime of technology regulations regarding the terms of
licensing of technologies by U.S. companies to Chinese entities
3.
China’s facilitation of investment in and acquisition of U.S. companies
by Chinese companies
4.
China’s support of intrusions and theft from computer networks of U.S.
companies
[719]
For more information on this investigation and its findings
in 2018, see chapter 2.
In 2018, China had various plans and directives in place to
revise its laws and regulations protecting IPRs in accordance with TRIPS, and
has undertaken broad efforts to reorganize its intellectual property
responsibilities among its government agencies.
[720]
However, USTR
continued to find that China’s 2018 IPR protection and enforcement regime
presented serious barriers to U.S. exports and investment.
[721]
Given the
scope and scale of its reported IPR infringement activities, China remained on
USTR’s Priority Watch List in its
2019 Special 301 Report
.
[722]
The
Special 301 Report
did note some positive developments in 2018:
1.
As noted above, China reorganized its intellectual property
responsibilities among its government agencies. This included China’s creation
of a new State Administration for Market Regulation (SAMR) agency aimed at centralizing
its government’s enforcement responsibilities over patent and trademark
regulation.
[723]
2.
The Chinese government continued its process of judicial reforms in
2018, establishing a new appellate tribunal within the Supreme People’s Court
(SCP), the “SPC IP Court.”
[724]
3.
China proposed revisions to its existing intellectual property laws and
regulations.
[725]
Despite these developments in 2018, USTR claimed that China
has still not made fundamental structural changes to strengthen its system of
intellectual property protection and enforcement, has not fully opened its
market to foreign investment, has not allowed the market to play a decisive
role in allocating resources, and has not refrained from government
interference in private sector decisions about technology transfer.
[726]
On March 22, 2018, USTR released its
Findings of the
Investigation into China’s Acts, Policies, and Practices Related to Technology
Transfer, Intellectual Property, and Innovation under Section 301 of the Trade
Act of 1974
.
[727]
Of its main determinations, USTR found that some aspects pertaining to IPR
protection could be addressed through the WTO dispute settlement process.
[728]
On March 23,
2018, USTR filed a request for consultations with China at the WTO to address certain
Chinese laws and regulations pertaining to the protection of IPRs that the
United States alleges are inconsistent with China’s obligations under the TRIPS
Agreement. The WTO Dispute Settlement Body established a panel on November 21,
2018.
[729]
Rising Tariffs.
Based on the findings of
its section 301 investigation, and pursuant to the direction of the President,
USTR imposed an additional 25 percent tariff on approximately $50 billion worth
of select Chinese imports that were implemented in two different tranches
(installments). The first tranche was imposed on an estimated $34 billion of
U.S. imports from China (under 818 tariff subheadings) that entered the United
States for consumption on or after July 6, 2018, and the second tranche was
imposed on an estimated $16 billion of Chinese imports (under 279 tariff
subheadings) that entered the United States for consumption on or after August
23, 2018.
[730]
The top sectors that were subject to tariffs were aerospace, information and
communication technology, robotics, and machinery.
[731]
Following the imposition of U.S. tariffs on Chinese goods,
China imposed what its State Council Tariff Committee considered retaliatory
tariffs of 25 percent covering about $50 billion worth of select U.S. imports.
[732]
These were
implemented in two tranches, coinciding with the U.S. July 6, 2018, and August
23, 2018, implementation dates.
[733]
These tariffs affected U.S. exports to China
of various agricultural products (e.g. soybeans) and transportation products (e.g.,
vehicles, vessels).
[734]
On September 24, 2018, President Trump imposed an additional
tariff on what the White House estimated to impact approximately $200 billion
worth of Chinese imports.
[735]
Initially set at 10 percent, these tariffs were scheduled to increase to 25
percent by January 1, 2019.
[736]
In response, China announced that it would
raise tariffs on $60 billion in U.S. imports by 5 or 10 percent depending on
the product, effective September 24, 2018.
[737]
After the G20 meeting in November–December 2018, President Trump agreed to keep
tariffs at 10 percent on January 1, 2019, and China agreed to temporarily
suspend the imposition of tariffs on automotive vehicles and parts. That is,
whereas tariffs on these products were originally set to go into effect on
January 1, 2019, the Chinese government agreed to suspend them for an
additional three months.
[738]
Short-Term Agricultural Relief Programs
In response to increases in Chinese tariffs on U.S
agricultural exports, the U.S. Department of Agriculture (USDA) authorized $12
billion in programs to help U.S. agricultural producers weather an estimated
$11 billion in losses from disrupted markets.
According
to USDA, U.S. agricultural exports of soybeans, sorghum, livestock products
(e.g., milk, pork), and fruits and nuts appear to have been impacted the most
in 2018.
[739]
Moreover, since the U.S. tariffs were
imposed, USDA has identified unusually strict and cumbersome Chinese customs
entry procedures for U.S. agricultural exports, whose delays have affected the
marketability of perishable crops.
[740]
To address these issues, USDA initiated three short-term
relief programs. The first, called the Market Facilitation Program, provided
incremental payments to U.S. soybean, sorghum, corn, wheat, cotton, dairy, and
hog producers to help farmers manage the effects of disrupted markets. The
second, referred to as the Food Purchase and Distribution Program, purchased
unexpected surpluses of affected commodities (e.g., fruits, nuts, legumes,
beef, pork, and milk) and redistributed those products to food banks and other
charitable programs. Finally, USDA used its Trade Promotion Program to help
develop new export markets for U.S. products, which is administered through the
Foreign Agricultural Service. The combined cost of those programs was an
estimated $12 billion.
[741]
Monitoring Foreign Investment in the United States
Increasing concern has been expressed about the U.S.
national security implications of Chinese and other countries’ investment in
U.S. advanced technology companies. As a result, the Foreign Investment Risk
Review Modernization Act of 2018 (FIRRMA) was signed into law with the declared
aim of protecting critical American technology and intellectual property from
harmful foreign acquisitions.
[742]
FIRRMA was intended both to modernize the tools used for protecting critical
U.S. technology and to strengthen mechanisms already administered by the
Committee on Foreign Investment in the United States (CFIUS).
[743]
FIRRMA
has mandated expanded export control measures, requiring a U.S. interagency
process to identify and impose controls over the exportation of certain
“emerging and foundational technologies.”
[744]
As of 2018, FIRRMA (1) expanded the scope of what CFIUS can
investigate by redefining terms such as “critical technologies” and adding
certain new transactions, including real estate (for properties close to
military instillations), to what is reviewable; (2) modified CFIUS’s review
procedures to increase scrutiny of investments originating from countries of
special concern; and (3) required CFIUS to take specific actions within
prescribed deadlines for certain programs and for reporting requirements to
various Congressional committees. These 2018 revisions to CFIUS are considered
the most comprehensive changes made to the foreign investment review process since
2007.
[745]
The Administration is now using the expanded CFIUS mandate to address concerns
over Chinese state-directed investment in critical technologies.
[746]
In 2018, Canada was the United States’ second-largest
single-country trading partner after China, which is the same position it held
in 2017. U.S. two-way merchandise trade with Canada grew 6.1 percent to $617
billion in 2018 from $582 billion in 2017, accounting for 14.7 percent of total
U.S. merchandise trade with the world. The U.S. merchandise trade deficit with
Canada grew 15.8 percent to $19.7 billion in 2018, as U.S. imports rose by
$19.1 billion and U.S. exports rose by $16.5 billion (figure 6.5).
In 2018, Canada was the largest single-country export market
for U.S. goods, accounting for 18.0 percent of all U.S. merchandise exports to
the world. U.S. merchandise exports to Canada increased 5.8 percent from $282.3
billion in 2017 to $298.7 billion in 2018. The top U.S. exports to Canada
during 2018 were crude petroleum; civilian aircraft, engines, and parts; motor
vehicles—both for passengers and for goods transport—as well as their parts and
accessories; and light oils.
In 2018, Canada remained the third-largest single-country
import source for the United States, behind China and Mexico. U.S. merchandise
imports from Canada grew from $299.3 billion in 2017 to $318.4 billion in 2018,
a 6.4 percent increase. The top U.S. imports from Canada during 2018 were crude
petroleum; passenger motor vehicles and their parts and accessories; refined
petroleum products; natural gas; and coniferous wood and products. U.S.-Canada
merchandise trade data are shown in appendix tables A.39–A.42.
Canada remained the second-largest single-country U.S.
trading partner in services in 2018, following the United Kingdom. Two-way
cross-border services trade grew 9.4 percent from $90.8 billion to $99.3
billion in 2018, accounting for 7.4 percent of total U.S. services trade with
the world. U.S. cross-border services exports to Canada increased by $5.8
billion, or 10.1 percent, to $63.6 billion in 2018, while U.S. cross-border
services imports from Canada increased by $2.7 billion, or 8.2 percent, to
$35.6 billion. As a result, the U.S. surplus in services trade with Canada
increased to $28.0 billion from $24.9 billion the year before (figure 6.6).
The United States’ largest services exports in 2018 included
travel services ($18.2 billion), other business services ($14.2 billion), and
charges for intellectual property use ($8.5 billion) (table A.43). “Other
business services” were the fastest-growing services export, increasing by 27.8
percent compared to 2017. Major U.S. services imports from Canada were travel
services ($9.2 billion), other business services ($8.8 billion), and transport
($5.5 billion) (table A.44). Imports of charges for intellectual property use
($2.3 billion) was the fastest-growing services import, increasing by 37.5
percent since 2017. In terms of trade balance, the United States produced its
largest surpluses in travel services ($9.0 billion) and charges for
intellectual property use ($6.2 billion), with deficits in maintenance and
repair services ($0.3 billion) and telecommunications, computer, and
information services ($0.7 billion).
Figure
6.5
U.S. merchandise trade
with Canada, 2014–18
Source: USITC DataWeb/USDOC
(accessed May 9, 2019).
Note: Underlying data can be found
in appendix table
B.5
.
Figure
6.6
U.S. cross-border trade in
private services with Canada, 2014–18
Source: USDOC, BEA U.S.
International Transactions, Services, & IIP, International Transactions,
International Services, tables 2.2 and 2.3, and International Transactions,
table 3.2, June 20, 2019.
Note: Data for 2018 are preliminary.
Underlying data can be found in appendix table
B.7
.
Much of the U.S.-Canada trade relationship is governed by
the North American Free Trade Agreement (NAFTA). In 2018, negotiations to
modernize the agreement concluded after one year. On August 27, 2018, the
United States and Mexico reached a preliminary agreement in principle and, on
September 30, 2018, Canada and the United States reached agreement, along with
Mexico. On November 30, 2018, in Buenos Aires, Argentina, on the margins of the
G20 meeting, Canada, Mexico, and the United States signed the United
States-Mexico-Canada (USMCA) Agreement.
[747]
For more details about the USMCA, see chapter 5.
Canadian automotive exports to the United States were also
at issue in 2018. On May 23, 2018, USDOC initiated an investigation under
section 232 of the Trade Expansion Act to determine the effects on national
security of imports of automobiles, including cars, SUVs, vans and light
trucks, and automobile parts.
[748]
Canada’s Deputy Ambassador to the United States, Kirsten Hillman, provided
testimony at USDOC’s public hearing on July 19, 2018, stating that Canada-U.S.
auto trade does not pose a risk to U.S. national security.
[749]
In other 2018 developments, Canada joined other countries in
requesting WTO dispute settlement consultations with the United States and
imposing countermeasures on imports from the United States following the U.S.
imposition of tariffs on steel and aluminum products for national security
reasons. Also, the United States imposed antidumping and countervailing duties
on softwood lumber imports from Canada, and both sides signed a memorandum of
understanding on regulatory cooperation. These topics are discussed below.
Section 232 Steel and Aluminum Tariffs
Following investigations into the national security
implications of U.S. steel and aluminum imports under section 232 of the Trade
Expansion Act of 1962 (section 232), the President imposed a 25 percent ad
valorem tariff on imported steel from all countries except Canada and Mexico,
and a 10 percent ad valorem tariff on imported aluminum from all other
countries except Canada and Mexico, effective March 23, 2018.
[750]
Canada and
Mexico were exempted from the initial imposition of these tariffs for several
reasons. These included the two countries’ shared commitments to addressing
national security concerns and global excess capacity in steel; the economic
integration of the three countries, as well as the physical proximity of the
three countries’ industrial bases and the export of U.S. steel articles to
Canada and Mexico; and the close relation of U.S. economic welfare to national
security.
[751]
On April 30, 2018, the President issued two more proclamations, which extended
the initial tariff exemption deadline of May 1, 2018, for the EU, Canada, and
Mexico.
[752]
This extended exemption expired on June 1, 2018, however, and on that date, the
25 percent tariff on steel imports and the 10 percent tariff on aluminum
imports from Canada went into effect.
[753]
In response to these tariffs, Canada requested dispute
settlement consultations at the WTO on the same day they were imposed.
[754]
Canada also
imposed its own tariffs on imports of steel, aluminum, and other products from
the United States in the amount of $12.6 billion on July 1, 2018, deemed by
Canada to be equivalent to the 2017 value of Canadian exports affected by the
U.S. tariffs.
[755]
The United States requested WTO dispute settlement consultations with Canada on
the imposition of these additional duties on July 16, 2018, and a Dispute
Settlement Body (DSB) panel was established.
[756]
DSB panels were established for both WTO disputes on November 21, 2018.
[757]
In 2017, the last full year before tariffs were imposed, Canada
was the largest single-country source of U.S. steel imports, comprising 17.7
percent of all U.S. steel product imports.
[758]
Canada was also the largest source for U.S. aluminum imports, which comprised
38.5 percent of all U.S. aluminum imports.
[759]
Softwood Lumber
The United States-Canada Softwood Lumber Agreement (SLA) was
signed on October 12, 2006. In it, Canada agreed to apply certain export
charges and volume limits on its exports of softwood lumber to the United
States when the price of such products falls below certain thresholds.
Following several extensions, the 2006 SLA officially expired on October 12,
2015, and entered a one-year grace period when no trade remedy petition was
permitted, to allow for renegotiation of a new agreement. After the grace
period expired on November 25, 2016, the U.S. lumber industry petitioned the
Commission and USDOC for trade remedy investigations on imports of softwood
lumber from Canada.
[760]
On November 8, 2017, USDOC published its final affirmative
determinations in antidumping and countervailing duty investigations on
softwood lumber from Canada, and on December 7, 2017, USITC found that imports
of softwood lumber from Canada had caused material injury to U.S. softwood
lumber producers.
[761]
On January 3, 2018, USDOC amended its final affirmative determinations and
issued antidumping (AD) and countervailing duty (CVD) orders on softwood lumber
imports from Canada.
[762]
Subsequently Canada requested panel reviews of the USDOC and
Commission determinations in November and December 2017 and on January 19,
2018, under chapter 19 of the NAFTA.
[763]
Canada also filed disputes
under the WTO Dispute Settlement Understanding against the United States
regarding U.S. softwood lumber AD and CVD measures on November 28, 2017. After
consultations failed to resolve the disputes, Canada requested the
establishment of panels, and the WTO DSB established panels in both disputes on
April 9, 2018.
[764]
During 2018, the United States and Canada did not engage in negotiations toward
a new softwood lumber agreement.
Canada-United States Regulatory Cooperation Council
On June 4, 2018, U.S. and Canadian officials signed a
memorandum of understanding regarding the Canada-United States Regulatory
Cooperation Council (RCC).
[765]
The memorandum reaffirmed the principles and commitments of the RCC to deepen
regulatory cooperation and reduce, eliminate, or prevent unnecessary regulatory
differences between the two countries. The memorandum further stated that it
looks to promote economic growth, innovation, competitiveness, and job creation
through the elimination of unnecessary regulatory differences.
[766]
In the memorandum, the two sides set out their understanding
as to how the RCC participants would continue to operate as co-chairs of the
RCC’s governing council so as to provide strategic direction on regulatory
cooperation. This includes actions such as setting priorities and objectives to
focus on closer alignment of existing regulatory systems at the federal level;
ensuring that regulatory outcomes protect consumers, health, safety, security,
and the environment; and ensuring that cooperation initiatives do not
unnecessarily duplicate the mandates of existing agencies and departments. The
memorandum includes an annex that sets out the RCC’s objectives, principles,
and mandate. The annex also includes sections addressing regulatory
cooperation, including guidance in identifying sectors for increased alignment;
expression of a shared commitment to good regulatory practices; and information
about RCC membership, the RCC Secretariat, RCC meetings, roles in support of
the RCC, and stakeholder engagement.
[767]
Wine, Beer, and Spirits
According to USTR, market access barriers in several
Canadian provinces have hampered exports of U.S. wine and spirits to Canada for
many years.
[768]
Among these were measures governing the sale of wine in grocery stores
maintained by the provincial liquor board in British Columbia that appear to
provide advantages to British Columbian wine through an exclusive retail sales
channel not available to imported wines.
[769]
Consequently, the United States requested WTO dispute-settlement consultations
with Canada in two disputes. Its first dispute requested consultations on
January 18, 2017;
[770]
its second, on September 28, 2017.
[771]
A panel was established on July 20, 2018, in the latter dispute.
[772]
In an exchange of letters between Canadian Minister of
Foreign Affairs Chrystia Freeland and USTR Lighthizer on November 30, 2018,
Canada committed to ensure that British Columbia would stop its practice of
allowing only local wines to be stocked in supermarkets, addressing the U.S.
dispute in the WTO disputes, by no later than November 1, 2019. In exchange,
the United States agreed to take no further action at the WTO before this date.
[773]
In 2018, Mexico remained the United States’ third-largest
single-country merchandise trading partner, following China and Canada.
Merchandise trade between the two countries increased by 9.7 percent to $611.5
billion in 2018, accounting for 14.5 percent of U.S. trade with the world.
While both imports and exports increased in 2018, the U.S. merchandise trade
deficit with Mexico rose by $10.6 billion to $81.5 billion, since U.S. imports
from Mexico increased more than U.S. exports (figure 6.7).
Mexico remained the United States’ second-largest
single-country export market after Canada in 2018, accounting for 15.9 percent
of total U.S. exports to the world. U.S. merchandise exports to Mexico totaled
$265.0 billion, an increase of 8.9 percent from 2017. In 2018, leading U.S.
exports to Mexico included light oils, refined petroleum products, computer
parts and accessories, internal combustion diesel engines, semiconductors,
parts and accessories of bodies (including cabs) for motor vehicles, and
civilian aircraft, engines, and parts. The increase in the value of exports
from 2017 to 2018 appears to have been driven largely by increased exports of
oil and petroleum products.
Mexico was the United States’ second-largest single-country
import source in 2018 after China, accounting for 13.6 percent of U.S. total
imports. In 2018, U.S. merchandise imports from Mexico increased by 10.3
percent to $346.5 billion, driven mainly by the increased value of U.S. imports
of computers and crude petroleum. Leading U.S. imports from Mexico included
passenger motor vehicles, computers, crude petroleum, telecommunications
equipment, road tractors for semitrailers, color TV reception apparatus, and
insulated ignition wiring sets. U.S.-Mexico merchandise trade data are shown in
appendix tables A.45 through A.48.
In 2018, the U.S. cross-border trade surplus in services
with Mexico increased by 14.3 percent to $7.7 billion, largely as a result of
growing U.S. services exports (figure 6.8). U.S. exports of services to Mexico
rose 4.0 percent ($1.3 billion) to $33.4 billion in 2018, whereas U.S. services
imports from Mexico rose 1.2 percent to $25.7 billion. Mexico continued to be
the United States’ sixth-largest single-country trading partner for services in
2018, after the UK, Canada, China, Japan, and Germany.
In 2018, leading U.S. services exports to Mexico included travel
services, transport, and charges for intellectual property use (table A.49).
Leading U.S. services imports from Mexico included travel services; transport;
other business services; and telecommunications, computer, and information
services (table A.50). Travel services was the largest services category for
both imports and exports, accounting for 67.7 percent and 53.6 percent of U.S.
imports and exports of services, respectively, in 2018.
Figure
6.7
U.S. merchandise trade
with Mexico, 2014–18
Source: USITC DataWeb/USDOC
(accessed May 28, 2019).
Note: Underlying data can be found in
appendix table
B.5
.
Figure
6.8
U.S. cross-border trade in
private services with Mexico, 2014–18
Source: USDOC, BEA U.S.
International Transactions, Services, & IIP, International Transactions,
International Services, tables 2.2 and 2.3, and International Transactions,
table 3.2, June 20, 2019.
Note: Data for 2018 are preliminary.
Underlying data can be found in appendix table
B.7
.
Most of the U.S.-Mexico trade relationship is governed by
NAFTA, which came into force January 1, 1994. On August 16, 2017, negotiations
between the United States, Canada, and Mexico to modernize NAFTA started in
Washington, DC. On November 30, 2018, the United States, Canada, and Mexico
signed the United States-Mexico-Canada Agreement (USMCA). These negotiations
are described in chapter 5.
Mexican automotive exports to the United States were also at
issue in 2018. On May 23, 2018, USDOC initiated an investigation under section
232 of the Trade Expansion Act to determine the effects on national security of
imports of automobiles, including cars, SUVs, vans and light trucks, and
automobile parts.
[774]
The Mexican Ambassador to the United States, Gerónimo Gutiérrez Fernández,
provided testimony at USDOC’s public hearing on July 19, 2018, stating that
U.S. imports of vehicles and auto parts from Mexico do not threaten U.S.
national security.
[775]
The following section describes major U.S.-Mexico trade
developments in 2018, including U.S. government tariffs on aluminum and steel
imports from Mexico, work to modernize U.S.-Mexico border crossings, and recent
results related to NAFTA’s cross-border trucking provisions. In a long-running
WTO dispute involving Mexico’s complaint about U.S. dolphin-safe labeling
provisions for tuna and tuna products, the WTO DSB issued a report on
compliance proceedings in 2018, bringing the case to an end.
[776]
The Appellate
Body report upheld all aspects of the previous panels’ legal and factual
analysis that Mexico appealed—in particular the panels’ findings that the
dolphin-safe labeling measure was not inconsistent with U.S. WTO obligations.
This dispute is described in more detail in chapter 3.
Section 232 Steel and Aluminum Tariffs
Following investigations into the national security implications
of U.S. steel and aluminum imports under section 232 of the Trade Expansion Act
of 1962, the White House imposed a 25 percent ad valorem tariff on imported
steel from all countries except Canada and Mexico, and a 10 percent ad valorem
tariff on imported aluminum from all other countries except Canada and Mexico,
effective March 23, 2018.
[777]
As noted earlier, Canada and Mexico were exempted from the initial imposition
of these tariffs because of shared commitments to addressing national security
concerns and global excess capacity in steel; the economic integration of the
three countries; the physical proximity of the three countries’ industrial
bases; the export of U.S. steel articles to Canada and Mexico; and the close
relation of U.S. economic welfare to national security.
[778]
On April
30, 2018, the President issued two more proclamations, which extended the
initial tariff exemption deadline of May 1, 2018, for the EU, Canada, and
Mexico.
[779]
This extended exemption expired on June 1, 2018, however, and on that date, the
25 percent tariff on steel imports and the 10 percent tariff on aluminum
imports from Mexico went into effect.
[780]
In response to the tariffs, on June 5, 2018, the Mexican
government suspended NAFTA preferential duty rates on U.S. products classified
under 71 subheadings of the international Harmonized System (HS) of tariff
classification, 50 of which correspond to various steel products. Retaliatory tariffs
imposed by Mexico range up to 25 percent, and included agricultural and food
products, as well as steel and aluminum.
[781]
At the same time, Mexico challenged the U.S. measures by
filing a dispute under the WTO dispute settlement provisions. On June 5, 2018,
Mexico requested consultations with the United States on certain measures
imposed by the United States, allegedly to adjust imports of steel and aluminum
into the United States.
[782]
Mexico claimed that the measures appear to be inconsistent with WTO
obligations.
[783]
On July 16, 2018, the United States requested WTO dispute settlement
consultations with Mexico on the imposition of the additional duties, and a
panel was established.
[784]
In 2017, the last full year before tariffs were imposed,
Mexico was the third-largest single-country source of U.S. steel product
imports, supplying 8.6 percent of all U.S. steel product imports.
[785]
Mexico was the
seventh-largest source for U.S. aluminum imports in 2017, supplying 2.8 percent
of all U.S. aluminum imports.
[786]
Modern Borders
In 2018, the United States and Mexico continued to make
progress on cross-border improvements. In April 2017, officials of U.S. Customs
and Border Protection and Mexico’s Tax Administration Service (SAT) met in
Mexico City to advance the development of customs practices in both the United
States and Mexico.
[787]
Their intent was to enhance bilateral work in trade and travel facilitation;
continue to cooperate on innovative approaches to cargo inspection for faster
goods flow; and improve the efficiency of their customs processes to manage
risk and to reduce processing times and transactional costs.
[788]
To improve
cargo inspection, a pilot program known as Unified Cargo Processing was put
into action.
[789]
The U.S. Department of Homeland Security regarded the pilot as successful; upon
its implementation at the Mariposa port of entry in Nogales, Arizona, in July
2016, wait times were significantly reduced for both U.S. and Mexican
businesses.
[790]
Due to its success in Nogales, the Unified Cargo Processing
pilot program was expanded to include the Otay Mesa Cargo Facility in San Diego
County, California. In an announcement on September 20, 2017, the U.S.
Department of Homeland Security introduced the program’s aims of ending
separate inspections and reducing wait times at the border.
[791]
In 2018, the
U.S. General Services Administration (GSA) continued to modernize and expand
the facility by doubling the number of pedestrian processing facilities from 6
to 12 lanes to accommodate a new transit hub.
[792]
Recent GSA efforts to modernize ports of entry include the
Calexico Land Port of Entry, which was built in 1974 and is the main border
crossing linking the Imperial Valley agricultural industry to the Mexican state
of Baja California. In 2018, GSA completed phase 1 of the facility’s
modernization and expansion plan. This phase involved the creation of new
pedestrian and privately owned vehicle inspection facilities and the expansion
of the port’s facility for commercial inspections. This first phase of the
project, which included 10 new northbound vehicle-processing lanes, opened in
September 2018.
[793]
Cross-Border Trucking between the United States and Mexico
Chapter 12 of NAFTA states that Mexican trucks are to be
allowed to provide cross-border truck services throughout the United States
beginning in 2000. However, the beginning of such services was delayed because
of U.S. safety concerns. To address these concerns, the U.S. Department of
Transportation and the Federal Motor Carrier Safety Administration (FMCSA)
launched the U.S.-Mexico Cross-Border Long-Haul Trucking Pilot Program on
October 14, 2011.
[794]
The pilot program concluded on October 10, 2014.
[795]
On January 15,
2015, FMCSA began accepting applications from Mexico-domiciled motor carriers
interested in conducting long-haul operations beyond the U.S. commercial zones.
[796]
In 2018, reports from FMCSA indicated that motor carriers
that were either owned by Mexicans or domiciled in Mexico continued to operate
safely on U.S. roads. If enacted, the United States-Mexico-Canada Agreement would
enable the United States to restrict the number of authorizations of
Mexican-domiciled carriers to provide cross-border long-haul truck services
into the United States in the event of “material harm” to U.S. trucking
suppliers, operators, and drivers.
[797]
In 2018, Japan remained the United States’ fourth-largest single-country
trading partner in terms of two- way trade, accounting for 5.2 percent of total
U.S. merchandise trade. U.S. merchandise trade with Japan increased 6.6
percent, from $204.1 billion in 2017 to $217.6 billion in 2018. At the same
time, the U.S. merchandise trade deficit with Japan declined by $1.2 billion in
2018 to $67.6 billion. The decrease in the bilateral merchandise trade deficit
was attributable to a $7.4 billion increase in U.S. exports to Japan and a
corresponding $6.1 billion increase in U.S. imports from Japan (figure 6.9).
Japan remained the fourth-largest destination for U.S.
merchandise exports in 2018, accounting for 4.5 percent of global U.S. exports.
Between 2017 and 2018, U.S. exports to Japan increased 10.9 percent, from $67.6
billion in 2017 to $75.0 billion in 2018. Leading U.S. exports to Japan were
civilian aircraft, engines, and parts; liquefied propane; corn; semiconductor
manufacturing machines; and medicaments.
Japan remained the fourth-largest source of U.S. merchandise
imports in 2018, accounting for 5.6 percent of global U.S. imports. The value
of U.S. imports from Japan increased 4.5 percent in 2018, from $136.5 billion
in 2017 to $142.6 billion in 2018. Leading U.S. imports from Japan were
passenger motor vehicles, parts for airplanes or helicopters, motor vehicle
gearboxes, and parts for printers. U.S.-Japan merchandise trade data are shown
in appendix tables A.51–A.54.
Japan remained the United States’ fourth-largest
single-country services trading partner in 2018, representing $74.8 billion, or
5.5 percent of U.S. services trade. U.S. cross-border services exports to Japan
fell by $0.8 billion, or 1.8 percent, to $44.4 billion in 2018, while U.S.
cross-border services imports from Japan increased by $1.4 billion, or 4.8
percent, to $30.4 billion. As a result, the U.S. surplus in services trade with
Japan declined to $14.0 billion from $16.2 billion the year before (figure
6.10).
The United States’ largest services exports in 2018 included
travel services ($10.3 billion), transport ($9.8 billion), and other business
services ($7.7 billion) (table A.55). Maintenance and repair services ($1.5
billion) made up the fastest-growing service export, increasing by 17.3 percent
compared to 2017. Major U.S. services imports from Japan were charges for
intellectual property use ($11.8 billion), transport ($9.2 billion), and
government goods and services ($4.3 billion) (table A.56). Imports of financial
services ($1.6 billion) increased by 15.8 percent in 2018. In terms of two-way
trade, the United States produced its largest surpluses in travel services ($6.7
billion) and other business services ($4.2 billion), with deficits in charges
for intellectual property use ($5.2 billion) and government goods and services
($3.6 billion).
Figure
6.9
U.S. merchandise trade
with Japan, 2014–18
Source: USITC DataWeb/USDOC
(accessed May 9, 2019).
Note: Underlying data can be found in
appendix table
B.5
.
Figure
6.10
U.S. cross-border trade
in services with Japan, 2014–18
Source: USDOC, BEA U.S.
International Transactions, Services, & IIP, International Transactions,
International Services, tables 2.2 and 2.3, and International Transactions,
table 3.2, June 20, 2019.
Note: Data for 2018 are preliminary.
Underlying data can be found in appendix table
B.7
.
In 2017, the United States withdrew from the Trans-Pacific
Partnership
[798]
—a
proposed free trade agreement among 12 Asia/Pacific countries, including the
United States and Japan.
Japanese automotive exports to the United States were at
issue in 2018. On May 23, 2018, USDOC initiated an investigation under section
232 of the Trade Expansion Act to determine the effects on national security of
imports of automobiles, including cars, SUVs, vans and light trucks, and
automobile parts.
[799]
Kazutoshi Aikawa, a representative of the Government of Japan, provided
testimony at USDOC’s public hearing on July 19, 2018. In his testimony, Mr.
Aikawa stated that Japanese automotive exports to the United States do not
threaten or impair the U.S. auto industry or national security.
[800]
President Trump and Prime Minister Shinzo Abe of Japan agreed
to initiate bilateral negotiations for a U.S.-Japan Trade Agreement in
September 2018. In a joint statement, the two sides agreed to start
negotiations towards an agreement on goods and services “that can produce early
achievements.” After these discussions have been completed, they agreed that
the two countries will tackle other trade and investment topics. Both leaders
agreed to respect the positions of the other with respect to desired outcomes,
as follows: for the United States, “market access outcomes in the motor vehicle
sector” will increase U.S. motor vehicle production and jobs; and for Japan,
“with regard to agricultural, forestry, and fishery products, outcomes related
to market access as reflected in Japan’s previous economic partnership agreements
constitute the maximum level.”
[801]
In October, USTR officially notified Congress of the
Administration’s intent to initiate negotiations on a trade agreement with
Japan.
[802]
After notifying Congress, USTR published a notice in the
Federal Register
seeking public comment and announcing it would hold a public hearing in
December 2018 on the proposed U.S.-Japan trade agreement.
[803]
Following
the public hearing, USTR published its negotiating objectives in December 2018.
[804]
In this document, USTR noted that it may seek to pursue negotiations with Japan
in stages, which would be different from past U.S. trade negotiations, which
involved one comprehensive negotiation.
[805]
In 2018, the United States and Japan coordinated efforts to
address trade issues of common interest. For example, the United States and
Japan, along with the EU, held trilateral meetings in 2018 to discuss policy
measures to address nonmarket economic issues including global excess capacity
and forced technology transfer.
[806]
The third meeting of the U.S.-Japan Economic Dialogue was convened in Tokyo in
November 2018, with discussions focusing on expanding further trade and
investment between Japan and the United States.
[807]
Additionally,
the United States and Japan worked to advance issues related to digital trade
within the Asia-Pacific Economic Cooperation and WTO.
[808]
Furthermore,
several trade developments related to agricultural products, passenger motor
vehicles, and pharmaceuticals occurred between Japan and the United States in
2018.
Section 232 Steel and Aluminum Tariffs
Following investigations into the national security
implications of U.S. steel and aluminum imports under section 232 of the Trade
Expansion Act of 1962, the President imposed a 25 percent ad valorem tariff on
imported steel from all countries except Canada and Mexico, and a 10 percent ad
valorem tariff on imported aluminum from all other countries except Canada and
Mexico, effective March 23, 2018.
[809]
Japan was among the countries affected by these tariffs on steel and aluminum.
In response to the new U.S. tariffs, on May 18, 2018, Japan notified the WTO of
its intent to impose retaliatory tariffs on U.S. products.
[810]
However, Japan
did not initiate WTO proceedings or impose retaliatory tariffs in 2018.
In 2017, Japan was the sixth-largest single-country source
of U.S. steel imports, supplying 5.7 percent of all U.S. steel product imports.
[811]
Japan was also
the 15th-largest source of U.S. aluminum imports, supplying 1.0 percent of all
U.S. aluminum imports.
[812]
Agricultural Products
Historically, Japan has served as a top export market for
U.S. agricultural products. In 2018, Japan maintained its status as the
third-largest single-country market for U.S. agricultural goods.
[813]
U.S.
agricultural exports to Japan increased by 8.4 percent, totaling $12.9 billion
in 2018.
[814]
Recent U.S.-Japan agricultural trade developments include a reduction in
Japan’s safeguard tariff on imports of frozen beef and the reopening of the
Japanese market to U.S. lamb and goat meat exports.
Japan’s 2018 tariff reduction followed a tariff increase the
year before. In August 2017, Japan increased its duty on imports of frozen beef
from 38.5 percent to 50 percent after imports exceeded the volume level
established by Japan’s special safeguard (SSG) measure. Frozen beef exporters
in countries with economic partnership agreements (EPAs) with Japan were
exempted from the safeguard tariff and able to export frozen beef below the SSG
rate. At the beginning of the Japanese fiscal year in April 2018, Japan reset
its safeguard mechanism and reduced its tariff on frozen beef imports back to
38.5 percent. However, the Japanese government has announced its intention to
maintain its volume-triggered safeguard mechanism for countries without an EPA,
including the United States.
[815]
In 2018, Japan was the third-largest destination for U.S. frozen beef exports,
totaling $560 million.
[816]
In addition to reducing the tariff on frozen beef to
pre-safeguard levels, Japan reopened its market to U.S. sheep and goat meat
exports in July 2018, following working-level meetings of the U.S.-Japan
Economic Dialogue.
[817]
Japan had banned U.S. exports of sheep and goat for more than 14 years after
bovine spongiform encephalopathy (popularly known as “mad cow disease”) was
detected in the United States in 2003. In 2018, Japan imported $200.9 million
in sheep and goat meat, with 97 percent of imports originating from Australia
and New Zealand.
[818]
U.S. exports of sheep and goat meat totaled $352,600, representing less than
0.002 percent of Japan’s total imports of these meats.
[819]
Several market access issues continued to affect U.S.
agricultural exports to Japan in 2018. For example, in 2017, Japan’s Consumer
Affairs Agency expanded its requirements for country of origin labeling (COOL)
to include main ingredients in processed foods manufactured in Japan. Although
the new requirements were subject to a transition period ending in 2022, the
United States raised concerns with Japan in 2018 that new COOL requirements may
adversely affect U.S. exports of food ingredients to Japan.
[820]
Japan also
continues to operate a tariff-rate quota (TRQ) of 682,200 metric tons for
imported rice. USTR maintains that Japan’s rice TRQ inhibits U.S. rice
producers from accessing final consumers in Japan.
[821]
USTR has also
identified Japan’s state-operated wheat import system and its “gate price
mechanism” for pork as ongoing barriers to U.S. agricultural exports.
[822]
Passenger Motor Vehicles
Passenger motor vehicles make up
a significant share of two-way trade between Japan and the United States. In
2018, the United States exported $623.0 million worth of passenger motor
vehicles to Japan while importing $40.4 billion. The United States has
consistently experienced large deficits in passenger motor vehicle trade with
Japan, reaching $39.8 billion in 2018.
[823]
Although Japan has no auto tariffs, U.S. industry says there are significant
nontariff barriers which serve as a barrier to market access for U.S. passenger
motor vehicle producers.
[824]
These barriers include standards and testing protocols that are unique to the
Japanese market, a lack of transparency about the process of developing
Japanese regulations, and policies that hinder the
development of distribution and service
networks for U.S. passenger motor vehicles in Japan.
[825]
USTR has identified improving market access opportunities in
Japan’s automotive sector as a key objective for a trade agreement with Japan.
As part of its list of negotiating objectives released in December 2018, USTR
has announced intentions to negotiate “securing additional provisions as
necessary to obtain fair and more equitable trade in the motor vehicle sector.”
[826]
Pharmaceutical Products
Introduced in 2010, Japan’s Price Maintenance Premium is a
program designed to accelerate the introduction of innovative drugs to the Japanese
market.
[827]
In 2018, the government of Japan introduced reforms altering the requirements
for drug producers to qualify for the premium. USTR has cited these changes as
a potential trade barrier for U.S. pharmaceutical companies. New requirements
for local clinical trials and product launches appear to favor Japanese
companies while excluding small and medium-sized U.S. pharmaceutical companies
from receiving the premium.
[828]
According to the most recent data from Japan’s Ministry of Health, Labour, and
Welfare, U.S.-origin pharmaceuticals made up 20 percent of Japan’s $95 billion
pharmaceutical market. However, changes to the pricing system are expected to
negatively affect the growth of Japan’s pharmaceutical market.
[829]
South Korea continued to be the United States’ sixth-largest
single-country merchandise trading partner in 2018. Two-way merchandise trade
was valued at $130.6 billion, up from $119.8 billion in 2017. The share of U.S.
trade with South Korea remained unchanged from previous years, at 3.1 percent
of U.S. trade with the world. The United States recorded a trade deficit of
$17.9 billion with South Korea in 2018, a 22.6 percent decrease from the $23.1
billion deficit in 2017, as U.S. exports to South Korea increased by $8.0
billion and U.S. imports from South Korea increased by $2.8 billion (figure
6.11). The U.S. combined goods and services trade deficit with South Korea has
decreased for the third year in a row, reaching $5.4 billion in 2018. This is
the same value as the trade deficit in 2011, the year before the U.S.-Korea
Free Trade Agreement (KORUS) entered into force.
[830]
U.S. merchandise exports to South Korea were valued at $56.3
billion in 2018, up 16.6 percent from 2017. Leading U.S. exports to South Korea
were crude petroleum; machines for the manufacture of semiconductor devices or
electronic integrated circuits; civilian aircraft, engines, and parts; semiconductors;
liquefied propane; and corn. Crude petroleum was among the top U.S. exports to
South Korea for the second year in a row; it was also the fastest growing,
spiking 410.4 percent in value from $1.1 billion in 2017 to $5.6 billion in
2018.
[831]
Beef exports represented the fifth-largest U.S. export to South Korea, with a
total value of $1.7 billion in 2018, up 43.6 percent from $1.2 billion in 2017.
[832]
South Korea is
the second-largest export market for U.S. beef after Japan, accounting for
about 21.2 percent of U.S. beef exports in 2018. Passenger motor vehicles were
another top export to South Korea in 2018, growing from $1.5 billion in 2017 to
$1.7 billion in 2018.
[833]
Exports of all passenger motor vehicles combined are the United States’
sixth-largest export to South Korea.
U.S. merchandise imports from South Korea totaled $74.2
billion in 2018, increasing 3.9 percent ($2.7 billion) from 2017. U.S. imports
of passenger motor vehicles, the top import from South Korea, declined to $13.8
billion in 2018, down $1.9 billion (12.1 percent) from 2017. Other top U.S.
imports from South Korea included computer parts and accessories, cellphones,
refined petroleum products, and immunological products. U.S.-South Korea
merchandise trade data are shown in appendix tables A.57–A.60.
In 2018, South Korea was the United States’ ninth-largest
single-country services trading partner in terms of two-way trade. U.S.
cross-border services exports to South Korea decreased 6.7 percent in 2018 to
$21.9 billion. U.S. cross-border services imports from South Korea increased in
2018, by 7.0 percent, to reach $9.9 billion. As a result, the U.S. services
trade surplus with South Korea fell from $14.3 billion in 2017 to $12.0 billion
in 2018, a decline of 15.6 percent (figure 6.12).
In 2018, leading U.S. services exports to South Korea
included travel services ($9.4 billion), charges for intellectual property use
($5.0 billion), transport ($2.7 billion), and other business services ($1.6
billion) (table A.61). All four of these services exports categories
experienced declines from 2017. Leading U.S. services imports from South Korea
include transport ($6.5 billion), travel services ($1.5 billion), and other
business services ($956 million) (table A.62). Both transport and travel
services exports increased from 2017 to 2018, by 7.4 and 16.4 percent,
respectively.
Figure
6.11
U.S. merchandise trade
with South Korea, 2014–18
Source: USITC DataWeb/USDOC
(accessed May 9, 2019).
Note: Underlying data can be found in
appendix table
B.5
.
Figure
6.12
U.S. cross-border trade
in private services with South Korea, 2014–18
Source: USDOC, BEA U.S.
International Transactions, Services, & IIP, International Transactions,
International Services, tables 2.2 and 2.3, and International Transactions,
table 3.2, June 20, 2019.
Note: Data for 2018 are preliminary.
Underlying data can be found in appendix table
B.7
.
Several high-level meetings on issues of bilateral trade
between the United States and South Korea took place in 2018. Most notably,
President Trump and South Korean President Moon Jae-in met on September 24,
2018, in New York to sign the modifications to the KORUS agreement.
[834]
This followed
two other meetings in Washington, DC, one between U.S. Trade Representative
Lighthizer and Trade Minister Kim Hyun-chong on July 31, 2018, and the other
between U.S. House Committee Foreign Affairs Chairman Ed Royce and South Korean
Minister of Trade, Industry, and Energy Paik Ungyu on July 1, 2018. At both
meetings, South Korea expressed views on why South Korean automobile exports
should be exempt from potential tariffs under section 232 of the U.S. Trade
Expansion Act.
[835]
On July 19, 2018, the South Korean Deputy Minister for Trade, Kang Sung-Cheon,
also provided similar testimony at USDOC’s hearing on the section 232
investigation of automotive imports.
[836]
At the end of 2018, this section 232 investigation was still in progress.
[837]
Three different WTO disputes involving the United States and
South Korea were active in 2018. Two of these disputes were in response to the
safeguard actions that the United States took in response to imports of large
residential washers (DS546) and of crystalline silicon photovoltaic products
(DS545).
[838]
Panels were established for both disputes on September 26, 2018, but neither
had been composed as of yearend 2018.
[839]
In
the third active 2018 WTO dispute, South Korea requested consultations with the
United States on February 14, 2018, in a dispute concerning several issues
related to U.S. antidumping and countervailing duty measures across two
countervailing duty proceedings and six antidumping proceedings (DS539). A
panel was established by the Dispute Settlement Body on May 28, 2018, and was
composed on December 5, 2018. However, no further actions have been taken since
then.
[840]
On June 4, 2018, the USDOC concluded its section 129 investigation on large
residential washers from South Korea, revising its final countervailing duty
analysis in accordance with WTO Dispute Settlement Panel and Appellate Body
Panel reports.
[841]
For more information on these WTO disputes, see chapter 3.
Section 232 Steel and Aluminum Tariffs
Following investigations into the national security
implications of U.S. steel and aluminum imports under section 232 of the Trade
Expansion Act of 1962, the President imposed a 25 percent ad valorem tariff on
imported steel from all countries except Canada and Mexico, and a 10 percent ad
valorem tariff on imported aluminum from all other countries except Canada and
Mexico, effective March 23, 2018.
[842]
Through negotiations that took place alongside those involving KORUS (see
below), South Korea received an exemption for its steel products before the
tariff took effect, while discussions on a satisfactory alternative solution to
addressing the threatened impairment to U.S. national security by steel imports
from South Korea continued.
[843]
At the conclusion of these discussions, South Korea agreed to an absolute
annual quota for its exports of 54 subcategories of steel to the United States.
The quota was effective on May 1, 2018, and is equivalent to 70 percent of the
United States’ average import volume of steel from South Korea from 2015–17.
[844]
On May 31,
2018, the quota was modified to be measured on a quarterly basis, effective
July 1, 2018.
[845]
South Korea was the second-largest single-country source for
U.S. imports of steel in 2017 behind Canada, supplying 9.6 percent of U.S.
steel imports.
[846]
South Korea is a less important source of U.S. imports of aluminum; in 2017 it
was the 20th-largest single-country supplier of aluminum to the United States.
[847]
The 10 percent
tariff on U.S. imports of aluminum from South Korea is still in effect as of
August 2019.
U.S.-Korea FTA
The process to renegotiate KORUS began with a formal
notification to South Korea from USTR Lighthizer on July 12, 2017, calling for
a special session of the KORUS Joint Committee. Two special sessions were
convened in 2017: one on August 22 in Seoul, and one on October 4 in
Washington, DC.
[848]
Negotiations for KORUS began on January 5, 2018.
[849]
Following a
series of ministerial-level talks throughout the spring and summer of 2018, the
agreement was signed by South Korea and the United States on September 24,
2018. The KORUS modifications entered into force on January 1, 2019.
[850]
For more
information on KORUS negotiations, see chapter 5.
Bilateral developments under the KORUS agreement have
continued into 2019. On March 15, 2019, USTR requested its first-ever
consultations with South Korea under KORUS Chapter 16 on Competition-Related
Matters. In its request, the United States expressed its concerns over
competition hearings held by the Korea Fair Trade Commission (KFTC).
[851]
With a mandate
that includes promoting competition and strengthening consumers’ rights, KFTC
can conduct investigations of companies and levy fines for violations and
failure to cooperate with investigators. Several U.S. firms have raised
concerns that KFTC’s procedures do not comply with South Korea’s obligations
under KORUS. According to these firms, KFTC’s procedures inhibit the ability of
companies to adequately defend themselves during proceedings and hearings by
denying them the opportunity to review and rebut the evidence against them.
[852]
South Korea has sought to address these concerns with
changes to procedures governing access to evidence. These changes were set
forth in amendments to the Monopoly Regulations and Fair Trade Act, which was
submitted to the South Korean National Assembly in December 2018. The United
States did not find that these amendments resolved its concerns, however, and
submitted its consultation request as a result.
[853]
Oil-related Exports
U.S. exports of crude petroleum to South Korea quintupled in
value in 2018, growing from $1.1 billion in 2017 to $5.6 billion in 2018.
[854]
This upsurge
stemmed from a number of factors, including an increase in U.S. production of
crude petroleum as well as trade diversion due to the Chinese response to U.S.
tariffs under its section 301 investigation.
The increase in production was an important factor, given
that the United States produced 17.5 percent more crude petroleum in 2018 than
in the previous year, averaging 11.0 million barrels a day.
[855]
The majority
of crude petroleum produced in the United States comes from the U.S. Gulf Coast
states. However, most refineries in the region are configured to process
primarily heavy sour crudes, which have a higher density and sulfur content
than the light sweet crudes produced nearby. As a result of this mismatch
between the type of crude petroleum produced in the Gulf Coast and the local
refinery configurations, as well as limited pipeline infrastructure for
supplying refineries in other regions, a large portion of the United States’
supply of light sweet crude was exported.
[856]
China was the largest Asian single-country destination
market for U.S. crude petroleum in the first half of 2018.
[857]
However, China
stopped importing crude petroleum from the United States from August to October
2018. This coincided with China’s announcement of its proposed “first tranche”
list of U.S. goods potentially subject to increased Chinese tariffs as part of
the China-U.S. section 301 dispute; U.S. crude oil was initially included on
this list.
[858]
As U.S. exports of crude petroleum to China fell, exports to
other Asian economies increased in the latter half of 2018. Out of all the
Asian markets, South Korea, home to some of the largest and most advanced oil
refineries in the world (including refineries capable of handling light sweet crudes),
received the largest share of these increased exports.
[859]
Overall, South
Korea was the largest single-country destination in Asia for U.S. crude
petroleum exports in 2018, and was second only to Canada in terms of total
import volume of U.S. crude petroleum in 2018.
[860]
In 2018, India was the United States’ ninth-largest
single-country trading partner based on two-way merchandise trade, a position
it has maintained since 2016. U.S. two-way merchandise trade with India increased
by 17.8 percent to $87.1 billion in 2018. India’s share of total U.S.
merchandise trade with the world for 2018 was 0.2 percent higher than 2017 at
2.1 percent. U.S. exports to India rose significantly in 2018, shrinking the
U.S. merchandise trade deficit with India by 7.6 percent to $20.9 billion in
2018 (figure 6.13).
U.S. merchandise exports to India increased 28.9 percent in
2017–18, from $25.7 billion to $33.1 billion. Leading U.S. exports to India in
2018 were nonindustrial diamonds; crude petroleum; civilian aircraft, engines,
and parts; nonmonetary gold; and bituminous coal. While U.S. exports of gold
decreased by $443 million (or 18.6 percent) in 2018, most other U.S. exports
increased, including those of crude petroleum, which experienced a nearly
fivefold increase to $3.0 billion.
U.S. merchandise imports from India increased by 11.8
percent in 2018 to $54.0 billion. Leading U.S. imports from India in 2018 were
nonindustrial diamonds,
[861]
certain medicaments, frozen shrimp, light oils, and gold jewelry. U.S.-India
merchandise trade data are shown in appendix tables A.63 through A.66.
India is the United States’ seventh-largest single-country
services trading partner, based on two-way cross-border services trade, with
total services trade increasing 5.7 percent to $54.3 billion in 2018. India is
1 of only 2 among the top 20 services trading partners with which the United
States had a services trade deficit in 2018 (the other was Italy). This trade
deficit has been decreasing since 2015, and this trend continued in 2018, when
the deficit dipped by 0.6 percent to $4.8 billion (figure 6.14).
Leading U.S. services exports to India included travel
services ($14.4 billion), charges for intellectual property use ($3.4 billion),
and transport ($1.8 billion) (table A.67). However, the largest growth in
services exports was in maintenance and repair services, which grew 27.6
percent from $0.7 billion in 2017 to $0.8 billion in 2018. Leading U.S.
services imports from India included telecommunications, computer, and
information services ($15.3 billion); other business services ($8.5 billion);
and travel services ($3.3 billion) (table A.68). Imports of financial services
dropped 21.4 percent, while imports of charges for intellectual property use
increased by 57.1 percent from $781 million in 2017 to $1.2 billion in 2018.
Figure
6.13
U.S. merchandise trade
with India, 2014–18
Source: USITC DataWeb/USDOC
(accessed May 9, 2019).
Note: Underlying data can be found
in appendix table
B.5
.
Figure
6.14
U.S. cross-border trade
in private services with India, 2014–18
Source: USDOC, BEA U.S.
International Transactions, Services, & IIP, International Transactions,
International Services, tables 2.2 and 2.3, and International Transactions,
table 3.2, June 20, 2019.
Note: Data for 2018 are preliminary.
Underlying data can be found in appendix table
B.7
.
Among the important U.S.-India trade developments of 2018
were the issuance of the United States’ first-ever counternotifications at the
WTO, the imposition of section 232 tariffs on steel and aluminum, and the GSP eligibility
review of India. These topics are discussed in detail below. Unlike in prior
years, the annual U.S.-India Trade Policy Forum did not take place in 2018. U.S.
and Indian officials met in New Delhi on April 11–12 to discuss the section 232
tariffs on U.S. imports of steel and aluminum from India and the WTO dispute
over export subsidies.
[862]
There were several active WTO dispute settlement proceedings
involving the United States and India in 2018. In March 2018, the United States
requested dispute settlement consultations with India about alleged export
subsidy measures, and in May 2018, it requested the establishment of a panel.
[863]
Specifically,
USTR argued that various export promotion schemes provide benefits to Indian
exporters that allow them to sell their goods in the United States more
cheaply, adversely affecting U.S. manufacturers and workers.
[864]
There were
also developments in a dispute involving U.S. measures related to the renewable
energy sector where India was the complainant against the United States.
[865]
On May 4,
2018, the United States submitted a counternotification
[866]
to the WTO
Committee on Agriculture (COA) regarding India’s price support for wheat and
rice,
[867]
and on November 13, 2018, the United States submitted a counternotification to
the COA on India’s market price support for cotton.
[868]
Section 232 Steel and Aluminum Tariffs
Following investigations into the national security
implications of U.S. steel and aluminum imports under section 232 of the Trade
Expansion Act of 1962, the President imposed a 25 percent ad valorem tariff on
imported steel from all countries except Canada and Mexico, and a 10 percent ad
valorem tariff on imported aluminum from all other countries except Canada and
Mexico, effective March 23, 2018.
[869]
On May 18, 2018, India requested dispute settlement consultations with the
United States at the WTO in response. After consultations failed to resolve the
dispute, India requested that the DSB establish a panel, and on December 4,
2018, the DSB established a panel.
[870]
In 2017, India was the 11th-largest single-country source of
U.S. steel imports, supplying 2.6 percent of all U.S. steel product imports.
[871]
India was also
the eighth-largest source for U.S. aluminum imports in 2017, supplying 2.2
percent of all U.S. aluminum imports.
[872]
GSP Country Eligibility Review
On April 12, 2018, USTR announced that it was reviewing the
eligibility of India, as well as Indonesia and Kazakhstan, for benefits under
the Generalized System of Preferences (GSP) due to concerns about program
compliance.
[873]
For India, the GSP eligibility review resulted from concerns related to India’s
compliance with the eligibility criterion on market access. USTR accepted two
petitions filed by the U.S. dairy industry and the U.S. medical device industry,
which alleged that Indian trade barriers were affecting U.S. exports in those
sectors. Based on its own assessment process, USTR also identified concerns
with India’s compliance with the market access criterion. According to USTR,
India “has implemented a wide array of trade barriers that create serious
negative effects on U.S. commerce,”
[874]
such as high tariffs and technical barriers to trade.
[875]
Because of the
similarity of the issues raised in the petitions and in USTR’s own review
process, USTR combined them into one overall review based on the GSP market
access criterion.
[876]
Intellectual Property
India remained on USTR’s Priority Watch List in the
2018
Special 301 Report
due to continuing concerns regarding weak protection
and enforcement of IPRs.
[877]
Of concern are patentability issues; the production, domestic distribution, and
export of counterfeit pharmaceuticals; trademark counterfeiting; and digital
piracy. Several patent issues were noted as being particularly burdensome for
U.S. firms, including narrow patentability standards, the threat of compulsory
licensing and patent revocations, long wait times to receive patents, and
onerous reporting requirements.
[878]
The report also described problems with government handling of the confidential
data supplied by U.S. companies during the market approval process. Although
these data are supposed to be protected from disclosure, companies state that
they have proven vulnerable to unfair commercial use. According to the report,
data on products in the pharmaceutical and agricultural chemical sectors are
especially susceptible to
misuse.
[879]
USTR’s
2018 Out-of-Cycle Review of Notorious Markets
Report
identified several online or physical marketplaces of concern in
India that are reported to engage in or facilitate commercial-scale copyright
piracy and trademark counterfeiting. In particular, the report noted markets in
India for counterfeit apparel and footwear, pirated media, and counterfeit and
illegal pharmaceuticals.
[880]
In 2018, Taiwan was the United States’ 11th-largest
single-country trading partner, which is the same position it held in 2017.
U.S. two-way merchandise trade with Taiwan grew 11.4 percent to $76.0 billion
in 2018 from $68.2 billion in 2017, continuing to account for 1.8 percent of
total merchandise trade with the world. The U.S. merchandise trade deficit with
Taiwan narrowed 7.2 percent to $15.5 billion in 2018, as U.S. imports rose by
$3.3 billion while U.S. exports rose by $4.5 billion (figure 6.15).
U.S. merchandise exports to Taiwan increased from $25.7
billion in 2017 to $30.2 billion in 2018, a 17.5 percent increase. The top U.S.
exports to Taiwan during the year were crude petroleum; civilian aircraft,
engines, and parts; machines for semiconductor or integrated circuit
manufacturing; semiconductors; and memories. U.S. exports of crude petroleum
increased by $2.7 billion, accounting for 60.3 percent of the overall rise in
exports to Taiwan in 2018, while the other top five exports declined.
U.S. merchandise imports from Taiwan increased from $42.5
billion in 2017 to $45.8 billion in 2018, a 7.8 percent rise. The top U.S.
imports from Taiwan during the year were computer parts and accessories;
microchips; telecommunications equipment; semiconductor storage devices; and semiconductors.
U.S. imports of computer parts and accessories increased by $885.6 million, or
63.8 percent, accounting for 26.8 percent of the overall rise in imports from
Taiwan in 2018. U.S.-Taiwan merchandise trade data are shown in appendix tables
A.69 through A.72.
Taiwan remained the 14th-largest single-country U.S. trading
partner in services in 2018. Two-way cross-border trade in services grew 2.8
percent, from $17.3 billion in 2017 to $17.8 billion in 2018, accounting for
1.3 percent of total U.S. services trade with the world. U.S. services exports
to Taiwan increased by 2.5 percent to $9.6 billion, while imports rose 3.2
percent to $8.2 billion. As a result of the larger absolute increase in
imports, the U.S. services trade surplus continued to decline, decreasing 1.6
percent from $1.40 billion in 2017 to $1.37 billion in 2018 (figure 6.16).
In 2018, leading U.S. services exports to Taiwan included transport,
travel services, and charges for intellectual property use (table A.73).
Transport increased from 2017 to 2018 while travel services held steady, but
exports of charges for intellectual property continued their decline, falling
24.6 percent in 2018. Leading U.S. services imports from Taiwan included
transport, travel services, and other business services (table A.74). Transport
was by far the largest category, accounting for 69.6 percent of U.S. services
imports from Taiwan in 2018.
Figure
6.15
U.S. merchandise trade
with Taiwan, 2014–18
Source: USITC DataWeb/USDOC
(accessed May 9, 2019).
Note: Underlying data can be found in
appendix table
B.5
.
Figure
6.16
U.S. cross-border trade
in private services with Taiwan, 2014–18
Source: USDOC, BEA U.S.
International Transactions, Services, & IIP, International Transactions,
International Services, tables 2.2 and 2.3, and International Transactions,
table 3.2, June 20, 2019.
Note: Data for 2018 are preliminary.
Underlying data can be found in appendix table
B.7
.
The primary forum for bilateral discussions on trade and
investment issues is the U.S.-Taiwan Trade and Investment Framework Agreement
(TIFA). The TIFA Council did not meet in 2018, but the two countries did hold
bilateral trade and investment discussions in September 2018.
[881]
The U.S.
delegation was led by Terry McCartin, Acting Assistant U.S. Trade
Representative for China, and included officials from the USTR and the U.S.
Departments of State, Commerce, and Agriculture.
[882]
The two sides
discussed a variety of issues, including technical barriers to trade, as well
as digital piracy and other intellectual property rights issues, investment,
and agriculture, which are discussed below.
Section 232 Steel and Aluminum Tariffs
Following investigations into the national security implications
of U.S. steel and aluminum imports under section 232 of the Trade Expansion Act
of 1962, the President imposed a 25 percent ad valorem tariff on imported steel
from all countries except Canada and Mexico, and a 10 percent ad valorem tariff
on imported aluminum from all other countries except Canada and Mexico,
effective March 23, 2018.
[883]
Although Taiwan’s exports were subject to the new U.S. tariffs, Taiwan did not
initiate WTO dispute proceedings or impose retaliatory tariffs in 2018. In
2017, Taiwan was the 8th-largest single-country source of U.S. steel imports,
comprising 4.3 percent of all U.S. imports of steel products.
[884]
Taiwan was
also the 21st-largest source for U.S. aluminum imports in 2017, comprising 0.7
percent of all U.S. aluminum imports.
[885]
Intellectual Property Rights Protection
The United States has been working with Taiwan to improve
protection and enforcement of IPRs, and continues to monitor changes to
Taiwan’s Copyright Act. The Legislative Yuan
[886]
introduced draft amendments to the Copyright Act to combat illicit streaming in
December 2018. Some issues, however, remain unresolved, including some
licensing provisions and the role of collective management organizations.
[887]
Questions also
remain concerning the use of copyrighted textbooks.
[888]
Following
talks at the September 2018 meeting, the United States and Taiwan agreed to a
Digital Anti-Piracy Work Plan to continue addressing enforcement cooperation,
legislative reforms to the Copyright Act, and legitimate teaching materials.
[889]
Investment
Investment is another issue that remains a top priority in
U.S.-Taiwan discussions, and was one of the chief topics discussed at the
September 2018 meeting.
[890]
Taiwan limits investment into certain sectors, including agriculture, some
manufacturing, and some services. Taiwan’s Executive Yuan is currently
considering amendments to Taiwan’s Statute for Investment by Foreign Nationals
that would exempt U.S. investments under $1.0 million from the approval
process.
[891]
The Deputy Assistant Secretary for Manufacturing at the U.S.
Department of Commerce International Trade Administration visited Taiwan in
December 2018 to discuss market access issues and to promote Taiwanese
investment into the United States through participation in the SelectUSA
Summit.
[892]
The SelectUSA Investment Summit, hosted by the U.S. Department of Commerce to
encourage foreign direct investment into the United States, occurred June
20–22, 2018. The summit was attended by 120 delegates from Taiwan, representing
advanced manufacturing, petrochemicals, iron and steel, information and
communication technology, biotechnology, banking, machinery, aerospace, and
franchising.
[893]
Agriculture
The United States continued to engage with Taiwan about
certain agricultural regulations, as Taiwan was the ninth-largest export market
for U.S. agricultural goods in 2018.
[894]
Starting in November 2017, Taiwan banned the entry of ready-to-cook potatoes
that had any amount of the color green (“greening”) on them, because it might
indicate the presence of glycoalkoloids. However, after U.S. engagement, in
November 2018 Taiwan ended its zero-tolerance policy, establishing instead a
threshold for the amount of greening allowed.
[895]
The United States also continued to work with Taiwan to
establish maximum residue limits for ractopamine. In 2007, Taiwan notified the
WTO of its intent to establish maximum residue limits for ractopamine, but has
set such limits only with respect to beef muscle cuts. In the absence of
established maximum limits, there is a zero tolerance for ractopamine, which
can be found in other beef products and pork. This approach has led to
longstanding barriers to U.S. exports of beef and pork.
[896]
In September 2018, Taiwan sent a delegation of government
officials to Washington, DC, on an agricultural trade goodwill mission.
[897]
The delegation
met with members of Congress and signed “intent to purchase” agreements for
$1.56 billion in soybeans, an increase of 30 percent from their purchase order the
previous year. In 2017, a similar delegation pledged to purchase $2.8 billion
in U.S. corn, soybeans, and wheat.
[898]
Asociación
Dominicana de Zonas Francas, Inc. (ADOZONA). Written submission to the U.S.
International Trade Commission in connection with inv. no. 332-227.
Caribbean
Basin Economic Recovery Act: Impact on U.S. Industries and Consumers and on
Beneficiary Countries, 24th Report,
May 14, 2019.
https://edis.usitc.gov
(registration
required).
Association des
Industries d’Haiti (ADIH). Written submission to the U.S. International Trade
Commission in connection with inv. no. 332-227.
Caribbean Basin Economic
Recovery Act: Impact on U.S. Industries and Consumers and on Beneficiary
Countries, 24th Report,
May 24, 2019.
https://edis.usitc.gov
(registration required).
Commission for
Environmental Cooperation (CEC). “North American Agreement on Environmental
Cooperation.”
http://www.cec.org/about-us/NAAEC
(accessed June 14, 2019).
Congressional
Research Service (CRS).
Data Flows, Online Privacy, and Trade Policy
.
CRS
Report R45584,
March 11, 2019.
https://fas.org/sgp/crs/row/R45584.pdf
.
Congressional
Research Service (CRS). “Effects of U.S. Tariff Action on U.S. Aluminum
Manufacturing,” by Michaela D. Platzer.
In Focus
, updated October 9,
2018.
https://fas.org/sgp/crs/misc/IF10998.pdf
.
Congressional
Research Service (CRS). “Enforcing U.S. Trade Laws: Section 301 and China,” by
Wayne M. Morrison.
In Focus,
updated May 23, 2019.
https://fas.org/sgp/crs/row/IF10708.pdf
.
Congressional
Research Service (CRS). “Section 232 Investigations: Overview and Issues for
Congress,” by Rachel F. Fefer, Brandon J. Murrill, Keigh E. Hammond, Michaela
D. Platzer, Vivian C. Jones, and Brock R. Williams. CRS Report R45249, updated
April 2, 2019.
https://fas.org/sgp/crs/misc/R45249.pdf
.
Congressional
Research Service (CRS). “South Korea: Background and U.S. Relations,” by Mark
E. Manyin, Emma Chanlett-Avery, and Brock Williams.
In Focus
, updated
May 20, 2019.
https://fas.org/sgp/crs/row/IF10165.pdf
.
Congressional
Research Service (CRS).
Softwood Lumber Imports from Canada: Current Issues
,
by Katie Hoover and Ian F. Fergusson. CRS Report R42789, April 12, 2018.
https://fas.org/sgp/crs/misc/R42789.pdf
.
Congressional
Research Service (CRS). “
The Committee on
Foreign Investment in the United States (CFIUS)
,
” by James
K. Jackson. CRS Report RL33388, updated May 15, 2019.
https://fas.org/sgp/crs/natsec/RL33388.pdf
.
Congressional
Research Service (CRS).
Trade Adjustment Assistance for Workers and the TAA
Reauthorization Act of 2015
, by Benjamin Collins. CRS Report R44153,
September 14, 2016.
https://fas.org/sgp/crs/misc/R44153.pdf
.
Congressional
Research Service (CRS). “Trade Promotion Authority (TPA): Frequently Asked
Questions,” by Ian F. Fergusson and Christopher M. Davis. CRS Report R43491,
June 21, 2019.
https://crsreports.congress.gov/product/pdf/R/R43491
.
Congressional
Research Service (CRS).
Trump Administration Tariff Actions: Frequently
Asked Questions
. CRS Report R45529, February 22, 2019.
https://fas.org/sgp/crs/row/R45529.pdf
.
Congressional
Research Service (CRS).
Trump Administration Tariff Actions (Sections 201,
232, 301): Frequently Asked Questions.
CRS Report R45529, February 22, 2019.
https://crsreports.congress.gov/product/pdf/R/R45529
.
Delegation of the
European Union to the United States. “Comments by the European Union to the
Bureau of Industry and Security, Office of Technology Evaluation, U.S.
Department of Commerce.” June 29, 2018.
http://trade.ec.europa.eu/doclib/html/157068.htm
.
European
Commission (EC). “EU-U.S. Privacy Shield: Second Review Shows Improvements but
a Permanent Ombudsperson Should be Nominated by 28 February 2019.” Press
release, December 19, 2018.
https://europa.eu/rapid/press-release_IP-18-6818_en.htm
.
European
Commission (EC). “Recommendation for a COUNCIL DECISION Authorising the Opening
of Negotiations of an Agreement with the United States of America on the
Elimination of Tariffs for Industrial Goods.” January 18, 2019.
https://trade.ec.europa.eu/doclib/docs/2019/january/tradoc_157628.pdf
.
Frazier, Kendal,
CEO, National Cattlemen’s Beef Association; Barry Carpenter, CEO, North American
Meat Institute; and Philip M. Seng, President and CEO, U.S. Meat Export
Federation. “Letter to the Honorable Michael Froman, Ambassador, Office of the
U.S. Trade Representative.” December 9, 2016.
https://www.regulations.gov/contentStreamer?documentId=USTR-2016-0025-0002&contentType=pdf
.
Government of
Armenia. Embassy to Armenia to the United States of America. “Session of
Armenia-US Council on Trade and Investment in Washington.” March 19, 2018.
http://usa.mfa.am/en/news/item/2018/03/19/TIFA/
.
Government
of Canada. Department of Finance. “Canada Eliminates Countermeasures as the
United States Lifts Tariffs.” Press release, May 20, 2019.
https://www.fin.gc.ca/n19/19-050-eng.asp
.
Government of
Colombia. El Ministerio de Comercio, Industria y Turismo [Ministry of Commerce,
Industry, and Trade] (Mincomercio). “
Presidente Santos firma la
adhesión de Colombia a la OCDE.
” [President Santos signs the accession
of Columbia to the OECD.] Noticia de Comercio [Commerce news release], May 30,
2018.
http://www.mincit.gov.co/prensa/noticias/comercio/presidente-santos-firma-la-adhesion-de-colombia-a
.
Government
of Japan, Ministry of Foreign Affairs. “G20 2019 Japan––What Is the G20 Summit?”
https://www.g20.org/en/summit/about/
(accessed May 29, 2019).
Ministry of
Finance of the People’s Republic of China. “Announcement of the Customs Tariff
Commission of the State Council on the Application of Tariffs on Imported Goods
Originating from Approximately US$60 Billion in the United States.” September
18, 2018.
http://gss.mof.gov.cn/zhengwuxinxi/zhengcefabu/201809/t20180918_3022592.html
.
Ministry of
Finance of the People’s Republic of China. “Notice of the Customs Tariff Commission
of the State Council on Suspension of Tariff Deduction Obligations for Certain
Import Commodities Originating in the United States.” April 1, 2018.
http://gss.mof.gov.cn/zhengwuxinxi/zhengcefabu/201804/t20180401_2857769.html
.
Organisation for
Economic Cooperation and Development (OECD). Meeting of the OECD Council at
Ministerial Level.
Strategic Orientations of the Secretary-General.
OECD:
Paris, May 2018.
https://www.oecd.org/mcm-2018/documents/C-MIN-2018-1-EN.pdf
.
Organisation for
Economic Cooperation and Development (OECD). “Role of the OECD in Support and Facilitation
of the Global Forum on Steel Excess Capacity (GFSEC)––(Note by the
Secretary-General),” January 25, 2017.
https://oecd.int
(registration
required).
Organisation for
Economic Cooperation and Development (OECD). “Who We Are.”
http://www.oecd.org/about/
(accessed
September 6, 2019).
Organisation for
Economic Cooperation and Development (OECD). Trade and Agriculture Directorate
(TAD). Trade Committee (TC). “Summary Record of the 174th Session of the Trade
Committee––Confidential Session––October 23, 2018.” TAD/TC/M(2018)3/ANN,
November 20, 2018.
https://oecd.int
(registration
required).
Organisation for
Economic Cooperation and Development (OECD). Trade and Agriculture Directorate
(TAD). Trade Committee (TC). “Summary Record of the 174th Session of the Trade
Committee––Session with the Participation of G20 and Invited Partner
Countries––October 23, 2018.” TAD/TC/M(2018)2, November 20, 2018.
https://oecd.int
(registration required).
Organisation for
Economic Cooperation and Development (OECD). Trade and Agriculture Directorate
(TAD). Trade Committee (TC). “Summary Record of the 173rd Session of the Trade
Committee––Confidential Session––April 25, 2018.” TAD/TC/M(2018)2/ANN, July 18,
2018.
https://oecd.int
(registration
required).
Organisation for
Economic Cooperation and Development (OECD). Trade and Agriculture Directorate
(TAD). Trade Committee (TC). “Summary Record of the 173rd Session of the Trade
Committee––Plenary Session––24–25 April 2018.” TAD/TC/M(2018)1, July 18, 2018.
https://oecd.int
(registration
required).
Organisation for
Economic Cooperation and Development (OECD). Trade and Agriculture Directorate
(TAD). Trade Committee (TC). “Summary Record of the 172nd Session of the Trade
Committee––Confidential Session––March 23, 2018.” TAD/TC/M(2018)1/ANN, April 9,
2018.
https://oecd.int
(registration
required).
Organisation for
Economic Cooperation and Development (OECD). Trade and Agriculture Directorate
(TAD). Trade Committee (TC). Working Party of the Trade Committee (WPTC). “Draft
Summary Record: Working Party of the Trade Committee––18–19 June 2018––Paris,
France.” TAD/TC/WP/M(2018)3, July 16, 2018.
https://oecd.int
(registration required).
Organisation for Economic
Cooperation and Development (OECD). Trade and Agriculture Directorate (TAD).
Trade Committee (TC). Working Party of the Trade Committee (WPTC).
Fostering
Participation in Digital Trade for ASEAN MSMEs.
Working paper
TAD/TC/WP(2018)18, September 24, 2018.
https://oecd.int
(registration
required).
Organisation for
Economic Cooperation and Development (OECD). Trade and Agriculture Directorate
(TAD). Trade Committee (TC). Working Party of the Trade Committee (WPTC).
Report:
Expert Meeting on Services Trade Policy, Structural Transformation and Labour
Market Adjustments, 29 January 2018.
TAD/TC/WP/RD(2018)2, March 2, 2018.
https://oecd.int
(registration required).
Organisation for
Economic Cooperation and Development (OECD). Trade and Agriculture Directorate
(TAD). Trade Committee (TC). Working Party of the Trade Committee (WPTC).
Services
Exported Together with Goods.
Working paper TAD/TC/WP(2018)5, February 28,
2018.
https://oecd.int
(registration
required).
Organisation for
Economic Cooperation and Development (OECD). Trade and Agriculture Directorate
(TAD). Trade Committee (TC). Working Party of the Trade Committee (WPTC). “Summary
Record: March 2019 WPTC––13–14 (a.m.) March 2019 ---Paris, France.”
TAD/TC/WP/M(2019)1, March 28, 2019.
https://oecd.int
(registration
required).
Organisation for
Economic Cooperation and Development (OECD). Trade and Agriculture Directorate
(TAD). Trade Committee (TC). Working Party of the Trade Committee (WPTC). “Summary
Record: December 2018 WPTC––11–12 (a.m.) December 2018––Paris, France.”
TAD/TC/WP/M(2018)5, February 22, 2019.
https://oecd.int
(registration required).
Organisation for
Economic Cooperation and Development (OECD). Trade and Agriculture Directorate
(TAD). Trade Committee (TC). Working Party of the Trade Committee (WPTC). “Summary
Record: Working Party of the Trade Committee––17–18 October 2018––Paris,
France.” TAD/TC/WP/M(2018)4, November 5, 2018.
https://oecd.int
(registration
required).
Organisation for
Economic Cooperation and Development (OECD). Trade and Agriculture Directorate.
Trade Committee (TC). Working Party of the Trade Committee (WPTC). “Summary
Record: Working Party of the Trade Committee––15–16 March 2018––Paris, France.”
TAD/TC/WP/M(2018)2, November 5, 2018.
https://oecd.int
(registration required).
Organisation for
Economic Cooperation and Development (OECD). Trade and Agriculture Directorate
(TAD). Trade Committee (TC). Working Party of the Trade Committee (WPTC).
Using
the STRI to Map Restrictiveness in Digital Trade.
Working Paper.
TAD/TC/WP(2018)10, May 24, 2018.
https://oecd.int
(registration required).
Taipei Economic
and Cultural Representative Office in the U.S. “The 2018 Taiwan Agricultural
Trade Goodwill Mission Signed a Letter of Intent with U.S. Exporters on Capitol
Hill for the Purchase of Soybeans with a Total Value of US$1.56 Billion.”
September 27, 2018.
https://www.roc-taiwan.org/us_en/post/7188.html
.
U.S. Department
of Commerce (USDOC). Bureau of Economic Analysis (BEA). Interactive data:
International Transactions, International Services, and International
Investment Position Tables, International Services, Table 2.3 U.S. Trade in
Services, by Country or Affiliation and by Type of Service, European Union, September
12, 2019.
https://apps.bea.gov/iTable/iTable.cfm?reqid=62&step=9&isuri=1&6210=4
(accessed May 10, 2019).
U.S. Department
of Commerce (USDOC). Bureau of Economic Analysis (BEA). Interactive data:
International Transactions, International Services, and International
Investment Position Tables, International Services, Table 2.3 U.S. Trade in
Services, by Country or Affiliation and by Type of Service, India and Italy,
October 19, 2018.
https://apps.bea.gov/iTable/iTable.cfm?reqid=62&step=9&isuri=1&6210=4
(accessed May 10, 2019).
U.S. Department
of Commerce (USDOC). Bureau of Economic Analysis (BEA). Interactive data:
International Transactions, International Services, and International
Investment Position Tables, International Transactions, Table 3.1, “U.S.
International Trade in Services,” June 20, 2019.
https://apps.bea.gov/iTable/iTable.cfm?ReqID=62&step=1
.
U.S. Department
of Commerce (USDOC). Bureau of Economic Analysis (BEA). Interactive data:
International Transactions, International Services, and International Investment
Position Tables, International Transactions, Table 3.2, “U.S. International
Trade in Services by Area and Country, Seasonally Adjusted Detail,” June 20,
2019.
https://apps.bea.gov/iTable/iTable.cfm?ReqID=62&step=1
.
U.S. Department
of Commerce (USDOC). Bureau of Economic Analysis (BEA). Interactive data:
International Transactions, International Services, and International
Investment Position Tables, International Transactions, Table 3.3, “U.S.
International Trade in Services by Area and Country, Not Seasonally Adjusted
Detail,” June 20, 2019.
https://apps.bea.gov/iTable/iTable.cfm?ReqID=62&step=1
.
U.S. Department
of Commerce (USDOC). International Trade Administration (ITA). “U.S.-Canada
Regulatory Cooperation Council.”
https://www.trade.gov/rcc/
(accessed July 2,
2019).
U.S. Department
of Commerce (USDOC). Office of Textiles and Apparel (OTEXA). “Preferences:
Country Eligibility, Apparel Eligibility, and Textile Eligibility (Category 0
and Category 9).”
https://otexa.trade.gov/AGOA_Trade_Preference.htm
(accessed May 20, 2019).
U.S. Department of Transportation (USDOT). Federal Motor Carrier Safety
Administration (FMCSA). “Out-of-Service (OOS) Rates (Mexican-Owned or
Mexico-Domiciled Carriers),” 2015-2019.
https://ai.fmcsa.dot.gov/SafetyProgram/spRptMex.aspx?rpt=MXOOS
(accessed June 11, 2019).
U.S. Department of Transportation (USDOT). Federal Motor Carrier Safety
Administration (FMCSA). “Roadside Inspection by Out-of-Service (OOS) Rates:
Out-of-Service (OOS) Rates (Mexican-Owned or Mexico-Domiciled Carriers),
2015–2019.”
https://ai.fmcsa.dot.gov/SafetyProgram/spRptRoadside.aspx?rpt=RDOOS
(accessed June 11, 2019).
U.S. Energy
Information Administration (EIA). “The U.S. Exported 2 Million Barrels per Day
of Crude Oil in 2018 to 42 Destinations.”
Today in Energy
, April 15,
2019.
https://www.eia.gov/todayinenergy/detail.php?id=39072
.
U.S.
International Trade Commission (USITC).
China: Effects of Intellectual
Property Infringement and Indigenous Innovation Policies on the U.S. Economy.
USITC
Publication 4226. Washington, DC: USITC, May 2011.
https://www.usitc.gov/publications/332/pub4226.pdf
.
U.S.
International Trade Commission (USITC).
China: Intellectual Property
Infringement, Indigenous Innovation Policies, and Frameworks for Measuring the
Effects on the U.S. Economy
. USITC Publication 4199. Washington, DC:
USITC, November 2010.
http://www.usitc.gov/publications/332/pub4199.pdf
.
U.S.
International Trade Commission (USITC).
Global Digital Trade 1: Market
Opportunities and Key Foreign Trade Restrictions.
USITC Publication 4716.
Washington, DC: USITC, August 2017.
https://www.usitc.gov/publications/332/pub4716.pdf
.
U.S.
International Trade Commission (USITC).
Harmonized Tariff Schedule of the
United States (2019) Revision 9
. USITC Publication 4937. Washington, DC:
USITC, July 2019.
https://hts.usitc.gov/view/release?release=2019HTSAREV9
.
U.S.
International Trade Commission (USITC). Hearing transcript in connection with
inv. no. 332-562 and 332-563.
Global Digital Trade 2: The
Business-to-Business Market, Key Foreign Trade Restrictions, and U.S.
Competitiveness; Global Digital Trade 3: The Business-to-Consumer Market, Key
Foreign Trade Restrictions, and U.S. Competitiveness,
March 6, 2018.
https://edis.usitc.gov
(registration
required).
U.S.
International Trade Commission (USITC). Hearing transcript in connection with
inv. no. 332-227.
Caribbean Basin Economic Recovery Act: Impact on U.S.
Industries and Consumers and on Beneficiary Countries, 24th Report,
May 14,
2019.
https://edis.usitc.gov
(registration required).
U.S. International
Trade Commission (USITC).
Hot-Rolled Steel Products from India, Inv. No. 701-TA-405
(Section 129 Consistency Determination).
USITC Publication 4599.
Washington, DC: USITC, March 2016.
https://www.usitc.gov/publications/701_731/pub4599.pdf
.
U.S. International
Trade Commission (USITC). Interactive Tariff and Trade DataWeb (DataWeb). Based
on official trade statistics of the U.S. Department of Commerce (USDOC).
https://dataweb.usitc.gov/
(accessed
various dates).
U.S.
International Trade Commission (USITC).
Nepal: Advice Concerning Whether
Certain Textile and Apparel Articles are Import Sensitive
. USITC
Publication 4640. Washington, DC: USITC, October 2016.
https://www.usitc.gov/publications/332/pub4640.pdf
.
U.S.
International Trade Commission (USITC).
Softwood Lumber Products from Canada,
Investigation Nos. 701-TA-566 and 731-TA-1342 (Final)
. USITC Publication
4749. Washington, DC: USITC, December 2017.
https://www.usitc.gov/publications/701_731/pub4749.pdf
.
U.S.
International Trade Commission (USITC).
The Economic Effects of Significant
U.S. Import Restraints—Sixth Update
,
Investigation No. 332-325
. USITC
Publication 4094. Washington, DC: USITC, August 2009.
https://www.usitc.gov/publications/332/pub4094.pdf
.
U.S.
International Trade Commission (USITC).
The Year in Trade 2017: Operation
of the Trade Agreements Program, 69th Report
. USITC Publication 4817.
Washington, DC: USITC, August 2018.
https://usitc.gov/publications/332/pub4817.pdf
.
U.S.
International Trade Commission (USITC).
The Year in Trade 2016: Operation
of the Trade Agreements Program, the 68th Report.
USITC Publication 4711. Washington, DC: USITC, July 2017.
https://www.usitc.gov/publications/332/otap2016.html
.
U.S.
International Trade Commission (USITC).
The Year in Trade 2015: Operation
of the Trade Agreements Program, the 67th Report.
USITC Publication 4627.
Washington, DC: USITC, July 2016.
https://www.usitc.gov/publications/332/pub4627.pdf
.
U.S.
International Trade Commission (USITC).
The Year in Trade 2014: Operation
of the Trade Agreements Program, the 66th Report
. USITC Publication 4543.
Washington, DC: USITC, July 2015.
https://www.usitc.gov/publications/332/old_pub4543.pdf
.
U.S.
International Trade Commission (USITC).
The Year in Trade 2011: Operation
of the Trade Agreements Program, the 63rd Report
. USITC Publication 4336. Washington,
DC: USITC, July 2012.
https://www.usitc.gov/publications/332/pub4336.pdf
.
U.S.
International Trade Commission (USITC).
The Year in Trade 2010: Operation
of the Trade Agreements Program, the 62nd Report
. USITC Publication 4247.
Washington, DC: USITC, July 2011.
https://www.usitc.gov/publications/332/pub4247.pdf
.
U.S.
International Trade Commission, (USITC).
The Year in Trade 2008: Operations
of the Trade Agreements Program, the 60
th
Report
. USITC,
Publication 4091. Washington, DC: July 2009.
https://www.usitc.gov/publications/332/pub4091_0.pdf
.
U.S.
International Trade Commission (USITC).
U.S.-Korea FTA: Advice on
Modification to Duty Rates for Certain Motor Vehicles
. USITC Publication
4791. Washington, DC: USITC, June 2018.
https://www.usitc.gov/publications/332/pub4791.pdf
.
U.S.
International Trade Commission (USITC).
U.S.-Mexico-Canada Trade Agreement:
Likely Impact on the U.S. Economy and on Specific Industry Sectors
. USITC
Publication 4889. Washington, DC: USITC, April 2019.
https://www.usitc.gov/publications/332/pub4889.pdf
.
U.S.
International Trade Commission (USITC).
U.S. Trade and Investment with
Sub-Saharan Africa: Recent Developments
. USITC Publication 4780.
Washington, DC: USITC, April 2018.
https://www.usitc.gov/publications/332/pub4780.pdf
.
U.S. Trade
Representative (USTR.)
1995 Trade Policy Agenda and 1994 Annual Report
of
the President of the United States on the Trade Agreements Program
.
Washington, DC: USTR, March 1994.
U.S. Trade
Representative (USTR).
Findings of the Investigation into China’s Acts,
Policies, and Practices Related to Technology Transfer, Intellectual Property,
and Innovation Under Section 301 of the Trade Act of 1974
. Washington DC:
USTR, March 22, 2018.
https://ustr.gov/sites/default/files/Section%20301%20FINAL.PDF
.
U.S. Trade
Representative (USTR). “Notice of Action and Request for Public Comment
Concerning Proposed Determination of Action Pursuant to Section 301: China’s
Acts, Policies, and Practices Related to Technology Transfer, Intellectual
Property, and Innovation.”
Federal Register
,
June 20, 2018.
https://ustr.gov/sites/default/files/2018-13248.pdf
.
White House. “Memorandum
of Understanding between the Treasury Board of Canada Secretariat and the
United States Office of Information and Regulatory Affairs Regarding the
Canada-United States Regulatory Cooperation Council.” June 4, 2018.
https://www.whitehouse.gov/wp-content/uploads/2018/06/US-CanadaMOU.pdf
.
White House. U.S.
Office of Information and Regulatory Affairs. “Memorandum of Understanding
Between the Treasury Board of Canada Secretariat and the United States Office
of Information and Regulatory Affairs Regarding the Canada-United States
Regulatory Cooperation Council.” June 4, 2018.
https://www.whitehouse.gov/wp-content/uploads/2018/06/US-CanadaMOU.pdf
World Trade
Organization (WTO). “Dispute Settlement: DS539; United States—Anti-Dumping and
Countervailing Duties on Certain Products and the Use of Facts Available.”
Trade Topics.
https://www.wto.org/english/tratop_e/dispu_e/cases_e/ds539_e.htm
(accessed July 2, 2019).
World
Trade Organization (WTO). Committee on Trade and Development—Aid for Trade. “Aid-For-Trade
Work Programme 2018–2019; Supporting Economic Diversification and Empowerment
for Inclusive, Sustainable Development through Aid for Trade.” WT/COMTD/AFT/W/75,
May 7, 2018.
https://docs.wto.org/dol2fe/Pages/SS/directdoc.aspx?filename=q:/WT/COMTD/AFTW75.pdf
.
Table
A.1
U.S. total exports to the
world, by USITC digest sector, 2016–18
Sector
Description
2016
2017
2018
% change
2017–18
Million $
1
Agricultural products
148,626
152,965
154,944
1.3
2
Forest products
37,700
39,592
40,862
3.2
3
Chemicals and related
products
217,979
227,526
243,436
7.0
4
Energy-related products
98,489
144,319
195,897
35.7
5
Textiles and apparel
21,734
22,146
22,712
2.6
6
Footwear
1,367
1,432
1,559
8.8
7
Minerals and metals
128,680
136,447
146,274
7.2
8
Machinery
128,183
136,204
143,279
5.2
9
Transportation equipment
320,006
325,578
337,942
3.8
10
Electronic products
260,426
268,546
276,896
3.1
11
Miscellaneous manufactures
47,702
49,081
52,096
6.1
12
Special provisions
40,131
42,437
48,160
13.5
Total
1,451,024
1,546,273
1,664,056
7.6
Source: USITC DataWeb/USDOC (accessed May 9,
2019).
Note: Because of rounding, figures may not add up
to totals shown.
Table
A.2
U.S. general imports to
the world, by USITC digest sector, 2016–18
Sector
Description
2016
2017
2018
% change
2017–18
Million $
1
Agricultural products
139,097
147,329
156,588
6.3
2
Forest products
43,115
44,821
48,696
8.6
3
Chemicals and related
products
259,890
268,131
311,210
16.1
4
Energy-related products
157,321
196,833
234,983
19.4
5
Textiles and apparel
120,230
121,372
127,662
5.2
6
Footwear
25,634
25,640
26,567
3.6
7
Minerals and metals
183,544
200,577
215,281
7.3
8
Machinery
179,486
196,319
214,652
9.3
9
Transportation equipment
418,311
434,860
459,726
5.7
10
Electronic products
449,853
484,121
506,065
4.5
11
Miscellaneous manufactures
124,854
130,338
139,019
6.7
12
Special provisions
85,697
90,426
100,817
11.5
Total
2,187,032
2,340,768
2,541,267
8.6
Source: USITC DataWeb/USDOC (accessed May 9,
2019).
Note: Because of rounding, figures may not add up
to totals shown.
Table
A.3
Leading U.S. total exports
to the world, by HTS 6-digit subheading, 2016–18
HTS 6
Description
2016
2017
2018
% change 2017–18
Million $
1201.90
Soybeans, other than seed
22,843
21,461
17,103
-20.3
2709.00
Petroleum oils and oils
from bituminous minerals, crude
9,380
22,594
47,190
108.9
2710.12
Light oils and
preparations containing 70% by weight petroleum oils or oils from bituminous
minerals, not containing biodiesel, not waste oils
24,272
29,557
39,154
32.5
2710.19
Petroleum oils, oils from
bituminous minerals (other than crude) & products containing by weight
70% or more of these oils, not biodiesel or waste
37,729
48,156
54,998
14.2
2711.12
Propane, liquefied
7,401
12,368
14,910
20.6
3004.90
Medicaments, in measured
doses, etc. (excluding vaccines, etc., coated bandages etc., and
pharmaceutical goods), n.e.s.o.i.
19,096
17,128
17,855
4.2
7102.39
Diamonds, nonindustrial,
worked, including polished or drilled
18,845
17,897
19,471
8.8
7108.12
Gold, nonmonetary,
unwrought n.e.s.o.i. (other than powder)
17,518
19,610
20,131
2.7
8473.30
Parts and accessories for automatic
data processing machines and units thereof, magnetic or optical readers,
transcribing machines, etc., n.e.s.o.i.
15,502
15,527
17,741
14.3
8486.20
Machines and apparatus for
the manufacture of semiconductor devices or of electronic integrates circuits
8,833
12,490
12,294
-1.6
8517.62
Machines for the
reception, conversion and transmission or regeneration of voice, images or
other data, including switching and routing apparatus
18,857
17,592
17,742
0.9
8542.31
Processors and
controllers, electronic integrated circuits
19,849
18,963
19,097
0.7
8703.23
Passenger motor vehicles
with spark-ignition internal combustion reciprocating piston engine, cylinder
capacity over 1,500 cc but not over 3,000 cc
21,924
18,703
17,401
-7.0
8703.24
Passenger motor vehicles
with spark-ignition internal combustion reciprocating piston engine, cylinder
capacity over 3,000 cc
18,604
18,814
17,852
-5.1
8800.00
Civilian aircraft,
engines, and parts
120,929
120,988
130,384
7.8
Total of items shown
381,582
411,846
463,322
12.5
All other HTS subheadings
1,069,442
1,134,427
1,200,733
5.8
Total of all commodities
1,451,024
1,546,273
1,664,056
7.6
Source: USITC DataWeb/USDOC (accessed May 9,
2019).
Note:
Data reflect shipments under HTS chapters 1–97. Because of rounding, figures
may not add up to totals shown. N.e.s.o.i. = not elsewhere specified or
included; cc = cubic centimeter; gvw = gross vehicle weight.
Table
A.4
Leading U.S. general
imports from the world by HTS 6-digit subheading, 2016–18
HTS 6
Description
2016
2017
2018
% change 2017–18
Million $
2709.00
Petroleum oils and oils
from bituminous minerals, crude
101,704
132,936
157,030
18.1
8703.23
Passenger motor vehicles
with spark-ignition internal combustion reciprocating piston engine, cylinder
capacity over 1,500 cc but not over 3,000 cc
106,344
101,633
102,806
1.2
3004.90
Medicaments, in measured
doses, etc. (excluding vaccines, etc., coated bandages etc., and pharmaceutical
goods), n.e.s.o.i.
51,062
50,120
55,950
11.6
8517.12
Telephones for cellular
networks or for other wireless networks
49,795
55,955
52,839
-5.6
8517.62
Machines for the
reception, conversion and transmission or regeneration of voice, images or
other data, including switching and routing apparatus
45,356
47,630
47,299
-0.7
8471.30
Portable automatic data
processing machines, weight not more than 10 kg, consisting of at least a
central processing unit, keyboard & a display
35,861
39,988
39,695
-0.7
8703.24
Passenger motor vehicles
with spark-ignition internal combustion reciprocating piston engine, cylinder
capacity over 3,000 cc
50,092
47,121
39,141
-16.9
2710.19
Petroleum oils, oils from
bituminous minerals (other than crude) & products containing by weight
70% or more of these oils, not biodiesel or waste
21,563
26,769
35,083
31.1
8471.50
Processing units other
than those of 8471.41 and 8471.49, n.e.s.o.i.
19,629
23,418
31,698
35.4
8473.30
Parts and accessories for
automatic data processing machines and units thereof, magnetic or optical
readers, transcribing machines, etc., n.e.s.o.i.
15,208
21,940
27,050
23.3
2710.12
Light oils and
preparations containing 70% by weight petroleum oils or oils from bituminous
minerals, not containing biodiesel, not waste oils
17,224
18,552
23,507
26.7
7102.39
Diamonds, nonindustrial,
worked, including polished or drilled
23,019
21,541
23,295
8.1
8542.31
Processors and
controllers, electronic integrated circuits
20,888
21,043
21,572
2.5
8703.22
Passenger motor vehicles
with spark-ignition internal combustion reciprocating piston engine, cylinder
capacity over 1,000 cc but not over 1,500 cc
10,963
15,994
20,744
29.7
8704.31
Motor vehicles for goods
transport n.e.s.o.i., with spark-ignition internal combustion piston engine,
gvw not over 5 metric tons
15,890
15,827
17,667
11.6
Total of items shown
584,597
640,467
695,376
8.6
All other HTS subheadings
1,602,435
1,700,301
1,845,890
8.6
Total of all commodities
2,187,032
2,340,768
2,541,267
8.6
Source: USITC DataWeb/USDOC (accessed May 9,
2019).
Note:
Data reflect shipments under HTS chapters 1–97. Because of rounding, figures
may not add up to totals shown. N.e.s.o.i. = not elsewhere specified or
included; cc = cubic centimeter; gvw = gross vehicle weight.
Table
A.5
U.S. merchandise trade
with top 15 single-country trading partners, 2018
Rank
Country
Total exports
General imports
Total
% of total trade
Million $
1
China
120,341
539,495
659,836
15.7
2
Canada
298,719
318,414
617,133
14.7
3
Mexico
265,010
346,524
611,534
14.5
4
Japan
74,967
142,596
217,562
5.2
5
Germany
57,654
125,904
183,558
4.4
6
South Korea
56,344
74,223
130,568
3.1
7
United Kingdom
66,228
60,784
127,013
3.0
8
France
36,326
52,519
88,845
2.1
9
India
33,120
54,007
87,127
2.1
10
Italy
23,153
54,714
77,867
1.9
11
Taiwan
30,243
45,761
76,004
1.8
12
Netherlands
49,391
24,599
73,990
1.8
13
Brazil
39,494
30,940
70,434
1.7
14
Ireland
10,687
57,468
68,155
1.6
15
Switzerland
22,231
41,135
63,365
1.5
Top 15
1,183,909
1,969,083
3,152,992
75.0
All others
480,147
572,183
1,052,330
25.0
Total
1,664,056
2,541,267
4,205,322
100.0
Source: USITC DataWeb/USDOC (accessed
May 9, 2019).
Note: Because of rounding, figures may
not add up to totals shown.
Table
A.6
Top 15 U.S. single-country
merchandise export markets, 2018
Rank
Country
Million $
% of total exports
1
Canada
298,719
18.0
2
Mexico
265,010
15.9
3
China
120,341
7.2
4
Japan
74,967
4.5
5
United Kingdom
66,228
4.0
6
Germany
57,654
3.5
7
South Korea
56,344
3.4
8
Netherlands
49,391
3.0
9
Brazil
39,494
2.4
10
Hong Kong
37,460
2.3
11
France
36,326
2.2
12
Singapore
33,141
2.0
13
India
33,120
2.0
14
Belgium
31,416
1.9
15
Taiwan
30,243
1.8
Top 15
1,229,854
73.9
All others
434,201
26.1
Total
1,664,056
100.0
Source: USITC DataWeb/USDOC (accessed
May 9, 2019).
Note: Because of rounding, figures may
not add up to totals shown.
Table
A.7
Top 15 U.S. single-country
merchandise import sources, 2018
Rank
Country
Million $
% of total exports
1
China
539,495
21.2
2
Mexico
346,524
13.6
3
Canada
318,414
12.5
4
Japan
142,596
5.6
5
Germany
125,904
5.0
6
South Korea
74,223
2.9
7
United Kingdom
60,784
2.4
8
Ireland
57,468
2.3
9
Italy
54,714
2.2
10
India
54,007
2.1
11
France
52,519
2.1
12
Vietnam
49,211
1.9
13
Taiwan
45,761
1.8
14
Switzerland
41,135
1.6
15
Malaysia
39,384
1.5
Top 15
2,002,138
78.8
All others
539,128
21.2
Total
2,541,267
100.0
Source: USITC DataWeb/USDOC (accessed
May 9, 2019).
Note: Because of rounding, figures may
not add up to totals shown.
Table
A.8
U.S. private services
exports to the world, by category, 2016–18
Services Industry
2016
2017
2018
% change 2017–18
Million $
Travel
206,650
210,655
214,680
1.9
Charges for the use of
intellectual property n.i.e.
124,387
126,523
128,748
1.8
Financial services
99,074
109,203
112,015
2.6
Professional and
management consulting services
74,524
78,940
86,828
10.0
Research and development
services
38,300
42,232
42,555
0.8
Air passenger fares
39,341
40,889
41,465
1.4
Technical, trade-related,
and other business services
31,790
36,019
36,439
1.2
Maintenance and repair
services n.i.e.
25,132
26,880
30,968
15.2
Air transport
a
22,778
24,616
26,723
8.6
Sea transport
b
18,078
18,707
19,514
4.3
Other
59,615
64,640
65,810
1.8
Total
739,669
779,304
805,745
3.4
Source: USDOC, BEA, “Interactive
data, International Transactions, Services, & IIP, International
Transactions Data, Table 3.1 U.S. International Trade in Services,” June 20,
2019.
Note: Data for 2018 are preliminary.
N.i.e. = not indicated elsewhere. Because of rounding, figures may not add up
to totals shown.
a
Air transport includes airport and air freight services.
b
Sea transport includes sea port and sea freight services.
Table
A.9
U.S. private services
imports from the world, by category, 2016–18
Services Industry
2016
2017
2018
% change 2017–18
Million $
Travel
123,549
134,868
144,463
7.1
Charges for the use of
intellectual property n.i.e.
46,987
53,440
56,117
5.0
Professional and
management consulting services
41,901
42,156
47,612
12.9
Air passenger fares
37,410
38,892
42,043
8.1
Sea transport
a
35,097
37,058
39,014
5.3
Insurance services
50,144
50,599
42,485
-16.0
Research and development
services
34,083
35,231
34,618
-1.7
Computer services
29,551
31,764
32,864
3.5
Financial services
25,710
28,957
31,298
8.1
Technical, trade-related,
and other business services
24,586
26,799
29,644
10.6
Other
41,106
42,069
44,189
5.0
Total
490,124
521,833
544,347
4.3
Source: USDOC, BEA, Interactive data,
International Transactions, Services, & IIP, International Transactions
Data, “Table 3.1 U.S. International Trade in Services,” June 20, 2019.
Note: Data for 2018 are preliminary.
N.i.e. = not indicated elsewhere. Because of rounding, figures may not add up
to totals shown.
a
Sea transport includes sea
port and sea freight services.
Table
A.10
Antidumping cases active
in 2018, by USITC investigation number
USITC investigation
number
Product
Country of origin
Date of institution
USITC prelim
ITA
a
prelim
ITA final
USITC final
Date of final action
b
Affirmative
= A; Negative = N; Terminated = T
731-TA-1343
Silicon metal
Australia
3/8/2017
A
A
A
N
4/10/2018
731-TA-1344
Silicon metal
Brazil
3/8/2017
A
A
A
N
4/10/2018
731-TA-1345
Silicon metal
Norway
3/8/2017
A
A
A
N
4/10/2018
731-TA-1346
Aluminum foil
China
3/9/2017
A
A
A
A
4/9/2018
731-TA-1347
Biodiesel
Argentina
3/23/2017
A
A
A
A
4/16/2018
731-TA-1348
Biodiesel
Indonesia
3/23/2017
A
A
A
A
4/16/2018
731-TA-1349
Wire rod
Belarus
3/28/2017
A
A
A
A
1/18/2018
731-TA-1350
Wire rod
Italy
3/28/2017
A
A
A
A
5/11/2018
731-TA-1351
Wire rod
South Korea
3/28/2017
A
A
A
A
5/11/2018
731-TA-1352
Wire rod
Russia
3/28/2017
A
A
A
A
1/18/2018
731-TA-1353
Wire rod
South Africa
3/28/2017
A
A
A
A
3/1/2018
731-TA-1354
Wire rod
Spain
3/28/2017
A
A
A
A
5/11/2018
731-TA-1355
Wire rod
Turkey
3/28/2017
A
A
A
A
5/11/2018
731-TA-1356
Wire rod
Ukraine
3/28/2017
A
A
A
A
3/1/2018
731-TA-1357
Wire rod
United Arab Emirates
3/28/2017
A
A
A
A
1/18/2018
731-TA-1358
Wire rod
United Kingdom
3/28/2017
A
A
A
A
5/11/2018
731-TA-1359
Carton closing staples
China
3/31/2017
A
A
A
A
4/30/2018
731-TA-1360
Tool chests
China
4/11/2017
A
A
A
A
5/24/2018
731-TA-1361
Tool chests
Vietnam
4/11/2017
A
A
A
A
5/24/2018
731-TA-1362
Cold-drawn mechanical
tubing
China
4/19/2017
A
A
A
A
5/31/2018
731-TA-1363
Cold-drawn mechanical
tubing
Germany
4/19/2017
A
A
A
A
5/31/2018
731-TA-1364
Cold-drawn mechanical
tubing
India
4/19/2017
A
A
A
A
5/31/2018
731-TA-1365
Cold-drawn mechanical
tubing
Italy
4/19/2017
A
A
A
A
5/31/2018
731-TA-1366
Cold-drawn mechanical
tubing
South Korea
4/19/2017
A
A
A
A
5/31/2018
731-TA-1367
Cold-drawn mechanical
tubing
Switzerland
4/19/2017
A
A
A
A
5/31/2018
731-TA-1368
100- to 150-seat large
civil aircraft
Canada
4/27/2017
A
A
A
N
2/13/2018
731-TA-1369
Fine denier polyester
staple fiber
China
5/31/2017
A
A
A
A
7/13/2018
731-TA-1370
Fine denier polyester
staple fiber
India
5/31/2017
A
A
A
A
7/13/2018
731-TA-1371
Fine denier polyester
staple fiber
South Korea
5/31/2017
A
A
A
A
7/13/2018
731-TA-1372
Fine denier polyester
staple fiber
Taiwan
5/31/2017
A
A
A
A
7/13/2018
731-TA-1374
Citric acid and certain
citrate salts
Belgium
6/2/2017
A
A
A
A
7/10/2018
731-TA-1375
Citric acid and certain
citrate salts
Colombia
6/2/2017
A
A
A
A
7/10/2018
731-TA-1376
Citric acid and certain
citrate salts
Thailand
6/2/2017
A
A
A
A
7/10/2018
731-TA-1377
Ripe olives
Spain
6/22/2017
A
A
A
A
7/25/2018
731-TA-1378
Low melt polyester staple
fiber
South Korea
6/27/2017
A
A
A
A
8/6/2018
731-TA-1379
Low melt polyester staple fiber
Taiwan
6/27/2017
A
A
A
A
8/6/2018
731-TA-1380
Tapered roller bearings
South Korea
6/28/2017
A
A
A
A
8/6/2018
731-TA-1381
Cast iron soil pipe
fittings
China
7/13/2017
A
A
A
A
8/22/2018
731-TA-1382
Uncoated groundwood paper
Canada
8/9/2017
A
A
A
N
9/24/2018
731-TA-1383
Stainless steel flanges
China
8/16/2017
A
A
A
A
7/28/2018
731-TA-1384
Stainless steel flanges
India
8/16/2017
A
A
A
A
10/01/2018
731-TA-1387
PET resin
Brazil
9/26/2017
A
A
A
N
11/6/2018
731-TA-1388
PET resin
Indonesia
9/26/2017
A
A
A
N
11/6/2018
731-TA-1389
PET resin
South Korea
9/26/2017
A
A
A
N
11/6/2018
731-TA-1390
PET resin
Pakistan
9/26/2017
A
A
A
N
11/6/2018
731-TA-1391
PET resin
Taiwan
9/26/2017
A
A
A
N
11/6/2018
731-TA-1392
PFTE resin
China
9/28/2017
A
A
A
N
11/29/2018
731-TA-1393
PFTE resin
India
9/28/2017
A
A
A
N
11/29/2018
731-TA-1394
Forged steel fittings
China
10/5/2017
A
A
A
A
11/19/2018
731-TA-1395
Forged steel fittings
Italy
10/5/2017
A
A
A
A
11/19/2018
731-TA-1396
Forged steel fittings
Taiwan
10/5/2017
A
A
A
A
9/14/2018
731-TA-1397
Sodium Gluconate
China
11/30/2017
A
A
A
A
11/1/2018
731-TA-1398
Sodium Gluconate
France
11/30/2017
N
(c)
(c)
(c)
1/23/2018
731-TA-1399
Common alloy aluminum
sheet
China
12/1/2017
A
A
A
(d)
(d)
731-TA-1400
Plastic decorative ribbon
China
12/27/2017
A
A
A
(d)
(d)
731-TA-1401
Large diameter welded pipe
Canada
01/17/2018
A
A
A
(d)
(d)
731-TA-1402
Large diameter welded pipe
China
01/17/2018
A
A
A
(d)
(d)
731-TA-1403
Large diameter welded pipe
Greece
01/17/2018
A
A
A
(d)
(d)
731-TA-1404
Large diameter welded pipe
India
01/17/2018
A
A
A
(d)
(d)
731-TA-1405
Large diameter welded pipe
South Korea
01/17/2018
A
A
A
(d)
(d)
731-TA-1406
Large diameter welded pipe
Turkey
01/17/2018
A
A
A
(d)
(d)
731-TA-1407
Cast iron soil pipe
China
01/26/2018
A
A
A
(d)
(d)
731-TA-1408
Rubber bands
China
01/30/2018
A
A
A
(d)
(d)
731-TA-1409
Rubber bands
Sri Lanka
01/30/2018
T
(c)
(c)
(c)
3/19/2018
731-TA-1410
Rubber bands
Thailand
01/30/2018
A
A
A
(d)
(d)
731-TA-1411
Laminated woven sacks
Vietnam
03/07/2018
A
A
(d)
(d)
(d)
731-TA-1412
Steel wheels
China
03/27/2018
A
A
(d)
(d))
(d)
731-TA-1413
Glycine
India
03/28/2018
A
A
(d)
(d)
(d)
731-TA-1414
Glycine
Japan
03/28/2018
A
A
(d)
(d)
(d)
731-TA-1415
Glycine
Thailand
03/28/2018
A
N
(c)
(c)
10/24/2018
731-TA-1416
Quartz surface products
China
04/17/2018
A
A
(d)
(d)
(d)
731-TA-1417
Steel propane cylinders
China
05/22/2018
A
A
(d)
(d)
(d)
731-TA-1418
Steel propane cylinders
Taiwan
05/22/2018
T
(c)
(c)
(c)
6/26/2018
731-TA-1419
Steel propane cylinders
Thailand
05/22/2018
A
A
(d)
(d)
(d)
731-TA-1420
Steel racks
China
06/21/2018
A
A
(d)
(d)
(d)
731-TA-1421
Steel trailer wheels
China
08/09/2018
A
A
(d)
(d)
(d)
731-TA-1422
Strontium Chromate
Austria
09/06/2018
A
(d)
(d)
(d)
(d)
731-TA-1423
Strontium Chromate
France
09/06/2018
A
(d)
(d)
(d)
(d)
731-TA-1424
Mattresses
China
09/18/2018
A
(d)
(d)
(d)
(d)
731-TA-1425
Refillable stainless steel
kegs
China
09/20/2018
A
(d)
(d)
(d)
(d)
731-TA-1426
Refillable stainless steel
kegs
Germany
09/20/2018
A
(d)
(d)
(d)
(d)
731-TA-1427
Refillable stainless steel
kegs
Mexico
09/20/2018
A
(d)
(d)
(d)
(d)
731-TA-1428
Aluminum wire and cable
China
09/21/2018
A
(d)
(d)
(d)
(d)
731-TA-1429
Polyester textured yarn
China
10/18/2018
A
(d)
(d)
(d)
(d)
731-TA-1430
Polyester textured yarn
India
10/18/2018
A
(d)
(d)
(d)
(d)
731-TA-1431
Magnesium
Israel
10/24/2018
A
(d)
(d)
(d)
(d)
Source: U.S. International Trade
Commission.
a
“ITA”
is the International Trade Administration of the U.S. Department of Commerce
(USDOC).
b
For
cases in which the final action was taken by the ITA, the date shown is the
Federal
Register
notice date of that action. For cases in which the final action
was taken by USITC, the date of the USITC notification of USDOC is shown.
c
Investigation was terminated due to negative determination, negligibility, or
withdrawal of the petition.
d
Pending
or not applicable as of December 31, 2018.
Table
A.11
Antidumping duty orders
and suspension agreements in effect as of December 31, 2018
Heavy walled rectangular
welded carbon steel pipes and tubes
September 13, 2016
Emulsion styrene-butadiene
rubber
September 12, 2017
Moldova
Steel concrete reinforcing
bar
September 7, 2001
Carbon steel wire rod
October 29, 2002
Netherlands
Hot-rolled carbon steel
flat products
October 3, 2016
Oman
Steel nails
July 13, 2015
Polyethylene terephthalate
resin
May 6, 2016
Philippines
Stainless steel butt-weld
pipe fittings
February 23, 2001
Poland
Steel concrete reinforcing
bar
September 7, 2001
Emulsion styrene-butadiene
rubber
September 12, 2017
Portugal
Uncoated paper
March 5, 2016
Romania
Small diameter seamless
pipe
August 10, 2000
Russia
Uranium (suspended)
October 16, 1992
Carbon steel plate
(suspended)
October 24, 1997
Hot-rolled carbon steel
flat products
July 12, 1999
Silicon metal
March 26, 2003
Carbon and alloy steel
wire rod
January 24, 2018
South Africa
Stainless steel plate in
coils
May 21, 1999
Ferrovanadium
January 28, 2003
Uncovered innerspring
units
December 11, 2008
Carbon and alloy steel
cut-to-length plate
January 26, 2017
Carbon and alloy steel
wire rod
March 14, 2018
South Korea
Circular welded nonalloy
steel pipe
November 2, 1992
Welded ASTM A-312
stainless steel pipe
December 30, 1992
Stainless steel wire rod
September 15, 1998
Stainless steel sheet
& strip
July 27, 1999
Carbon steel plate
February 10, 2000
Polyester staple fiber
May 25, 2000
Prestressed concrete steel
wire strand
January 28, 2004
Light-walled rectangular
pipe and tube
August 5, 2008
Large power transformers
August 31, 2012
Large residential washers
February 15, 2013
Oil country tubular goods
September 10, 2014
Non-oriented electrical
steel
December 3, 2014
Steel nails
July 13, 2015
Welded line pipe
December 1, 2015
Corrosion-resistant steel
products
July 25, 2016
Heavy walled rectangular
welded carbon steel pipes and tubes
September 13, 2016
Cold-rolled steel flat
products
September 20, 2016
Hot-rolled carbon steel
flat products
October 3, 2016
Phosphor copper
April 24, 2017
Ferrovanadium
May 15, 2017
Carbon and alloy steel
cut-to-length plate
May 25, 2017
Dioctyl Terephthalate
(DOTP)
August 18, 2017
Emulsion styrene-butadiene
rubber
September 12, 2017
Carbon and alloy steel
wire rod
May 21, 2018
Cold-drawn mechanical
tubing of carbon and alloy steel
June 11, 2018
Fine denier polyester
staple fiber
July 20, 2018
Low melt polyester staple
fiber
August 16, 2018
Spain
Chlorinated isocyanurates
June 24, 2005
Finished carbon steel
flanges
June 14, 2017
Carbon and alloy steel
wire rod
May 21, 2018
Ripe olives
August 1, 2018
Sweden
Non-oriented electrical
steel
December 3, 2014
Switzerland
Cold-drawn mechanical
tubing of carbon and alloy steel
June 11, 2018
Taiwan
Small diameter carbon
steel pipe
May 7, 1984
Carbon steel butt-weld
pipe fittings
December 17, 1986
Light-walled rectangular
tube
March 27, 1989
Circular welded nonalloy
steel pipe
November 2, 1992
Welded ASTM A-312
stainless steel pipe
December 30, 1992
Helical spring lock
washers
June 28, 1993
Stainless steel wire rod
September 15, 1998
Stainless steel plate in
coils
May 21, 1999
Stainless steel sheet
& strip
July 27, 1999
Polyester staple fiber
May 25, 2000
Hot-rolled carbon steel
flat products
November 29, 2001
Polyethylene terephthalate
(PET) film
July 1, 2002
Raw flexible magnets
September 17, 2008
Polyethylene retail
carrier bags
May 4, 2010
Narrow woven ribbons with
woven selvedge
September 1, 2010
Stilbenic optical
brightening agent
May 10, 2012
Steel wire garment hangers
December 10, 2012
Non-oriented electrical
steel
December 3, 2014
Crystalline silicon
photovoltaic products
February 18, 2015
Steel nails
July 13, 2015
Corrosion-resistant steel
products
July 25, 2016
Carbon and alloy steel
cut-to-length plate
May 25, 2017
Steel concrete reinforcing
bar
October 2, 2017
Fine denier polyester
staple fiber
July 20, 2018
Low melt polyester staple
fiber
August 16, 2018
Forged steel fittings
September 24, 2018
Thailand
Welded carbon steel pipe
March 11, 1986
Carbon steel butt-weld
pipe fittings
July 6, 1992
Hot-rolled carbon steel
flat products
November 29, 2001
Prestressed concrete steel
wire strand
January 28, 2004
Polyethylene retail
carrier bags
August 9, 2004
Frozen warm-water shrimp
and prawns
February 1, 2005
Welded stainless pressure
pipe
July 21, 2014
Citric acid and certain
citrate salts
July 25, 2018
Trinidad & Tobago
Carbon steel wire rod
October 29, 2002
Turkey
Welded carbon steel pipe
May 15, 1986
Pasta
July 24, 1996
Light–walled rectangular
pipe and tube
May 30, 2008
Oil country tubular goods
September 10, 2014
Welded line pipe
December 1, 2015
Heavy walled rectangular
welded carbon steel pipes and tubes
September 13, 2016
Hot-rolled carbon steel
flat products
October 3, 2016
Carbon and alloy steel
cut-to-length plate
January 26, 2017
Steel concrete reinforcing
bar
July 14, 2017
Carbon and alloy steel
wire rod
May 21, 2018
United Kingdom
Cold-rolled steel flat
products
September 20, 2016
Hot-rolled carbon steel
flat products
October 3, 2016
Carbon and alloy steel
wire rod
May 21, 2018
Ukraine
Carbon steel plate
(suspended)
October 24, 1997
Steel concrete reinforcing
bar
September 7, 2001
Hot-rolled carbon steel
flat products
November 29, 2001
Silicomanganese
September 17, 2001
Carbon and alloy steel
wire rod
March 14, 2018
United Arab Emirates
Polyethylene terephthalate
film, sheet, and strip
November 10, 2008
Carbon and alloy steel
wire rod
January 24, 2018
Steel nails
May 10, 2012
Venezuela
Silicomanganese
May 23, 2002
Vietnam
Frozen fish fillets
August 12, 2003
Frozen warm-water shrimp
and prawns
February 1, 2005
Uncovered innerspring
units
December 11, 2008
Polyethylene retail
carrier bags
May 4, 2010
Steel wire garment hangers
February 5, 2013
Utility scale wind towers
February 15, 2013
Welded stainless pressure
pipe
July 21, 2014
Oil country tubular goods
September 10, 2014
Steel nails
July 13, 2015
Tool chests and cabinets
June 4,2018
Source: U.S. International Trade Commission
(USITC).
Table
A.12
Countervailing duty cases
active in 2018, by USITC investigation number
USITC investigation
no.
Product
Country of origin
Date of institution
USITC prelim
ITA
a
prelim
ITA final
USITC final
Date of final action
b
Affirmative = A; Negative = N; Terminated =T
701-TA-567
Silicon metal
Australia
3/8/2017
A
A
A
N
4/11/2018
701-TA-568
Silicon metal
Brazil
3/8/2017
A
A
A
N
4/11/2018
701-TA-569
Silicon metal
Kazakhstan
3/8/2017
A
A
A
N
4/11/2018
701-TA-570
Aluminum foil
China
3/9/2017
A
A
A
A
4/9/2018
701-TA-573
Wire rod
Italy
3/28/2017
A
A
A
A
5/11/2018
701-TA-574
Wire rod
Turkey
3/28/2017
A
A
A
A
5/11/2018
701-TA-575
Tool chests
China
4/11/2017
A
A
A
A
1/16/2018
701-TA-576
Cold-drawn mechanical
tubing
China
4/19/2017
A
A
A
A
1/24/2018
701-TA-577
Cold-drawn mechanical
tubing
India
4/19/2017
A
A
A
A
1/24/2018
701-TA-578
100- to 150-seat large
civil aircraft
Canada
4/27/2017
A
A
A
N
2/9/2018
701-TA-579
Fine denier polyester
staple fiber
China
5/31/2017
A
A
A
A
3/7/2018
701-TA-580
Fine denier polyester
staple fiber
India
5/31/2017
A
A
A
A
3/7/2018
701-TA-581
Citric acid
Thailand
6/2/2017
A
A
N
(c)
6/5/2018
701-TA-582
Ripe olives
Spain
6/22/2017
A
A
A
A
7/25/2018
701-TA-583
Cast iron soil pipe
fittings
China
7/13/2017
A
A
A
A
8/22/2018
701-TA-584
Uncoated groundwood paper
Canada
8/9/2017
A
A
A
N
9/24/2018
701-TA-585
Stainless steel flanges
China
8/16/2017
A
A
A
A
5/29/2018
701-TA-586
Stainless steel flanges
India
8/16/2017
A
A
A
A
10/1/2018
701-TA-588
PFTE resin
India
9/28/2017
A
A
A
N
7/6/2018
701-TA-589
Forged steel fittings
China
10/5/2017
A
A
A
A
11/19/2018
701-TA-590
Sodium Gluconate
China
11/30/2017
A
A
A
A
11/1/2018
701-TA-591
Common alloy aluminum
sheet
China
12/1/2017
A
A
A
A
(d)
701-TA-592
Plastic decorative ribbon
China
12/27/2017
A
A
(d)
(d)
(d)
701-TA-593
Large diameter welded pipe
China
01/17/2018
A
A
A
(d)
(d)
701-TA-594
Large diameter welded pipe
India
01/17/2018
A
A
A
(d)
(d)
701-TA-595
Large diameter welded pipe
South Korea
01/17/2018
A
A
(d)
(d)
(d)
701-TA-596
Large diameter welded pipe
Turkey
01/17/2018
A
A
(d)
(d)
(d)
701-TA-597
Cast iron soil pipe
China
01/26/2018
A
A
A
(d)
(d)
701-TA-598
Rubber bands
China
01/30/2018
A
A
A
(d)
(d)
701-TA-599
Rubber bands
Sri Lanka
01/30/2018
T
(c)
(c)
(c)
3/19/2018
701-TA-600
Rubber bands
Thailand
01/30/2018
A
A
(d)
(d)
(d)
701-TA-601
Laminated woven sacks
Vietnam
03/07/2018
A
A
(d)
(d)
(d)
701-TA-602
Steel wheels
China
03/27/2018
A
A
(d)
(d)
(d)
701-TA-603
Glycine
China
03/28/2018
A
A
(d)
(d)
(d)
701-TA-604
Glycine
India
03/28/2018
A
A
(d)
(d)
(d)
701-TA-605
Glycine
Thailand
03/28/2018
A
N
(c)
(c)
5/21/2018
701-TA-606
Quartz surface products
China
04/17/2018
A
A
(d)
(d)
(d)
701-TA-607
Steel propane cylinders
China
05/22/2018
A
A
(d)
(d)
(d)
701-TA-608
Steel racks
China
06/21/2018
A
A
(d)
(d)
(d)
701-TA-609
Steel trailer wheels
China
08/09/2018
A
A
(d)
(d)
(d)
701-TA-610
Refillable stainless steel
kegs
China
09/20/2018
A
(d)
(d)
(d)
(d)
701-TA-611
Aluminum wire and cable
China
09/21/2018
A
(d)
(d)
(d)
(d)
701-TA-612
Polyester textured yarn
China
10/18/2018
A
(d)
(d)
(d)
(d)
701-TA-613
Polyester textured yarn
India
10/18/2018
A
(d)
(d)
(d)
(d)
701-TA-614
Magnesium
Israel
10/24/2018
A
(d)
(d)
(d)
(d)
Source: U.S. International Trade
Commission (USITC).
a
“ITA” is the International Trade Administration of the U.S. Department of
Commerce (USDOC).
b
For
cases in which the final action was taken by the ITA, the date shown is the
Federal
Register
notice date of that action. For cases in which the final action
was taken by USITC, the date of the USITC notification of USDOC is shown.
c
Investigation was terminated due to negative determination, negligibility, or
withdrawal of the petition.
d
Pending
or not applicable as of December 31, 2018.
Table
A.13
Countervailing duty
orders and suspension agreements in effect as of December 31, 2018
Seamless carbon and alloy
steel standard, line, and pressure pipe
November 10, 2010
Coated paper suitable for
high-quality print graphics using sheet-fed presses
November 17, 2010
Aluminum extrusions
May 26, 2011
Multilayered wood flooring
December 8, 2011
High pressure steel
cylinders
June 21, 2012
Crystalline silicon
photovoltaic cells
December 7, 2012
Utility scale wind towers
February 15, 2013
Drawn stainless steel
sinks
April 11, 2013
Chlorinated isocyanurates
November 13, 2014
Non-oriented electrical
steel
December 3, 2014
Carbon and certain alloy
steel wire
January 8, 2015
Calcium hypochlorite
January 30, 2015
Crystalline silicon
photovoltaic products
February 18, 2015
Passenger vehicle and
light truck tires
August 10, 2015
Boltless steel shelving
units prepackaged for sale
October 21, 2015
Melamine
December 28, 2015
Uncoated paper
March 5, 2016
Polyethylene terephthalate
resin
May 6, 2016
Cold-rolled steel flat
products
July 14, 2016
Corrosion-resistant steel
products
July 25, 2016
Biaxial integral geogrid products
March 3, 2017
Ammonium sulfate
March 6, 2017
Amorphous silica fabric
March 6, 2017
Carbon and alloy steel
cut-to-length plate
March 9, 2017
Stainless steel sheet and
strip
March 17, 2017
1-hydroxyethylidene-1,
1-diphosphonic acid (hedp)
March 20, 2017
Hardwood plywood products
January 4, 2018
Tool Chests and Cabinets
January 24, 2018
Cold-Drawn Mechanical
Tubing of Carbon and Alloy Steel
February 1, 2018
Fine denier polyester
staple fiber
March 16, 2018
Aluminum foil
April 19, 2018
Stainless steel flanges
June 5, 2018
Cast iron soil pipe
fittings
August 31, 2018
Sodium gluconate
November 13, 2018
Forged steel fittings
November 26, 2018
India
Sulfanilic acid
March 2, 1993
Carbon steel plate
February 10, 2000
Hot-rolled carbon steel
flat products
December 3, 2001
Polyethylene terephthalate
(PET) film
July 1, 2002
Prestressed concrete steel
wire strand
February 4, 2004
Carbazole violet pigment
23
December 29, 2004
Certain lined paper
September 28, 2006
Commodity matchbooks
December 11, 2009
Oil country tubular goods
September 10, 2014
Polyethylene terephthalate
resin
May 6, 2016
Corrosion-resistant steel
products
July 25, 2016
Cold-rolled steel flat
products
September 20, 2016
Welded stainless pressure
pipe
November 17, 2016
New pneumatic off-the-road
tires
April 3, 2017
Finished carbon steel
flanges
May 18, 2017
Cold-drawn mechanical
tubing of carbon and alloy steel
February 21, 2018
Fine denier polyester
staple fiber
March 16, 2018
Stainless steel flanges
October 05, 2018
Indonesia
Carbon steel plate
February 10, 2000
Hot-rolled carbon steel
flat products
December 3, 2001
Coated paper suitable for
high-quality print graphics using sheet-fed presses
November 17, 2010
Uncoated paper
March 5, 2016
Biodiesel
January 4, 2018
Iran
Raw in-shell pistachios
March 11, 1986
Roasted in-shell
pistachios
October 7, 1986
Italy
Pasta
July 24, 1996
Corrosion-resistant steel
products
July 25, 2016
Carbon and alloy steel
wire rod
May 21, 2018
Russia
Uranium (suspended)
October 16, 1992
South Africa
Stainless steel plate in
coils
May 11, 1999
South Korea
Stainless steel sheet
& strip
August 6, 1999
Carbon steel plate
February 10, 2000
Large residential washers
February 15, 2013
Corrosion-resistant steel
products
July 25, 2016
Cold-rolled steel flat
products
September 20, 2016
Hot-rolled carbon steel
flat products
October 3, 2016
Carbon and alloy steel
cut-to-length plate
May 25, 2017
Spain
Ripe olives
August 01, 2018
Taiwan
Non-oriented electrical
steel
December 3, 2014
Thailand
Hot-rolled carbon steel
flat products
December 3, 2001
Turkey
Welded carbon steel pipe
March 7, 1986
Pasta
July 24, 1996
Oil country tubular goods
September 10, 2014
Steel concrete reinforcing
bar
November 6, 2014
Welded line pipe
December 1, 2015
Heavy walled rectangular
welded carbon steel pipes and tubes
September 13, 2016
Steel concrete reinforcing
bar
August 24, 2017
Carbon and alloy steel
wire rod
May 21, 2018
Vietnam
Polyethylene retail
carrier bags
May 4, 2010
Steel wire garment hangers
February 5, 2013
Steel nails
July 14, 2015
Source: U.S. International Trade Commission
(USITC).
Table
A.14
Reviews of existing antidumping
and countervailing duty orders and suspended investigations completed in 2018,
by date of completion
USITC investigation
number
Product
Country of origin
Action
Completion date
a
731-TA-866
Stainless steel butt-weld
pipe fittings
Malaysia
Continued
1/8/2018
731-TA-865
Stainless steel butt-weld
pipe fittings
Italy
Continued
1/8/2018
731-TA-867
Stainless steel butt-weld
pipe fittings
Philippines
Continued
1/8/2018
731-TA-536
Circular welded nonalloy
steel pipe
Taiwan
Continued
1/18/2018
731-TA-534
Circular welded nonalloy
steel pipe
Mexico
Continued
1/18/2018
731-TA-532
Circular welded nonalloy
steel pipe
Brazil
Continued
1/18/2018
731-TA-533
Circular welded nonalloy
steel pipe
South Korea
Continued
1/18/2018
731-TA-132
Small diameter carbon
steel pipe
Taiwan
Continued
1/18/2018
731-TA-271
Welded carbon steel pipe
India
Continued
1/18/2018
731-TA-273
Welded carbon steel pipe
Turkey
Continued
1/18/2018
731-TA-252
Welded carbon steel pipe
Thailand
Continued
1/18/2018
701-TA-253
Welded carbon steel pipe
Turkey
Continued
1/18/2018
731-TA-1095
Lined paper school
supplies
China
Continued
2/2/2018
701-TA-442
Lined paper school
supplies
India
Continued
2/2/2018
731-TA-1096
Lined paper school
supplies
India
Continued
2/2/2018
731-TA-709
Seamless pipe
Germany
Continued
2/13/2018
701-TA-389
Cut-to-length carbon steel
plate
Indonesia
Continued
2/26/2018
701-TA-388
Cut-to-length carbon steel
plate
India
Continued
2/26/2018
701-TA-391
Cut-to-length carbon steel
plate
South Korea
Continued
2/26/2018
731-TA-817
Cut-to-length carbon steel
plate
India
Continued
2/26/2018
731-TA-818
Cut-to-length carbon steel
plate
Indonesia
Continued
2/26/2018
731-TA-821
Cut-to-length carbon steel
plate
South Korea
Continued
2/26/2018
731-TA-895
Pure magnesium
China
Continued
2/27/2018
731-TA-1104
Polyester staple fiber
China
Continued
3/15/2018
731-TA-893
Honey
China
Continued
4/16/2018
731-TA-891
Foundry coke
China
Continued
4/18/2018
731-TA-472
Silicon metal
China
Continued
5/15/2018
701-TA-487
Steel wire garment hangers
Vietnam
Continued
5/16/2018
731-TA-1198
Steel wire garment hangers
Vietnam
Continued
5/16/2018
731-TA-1197
Steel wire garment hangers
Taiwan
Continued
5/16/2018
731-TA-894
Ammonium nitrate
Ukraine
Terminated
6/12/2018
731-TA-860
Tin- and chromium-coated
steel sheet
Japan
Continued
6/19/2018
731-TA-1103
Activated carbon
China
Continued
6/29/2018
731-TA-921
Folding gift boxes
China
Continued
7/2/2018
701-TA-489
Drawn stainless steel
sinks
China
Continued
8/14/2018
731-TA-1201
Drawn stainless steel
sinks
China
Continued
8/14/2018
731-TA-679
Stainless steel bar
India
Continued
9/17/2018
731-TA-344
Tapered roller bearings
China
Continued
9/24/2018
731-TA-1189
Large power transformers
South Korea
Continued
9/26/2018
731-TA-678
Stainless steel bar
Brazil
Revoked
10/3/2018
731-TA-681
Stainless steel bar
Japan
Revoked
10/3/2018
731-TA-682
Stainless steel bar
Spain
Revoked
10/3/2018
731-TA-1203
Xanthan gum
China
Continued
11/15/2018
731-TA-673
Silicomanganese
Ukraine
Continued
11/30/2018
731-TA-672
Silicomanganese
China
Continued
11/30/2018
731-TA-873
Steel concrete reinforcing
bar
Belarus
Continued
11/30/2018
731-TA-874
Steel concrete reinforcing
bar
China
Continued
11/30/2018
731-TA-880
Steel concrete reinforcing
bar
Poland
Continued
11/30/2018
731-TA-878
Steel concrete reinforcing
bar
Latvia
Continued
11/30/2018
731-TA-875
Steel concrete reinforcing
bar
Indonesia
Continued
11/30/2018
731-TA-882
Steel concrete reinforcing
bar
Ukraine
Continued
11/30/2018
731-TA-879
Steel concrete reinforcing
bar
Moldova
Continued
11/30/2018
731-TA-739
Clad steel plate
Japan
Continued
12/6/2018
731-TA-1110
Sodium Hexametaphosphate
China
Continued
12/7/2018
731-TA-909
Low enriched uranium
France
Terminated
12/24/2018
Source: U.S. International Trade Commission (USITC).
a
The completion date shown is the date
of the USITC notification of U.S. Department of Commerce, except in the case of
a revocation where the date shown is the date of the International Trade
Administration’s
Federal Register
notice.
Table
A.15
Section 337
investigations and related proceedings completed by the Commission during 2018
and those pending on December 31, 2018
Status of
investigation
Article
Country
a
Commission
determination
b
Completed
337-TA-921
Certain marine sonar
imaging devices, including downscan and sidescan devices, products containing
the same, and components thereof
Taiwan
One related (ancillary)
enforcement proceeding and one related (ancillary) rescission proceeding; terminated
based on a settlement agreement.
337-TA-929
Certain beverage brewing
capsules,
components thereof, and
products containing same
China, Hong Kong
One related (ancillary)
rescission proceeding; remedial order temporarily rescinded.
337-TA-933
Certain stainless steel
products, certain processes for manufacturing or relating to same and certain
products containing same
India, Germany, Taiwan
One related (ancillary)
bond forfeiture proceeding; bond forfeited.
337-TA-943
Certain wireless headsets
Ireland, Australia,
Singapore, Denmark, Germany, Japan
One related (ancillary)
remand proceeding; terminated based on a settlement agreement.
337-TA-944
Certain network devices,
related software and components thereof (I)
No foreign respondents
One related (ancillary)
enforcement proceeding; terminated based on a settlement agreement.
337-TA-945
Certain network devices,
related software and components thereof (II)
No foreign respondents
One related (ancillary)
modification proceeding and one related (ancillary) bond return proceeding;
terminated based on a settlement agreement; bond returned.
337-TA-989
Certain automated teller
machines, ATM modules, components thereof, and products containing the same
No foreign respondents
One related (ancillary)
rescission proceeding; remedial orders rescinded.
337-TA-990
Certain mobile electronic
devices incorporating haptics (including smartphones and smartwatches) and
components thereof
No foreign respondents
Terminated based on a
settlement agreement.
337-TA-1002
Certain carbon and alloy
steel products
China, Hong Kong
Terminated based on a
finding of no violation; request for relief abandoned.
337-TA-1003
Certain composite aerogel
insulation materials and methods for manufacturing the same
China
Issued a limited exclusion
order.
337-TA-1004
Certain mobile and
portable electronic devices incorporating haptics (including smartphones and
laptops) and components thereof
No foreign respondents
Terminated based on a
settlement agreement.
337-TA-1012
Certain magnetic data
storage tapes and cartridges containing the same
Japan
Issued a limited exclusion
order and three cease and desist orders.
337-TA-1012
Certain magnetic data
storage tapes and cartridges containing the same
Japan
One related (ancillary)
modification proceeding; terminated based on withdrawal of the petition.
337-TA-1016
Certain access control
systems and components thereof
China, Hong Kong
Issued a limited exclusion
order and three cease and desist orders.
337-TA-1023
Certain memory modules and
components thereof, and products containing same
South Korea
Terminated based on a
finding of no violation.
337-TA-1026
Certain audio processing
hardware, software, and products containing the same
South Korea
Terminated based on a
finding of no violation.
337-TA-1028
Certain mobile device
holders and components thereof
China, Hong Kong
Issued a limited exclusion
order and sixteen cease and desist orders.
337-TA-1031
Certain UV curable
coatings for optical fibers, coated optical fibers, and products containing
same
China
Terminated based on a
finding of no violation.
337-TA-1032
Certain single-molecule
nucleic acid sequencing systems and reagents, consumables, and software for
use with same
United Kingdom
Terminated based on a
finding of no violation.
337-TA-1033
Certain arrowheads with
arcuate blades and components thereof
China
Issued a general exclusion
order.
337-TA-1036
Certain magnetic tape
cartridges and components thereof
Japan
Terminated based on a
finding of no violation.
337-TA-1042
Certain hybrid electric
vehicles and components thereof
No foreign respondents
Terminated based on a
settlement agreement.
337-TA-1044
Certain graphics systems,
components thereof, and consumer products containing the same
South Korea, Taiwan
Issued a limited exclusion
order and two cease and desist orders.
337-TA-1044
Certain graphics systems,
components thereof, and consumer products containing the same
South Korea, Taiwan
One related (ancillary)
modification and rescission proceeding; remedial orders modified and
rescinded in part.
337-TA-1046
Certain nonvolatile memory
devices and products containing same
Japan, Philippines
Issued a limited exclusion
order and three cease and desist orders.
337-TA-1046
Certain nonvolatile memory
devices and products containing same
Japan, Philippines
One related (ancillary)
rescission proceeding; remedial orders rescinded.
337-TA-1047
Certain semiconductor
devices and consumer audiovisual products containing the same
Japan, South Korea, Taiwan
Terminated based on a
finding of no violation.
337-TA-1049
Certain digital cable and
satellite products, set-top boxes, gateways and components thereof
United Kingdom
Terminated based on a
settlement agreement.
337-TA-1050
Certain dental ceramics,
products thereof, and methods of making the same
Japan
Terminated based on a
finding of no violation.
337-TA-1053
Certain two-way radio
equipment and systems, related software and components thereof
China
Issued a limited exclusion
order and two cease and desist orders.
337-TA-1055
Certain mirrors with
internal illumination and components thereof
Canada
Issued a limited exclusion
order and a cease and desist order.
337-TA-1056
Certain collapsible
sockets for mobile electronic devices and components thereof
Hong Kong, China
Issued a general exclusion
order.
337-TA-1057
Certain robotic vacuum
cleaning devices and components thereof such as spare parts
Canada, Taiwan, China
Issued a limited exclusion
order and four cease and desist orders.
337-TA-1060
Certain consumer
electronic devices, including televisions, gaming consoles, mobile phones and
tablets, and network-enabled DVD and Blu-ray players
Japan
Terminated based on a
settlement agreement.
337-TA-1061
Certain bar code readers,
scan engines, products containing the same, and components thereof
Singapore
Terminated based on a
settlement agreement.
337-TA-1064
Certain shielded
electrical ribbon cables and products containing the same
China, Taiwan
Terminated based on a
consent order.
337-TA-1066
Certain recombinant factor
IX products
Germany, Switzerland
Terminated based on
withdrawal of the complaint.
337-TA-1069
Certain pool and spa
enclosures
Czech Republic, Slovakia
Terminated based on a
settlement agreement.
337-TA-1070
Certain periodontal laser
devices and components thereof
Slovenia
Terminated based on
withdrawal of the complaint.
337-TA-1071
Certain wireless audio
systems and components thereof
Canada
Terminated based on a
settlement agreement.
337-TA-1072
Certain Wi-Fi enabled
electronic devices and components thereof
China, Hong Kong
Terminated based on
withdrawal of the complaint.
337-TA-1077
Certain reusable diapers,
components thereof, and products containing the same
China
Terminated based on
withdrawal of the complaint.
337-TA-1078
Certain amorphous metal
and products containing same
China
Terminated based on
withdrawal of the complaint.
337-TA-1079
Certain shaving
cartridges, components thereof and products containing same
China
Terminated based on a
settlement agreement.
337-TA-1080
Certain wafer-level packaging
semiconductor devices and products containing same (including cellular
phones, tablets, laptops, and notebooks) and components thereof
South Korea
Terminated based on an
arbitration agreement.
337-TA-1083
Certain personal
computers, mobile devices, digital media players, and microconsoles
No foreign respondents
Terminated based on a
settlement agreement.
337-TA-1084
Certain insulated beverage
containers, components, labels, and packaging materials thereof
Hong Kong, China
Issued a limited exclusion
order.
337-TA-1085
Certain glucosylated
steviol glycosides, and products containing same
China
Terminated based on a
settlement agreement.
337-TA-1092
Certain self-anchoring
beverage containers
China, Ukraine, Lithuania,
Taiwan
Issued a general exclusion
order.
337-TA-1094
Certain IOT devices and
components thereof (IOT, the internet of things)—web applications displayed
on a web browser
South Korea
Terminated based on good
cause.
337-TA-1095
Certain load supporting
systems, including composite mat systems, and components thereof
United Kingdom
Terminated based on a
settlement agreement.
337-TA-1096
Certain microperforated
packaging containing fresh produce
No foreign respondents
Terminated based on a
settlement agreement.
337-TA-1101
Certain fuel pump
assemblies having vapor separators and components thereof
China
Issued a limited exclusion
order.
337-TA-1102
Certain light engines and
components thereof
Canada
Terminated based on a
consent order.
337-TA-1104
Certain multi-domain test
and measurement instruments
Germany
Terminated based on
withdrawal of the complaint.
337-TA-1105
Certain programmable logic
controllers (PLCs), components thereof, and products containing same
No foreign respondents
Terminated based on
withdrawal of the complaint.
337-TA-1108
Certain jump rope systems
China
Issued a limited exclusion
order.
337-TA-1109
Certain clidinium bromide
and products containing same
No foreign respondents
Terminated based on
withdrawal of the complaint.
337-TA-1113
Certain submarine telecommunication
systems and components thereof
No foreign respondents
Terminated based on
withdrawal of the complaint.
Pending
337-TA-930
Certain laser abraded
denim garments
Canada, Italy, Sweden
One related (ancillary)
declassification proceeding; pending before the Commission.
337-TA-936
Certain footwear products
Canada, Italy, Australia,
China
One related (ancillary)
remand proceeding; pending before the Commission.
337-TA-944
Certain network devices,
related software and components thereof (I)
No foreign respondents
One related (ancillary)
modification proceeding; pending before the Commission.
337-TA-971
Certain air mattress
systems, components thereof, and methods of using the same
No foreign respondents
One related (ancillary) remand
proceeding; pending before the Commission.
337-TA-989
Certain automated teller
machines, ATM modules, components thereof, and products containing the same
No foreign respondents
One related (ancillary)
enforcement proceeding; pending before the Commission.
337-TA-1000
Certain motorized
self-balancing vehicles
Hong Kong, China
One related (ancillary)
remand proceeding; pending before the Commission.
337-TA-1005
Certain L-tryptophan,
L-tryptophan products, and their methods of production
South Korea, Indonesia
One related (ancillary)
remand proceeding; pending before the Commission.
337-TA-1012
Certain magnetic data
storage tapes and cartridges containing the same
Japan
One related (ancillary)
enforcement proceeding; pending before the ALJ.
337-TA-1016
Certain access control
systems and components thereof
China, Hong Kong
One related (ancillary)
modification proceeding; pending before the ALJ.
337-TA-1024
Certain integrated
circuits with voltage regulators and products containing same
China, Ireland, Vietnam,
Israel, Malaysia
Pending before the ALJ.
337-TA-1043
Certain electronic
connectors, components thereof, and products containing the same
China, Taiwan, Germany,
Brazil, Mexico
Pending before the ALJ.
337-TA-1044
Certain graphics systems,
components thereof, and consumer products containing the same
South Korea, Taiwan
One related (ancillary)
declassification proceeding; pending before the ALJ.
337-TA-1058
Certain magnetic tape
cartridges and components thereof
Japan
Pending before the
Commission.
337-TA-1059
Certain digital cameras,
software, and components thereof
Thailand, Japan, China,
Indonesia
Pending before the
Commission.
337-TA-1063
Certain x-ray breast
imaging devices and components thereof
Japan
Pending before the Commission.
337-TA-1065
Certain mobile electronic
devices and radio frequency and processing components thereof
No foreign respondents
Pending before the
Commission.
337-TA-1067
Certain road milling
machines and components thereof
Switzerland, Italy
Pending before the
Commission.
337-TA-1068
Certain microfluidic
devices
No foreign respondents
Pending before the
Commission.
337-TA-1073
Certain
thermoplastic-encapsulated electric motors, components thereof, and products
and vehicles containing same
Japan, Germany
Pending before the
Commission.
337-TA-1074
Certain industrial
automation systems and components thereof including control systems,
controllers, visualization hardware, motion and motor control systems,
networking equipment, safety devices, and power supplies
China, Hong Kong
Pending before the
Commission.
337-TA-1075
Certain electrochemical
glucose monitoring systems and components thereof
No foreign respondents
Pending before the
Commission.
337-TA-1076
Certain magnetic data
storage tapes and cartridges containing the same (II)
Japan
Pending before the
Commission.
337-TA-1081
Certain LED lighting
devices, LED power supplies, and components thereof
China
Pending before the
Commission.
337-TA-1082
Certain gas spring nailer
products and components thereof
No foreign respondents
Pending before the ALJ.
337-TA-1086
Certain mounting
apparatuses for holding portable electronic devices and components thereof
China
Pending before the
Commission.
337-TA-1087
Certain batteries and
electrochemical devices containing composite separators, components thereof,
and products containing same
Hong Kong, China
Pending before the ALJ.
337-TA-1088
Certain road construction
machines and components thereof
Germany
Pending before the ALJ.
337-TA-1089
Certain memory modules and
components thereof
South Korea
Pending before the ALJ.
337-TA-1090
Certain intraoral scanners
and related hardware and software
Denmark
Pending before the ALJ.
337-TA-1091
Certain color intraoral
scanners and related hardware and software
Denmark
Pending before the ALJ.
337-TA-1093
Certain mobile electronic
devices and radio
frequency processing components thereof (II)
No foreign respondents
Pending before the ALJ.
337-TA-1097
Certain solid state
storage drives, stacked electronics components, and products containing same
South Korea, China,
Taiwan, Japan
Pending before the ALJ.
337-TA-1098
Certain subsea
telecommunication systems and components thereof
Finland, Netherlands,
France, Japan
Pending before the ALJ.
337-TA-1099
Certain graphics
processors and products containing the same
Taiwan, Japan, Macau
Pending before the ALJ.
337-TA-1100
Certain microfluidic
systems and components thereof and products containing same
No foreign respondents
Pending before the ALJ.
337-TA-1103
Certain digital video
receivers and related hardware and software components
No foreign respondents
Pending before the ALJ.
337-TA-1106
Certain toner cartridges
and components thereof
China, Hong Kong, Macau,
Canada
Pending before the ALJ.
337-TA-1107
Certain LED lighting
devices and components thereof
China
Pending before the ALJ.
337-TA-1110
Certain strontium-rubidium
radioisotope infusion systems, and components thereof including generators
Canada, Singapore, India
Pending before the ALJ.
337-TA-1111
Certain portable gaming
console systems with attachable handheld controllers and components thereof
Japan
Pending before the ALJ.
337-TA-1112
Certain radio frequency
micro-needle dermatological treatment devices and components thereof
Israel, South Korea
Pending before the ALJ.
337-TA-1114
Certain modular LED
display panels and components thereof
China, Belgium, United
Kingdom, Hong Kong, France, Japan
Pending before the ALJ.
337-TA-1115
Certain blow-molded
bag-in-container devices, associated components, and end products containing
or using same
Netherlands
Pending before the ALJ.
337-TA-1116
Certain blood cholesterol
testing strips and associated systems containing the same
China
Pending before the ALJ.
337-TA-1117
Certain full-capture arrow
rests and components thereof
China
Pending before the ALJ.
337-TA-1118
Certain movable barrier
operator systems and components thereof
No foreign respondents.
Pending before the ALJ.
337-TA-1119
Certain infotainment
systems, components thereof, and automobiles containing the same
Japan
Pending before the ALJ.
337-TA-1120
Certain human milk
oligosaccharides and methods of producing the same
Germany
Pending before the ALJ,
337-TA-1121
Certain earpiece devices
and components thereof
China, Sweden
Pending before the ALJ.
337-TA-1122
Certain convertible sofas
and components thereof
Canada
Pending before the ALJ.
337-TA-1123
Certain carburetors and
products containing such carburetors
China, Ireland, Hong Kong
Pending before the ALJ
337-TA-1124
Certain powered cover
plates
China
Pending before the ALJ.
337-TA-1125
Certain height-adjustable
desk platforms and components thereof
China
Pending before the ALJ.
337-TA-1126
Certain water
filters and components thereof
China, Hong Kong
Pending before the ALJ.
337-TA-1127
Certain microperforated
packaging containing fresh produce (II)
No foreign respondents
Pending before the ALJ.
337-TA-1128
Certain lithography
machines and systems and components thereof (I)
Japan
Pending before the ALJ.
337-TA-1129
Certain lithography
machines and systems and components thereof (II)
Japan
Pending before the ALJ.
337-TA-1130
Certain beverage
dispensing systems and components thereof
Belgium
Pending before the ALJ.
337-TA-1131
Certain wireless mesh
networking products and related components thereof
Singapore, Malaysia,
Israel
Pending before the ALJ.
337-TA-1132
Certain motorized vehicles
and components thereof
India
Pending before the ALJ.
337-TA-1133
Certain unmanned aerial
vehicles and components thereof
China, Netherlands, Hong
Kong
Pending before the ALJ.
337-TA-1134
Certain sleep-disordered
breathing treatment mask systems and components thereof
New Zealand
Pending before the ALJ.
337-TA-1135
Certain strength-training
systems and components thereof
China
Pending before the ALJ.
337-TA-1136
Certain obstructive sleep
apnea treatment mask systems and components thereof
Australia
Pending before the ALJ.
337-TA-1137
Certain semiconductor
lithography systems and components thereof
Japan
Pending before the ALJ.
337-TA-1138
Certain LTE- and
3G-compliant cellular communications devices
Taiwan, China
Pending before the ALJ.
337-TA-1139
Certain electronic
nicotine delivery systems and components thereof
France, Uruguay, China
Pending before the ALJ.
337-TA-1140
Certain multi-stage fuel
vapor canister systems and activated carbon components thereof
Japan, Mexico, Canada
Pending before the ALJ.
337-TA-1141
Certain cartridges for
electronic nicotine delivery systems and components thereof
China, Uruguay
Pending before the ALJ.
Source: U.S. International Trade
Commission (USITC).
a
This column lists the countries of the foreign respondents named in the
original notice of investigation and may thus not reflect the remaining
respondents at the time of the final decision or during any ancillary
proceeding. “Hong Kong” refers to “Hong Kong, China”; “Macau” refers to “Macau,
China.”
b
ALJ = Administrative Law Judge.
Table
A.16
Outstanding section 337
exclusion orders at the USITC as of December 31, 2018
Investigation no.
Article
Country
a
Date patent expires
b
337-TA-69
Certain airtight cast-iron
stoves
Taiwan, South Korea
Nonpatent
337-TA-87
Certain coin-operated
audio-visual games and components thereof
Japan, Taiwan
Nonpatent
337-TA-105
Certain coin-operated
audio-visual games and components thereof (namely, Rally-X and Pac-Man)
Japan, Taiwan
Nonpatent
337-TA-112
Certain cube puzzles
Taiwan, Japan
Nonpatent
337-TA-114
Certain miniature plug-in
blade fuses
Taiwan
Nonpatent
337-TA-118
Certain sneakers with
fabric uppers and rubber soles
South Korea
Nonpatent
337-TA-137
Certain heavy-duty staple
gun tackers
Taiwan, Hong Kong, South
Korea
Nonpatent
337-TA-152
Certain plastic food
storage containers
Hong Kong, Taiwan
Nonpatent
337-TA-167
Certain single handle
faucets
Taiwan
Nonpatent
337-TA-174
Certain woodworking
machines
Taiwan, South Africa
Nonpatent
337-TA-195
Certain cloisonne jewelry
Taiwan
Nonpatent
337-TA-197
Certain compound action
metal cutting snips and components thereof
Taiwan
Nonpatent
337-TA-229
Certain nut jewelry and
parts thereof
Philippines, Taiwan
Nonpatent
337-TA-231
Certain soft sculpture
dolls, popularly known as “Cabbage Patch Kids,” related literature and
packaging therefor
No foreign respondents
Nonpatent
337-TA-266
Certain reclosable plastic
bags and tubing
Singapore, Taiwan, South
Korea, Thailand, Hong Kong, Malaysia
Nonpatent
337-TA-279
Certain plastic light duty
screw anchors
Taiwan
Nonpatent
337-TA-285
Certain chemiluminescent
compositions and components thereof and methods of using, and products
incorporating, the same
France
Nonpatent
337-TA-319
Certain automotive fuel
caps and radiator caps and related packaging and promotional materials
Taiwan
Nonpatent
337-TA-321
Certain soft drinks and
their containers
Colombia
Nonpatent
337-TA-378
Certain Asian-style
kamaboko fish cakes
Japan
Nonpatent
337-TA-380
Certain agricultural
tractors under 50 power take-off horsepower
Japan
Nonpatent
337-TA-424
Certain cigarettes and
packaging thereof
No foreign respondents
Nonpatent
337-TA-486
Certain agricultural
tractors, lawn tractors, riding lawnmowers, and components thereof
China
Nonpatent
337-TA-487
c
Certain agricultural
vehicles and components thereof
China, Netherlands,
France, Germany, Canada
Nonpatent
337-TA-494
Certain automotive
measuring devices, products containing same, and bezels for such devices
Taiwan
Nonpatent
337-TA-500
Certain purple protective
gloves
Malaysia
Nonpatent
337-TA-522
Certain ink markers and
packaging thereof
China, India, South Korea,
Hong Kong
Nonpatent
337-TA-541
Certain power supply
controllers and products containing same
Taiwan
Sept. 24, 2019
Sept. 24, 2019
337-TA-549
Certain ink sticks for
solid ink printers
South Korea
Apr. 29, 2022
Apr. 29, 2022
Apr. 29, 2022
337-TA-557
Certain automotive parts
Taiwan
Mar. 1, 2019
Mar. 22, 2019
337-TA-563
Certain portable power
stations and packaging therefor
China
Nonpatent
337-TA-565
Certain ink cartridges and
components thereof
Hong Kong, China, Macau,
Germany, South Korea
May 18, 2019
May 18, 2019
Apr. 3, 2022
Aug. 17, 2023
Aug. 26, 2023
337-TA-567
Certain foam footwear
Canada
Mar. 28, 2020
Oct. 3, 2020
337-TA-575
Certain lighters
Hong Kong, China
Nonpatent
337-TA-582
Certain hydraulic
excavators and components thereof
Canada
Nonpatent
337-TA-588
Certain digital
multimeters, and products with multimeter functionality
Hong Kong, China
Nonpatent
337-TA-590
Certain coupler devices
for power supply facilities, components thereof, and products containing same
Taiwan, Germany, China
Aug. 5, 2024
337-TA-604
Certain sucralose,
sweeteners containing sucralose, and related intermediate compounds thereof
China, United Kingdom,
Hong Kong
Apr. 18, 2023
337-TA-611
Certain magnifying loupe
products and components thereof
China
May 20, 2022
337-TA-615
Certain ground fault
circuit interrupters and products containing the same
China
Nov. 21, 2020
May 3, 2021
Apr. 28, 2025
337-TA-629
Certain silicon microphone
packages and products containing the same
Malaysia
June 21, 2021
Sept. 16, 2022
337-TA-637
Certain hair irons and
packaging thereof
Singapore, China, Hong
Kong
Nonpatent
337-TA-643
Certain cigarettes and
packaging thereof
Moldova, Belize,
Singapore, Ukraine, Kyrgyzstan, Gibraltar, United Kingdom, Switzerland
Nonpatent
337-TA-650
Certain coaxial cable
connectors and components thereof and products containing same
Taiwan, China
Jan. 24, 2020
337-TA-655
Certain cast steel railway
wheels, processes for manufacturing or relating to same and certain products
containing same
China
Nonpatent
337-TA-678
Certain energy drink
products
No foreign respondents
Nonpatent
337-TA-679
Certain products
advertised as containing creatine ethyl ester
No foreign respondents
Nonpatent
337-TA-700
Certain MEMS devices and
products containing same
No foreign respondents
Jan. 29, 2021
337-TA-718
Certain electronic paper
towel dispensing devices and components thereof
Canada, Hong Kong, Taiwan,
Turkey
Feb. 9, 2021
Feb. 9, 2021
Mar. 15, 2021
May 27, 2021
337-TA-720
Certain biometric scanning
devices, components thereof, associated software, and products containing the
same
South Korea
Jan. 16, 2023
337-TA-722
Certain automotive
vehicles and designs therefore
China
Jan. 3, 2020
337-TA-723
Certain inkjet ink
cartridges with printheads and components thereof
Taiwan, China, Hong Kong
Aug. 30, 2019
July 24, 2020
July 24, 2020
Oct. 30, 2020
Oct. 30, 2020
337-TA-725
Certain caskets
Mexico
Sept. 13, 2020
337-TA-730
Certain inkjet ink
supplies and components thereof
China
Aug. 20, 2023
Oct. 29, 2023
337-TA-739
Certain ground fault
circuit interrupters and products containing same
China
Oct. 21, 2023
337-TA-740
Certain toner cartridges
and components thereof
China, Hong Kong, Canada,
South Korea, Macau
Sept. 22, 2019
July 18, 2021
July 15, 2022
July 15, 2022
Apr. 29, 2023
May 21, 2023
Dec. 19, 2024
337-TA-754
Certain handbags, luggage,
accessories, and packaging thereof
China
Nonpatent
337-TA-763
Certain radio control
hobby transmitters and receivers and products containing same
China
Nonpatent
Oct. 18, 2025
337-TA-780
Certain protective cases
and components thereof
China, Hong Kong
Nonpatent
Sept. 29, 2023
May 11, 2024
June 15, 2024
June 15, 2024
Mar. 22, 2025
Apr. 19, 2025
Jan. 25, 2029
337-TA-791/826
Certain electric
fireplaces, components thereof, manuals for same, certain processes for
manufacturing or relating to same and certain products containing same; and
certain electric fireplaces, components thereof, manuals for same, certain processes
for manufacturing or relating to same and certain products containing same
China
Nonpatent
337-TA-796
Certain electronic digital
media devices and components thereof
South Korea
Sept. 6, 2026
Jan. 5, 2027
337-TA-804
Certain LED photographic lighting
devices and components thereof
China, Taiwan
Dec. 7, 2021
Dec. 7, 2021
337-TA-807
Certain digital photo
frames and image display devices and components thereof
Taiwan, Canada, Japan
July 6, 2020
Dec. 26, 2020
Oct. 29, 2021
337-TA-832
Certain ink application
devices and components thereof and methods of using the same
Canada, China
Feb. 28, 2020
Sept. 2, 2020
337-TA-849
Certain rubber resins and
processes for manufacturing same
China, Hong Kong, Canada
Nonpatent
337-TA-861/867
Certain cases for portable
electronic devices; and Certain cases for portable electronic devices
Taiwan, Hong Kong, China
Feb. 6, 2029
337-TA-878
Certain electronic devices
having placeshifting or display replication functionality and products
containing same
No foreign respondents
May 26, 2019
May 26, 2019
June 7, 2025
June 7, 2025
June 7, 2025
May 1, 2029
337-TA-883
Certain opaque polymers
Turkey, Netherlands
Nonpatent
337-TA-887
Certain crawler cranes and
components thereof
China
Nonpatent
May 12, 2027
337-TA-894
Certain tires and products
containing same
China, Thailand
Jan. 19, 2024
Mar. 2, 2024
Mar. 2, 2024
337-TA-895
Certain multiple mode
outdoor grills and parts thereof
Certain electric skin care
devices, brushes and chargers therefor, and kits containing same
South Korea, Israel,
Canada, United Kingdom, China
Nonpatent
June 27, 2020
July 4, 2024
Dec. 15, 2024
337-TA-965
Certain table saws
incorporating active injury mitigation technology and components thereof
Germany
Sept. 29, 2020
Feb. 1, 2022
337-TA-972
Certain automated teller
machines, ATM modules, components thereof, and products containing the same
South Korea
Dec. 9. 2027
337-TA-975
Certain computer cables,
chargers, adapters, peripheral devices and packaging containing the same
China
Nonpatent
337-TA-976
Certain woven textile
fabrics and products containing same
India
Nonpatent
337-TA-977
Certain arrowheads with
deploying blades and components thereof and packaging therefor
China
Nonpatent
Mar. 3, 2021
Mar. 3, 2021
Aug. 12, 2028
Aug. 19, 2028
Oct. 8, 2028
Jan. 8, 2033
Mar. 15, 2033
Apr. 18, 2033
337-TA-988
Certain pumping bras
China
July 29, 2030
337-TA-989
Certain automated teller
machines, ATM modules, components thereof, and products containing the same
No foreign respondents
Jan. 17, 2029
337-TA-1001
Certain digital video
receivers and hardware and software components thereof
United Kingdom, France
Sept. 18, 2019
Sept. 18, 2019
337-TA-1003
Certain composite aerogel
insulation materials and methods for manufacturing the same
China
Dec. 21, 2021
June 23, 2024
June 23, 2024
337-TA-1005
Certain L-tryptophan,
L-tryptophan products, and their methods of production
South Korea, Indonesia
June 15, 2023
337-TA-1007/1021
Certain personal
transporters, components thereof, and packaging and manuals therefor; and
Certain personal transporters and components thereof
Netherlands, China, Turkey
Nonpatent
337-TA-1008
Certain carbon spine
board, cervical collar, CPR masks and various medical training manikin
devices, and trademarks, copyrights of product catalogues, product inserts
and components thereof
China
Nonpatent
337-TA-1012
Certain magnetic data
storage tapes and cartridges containing the same
Japan
May 14, 2022
337-TA-1015
Certain hand dryers and
housings for hand dryers
United Kingdom, China
Nonpatent
337-TA-1028
Certain mobile device
holders and components thereof
China, Hong Kong
May 31, 2032
June 3, 2032
337-TA-1033
Certain arrowheads with
arcuate blades and components thereof
China
Mar. 12, 2033
Sept. 23, 2028
May 12, 2029
337-TA-1035
Certain liquid crystal
eWriters and components thereof
China
Mar. 9, 2026
Nov. 14, 2033
337-TA-1044
Certain graphics systems,
components thereof, and consumer products containing the same
South Korea, Taiwan
June 2, 2026
337-TA-1053
Certain two-way radio
equipment and systems, related software and components thereof
China
Apr. 13, 2026
Jan. 8, 2027
Nov. 14, 2030
337-TA-1055
Certain mirrors with
internal illumination and components thereof
Canada
Nov. 24, 2026
337-TA-1056
Certain collapsible
sockets for mobile electronic devices and components thereof
Hong Kong, China
Feb. 23, 2032
337-TA-1057
Certain robotic vacuum
cleaning devices and components thereof such as spare parts
Canada, Taiwan, China
Dec. 16, 2022
337-TA-1084
Certain insulated beverage
containers, components, labels, and packaging materials thereof
Hong Kong, China
Nonpatent
Mar. 29, 2030
Mar. 7, 2032
Mar. 14, 2032
337-TA-1092
Certain self-anchoring
beverage containers
China, Ukraine, Lithuania,
Taiwan
Oct. 4, 2031
337-TA-1101
Certain fuel pump
assemblies having vapor separators and components thereof
China
Aug. 17, 2019
337-TA-1108
Certain jump rope systems
China
Apr. 1, 2028
Jan. 7, 2029
Source: U.S. International Trade
Commission (USITC).
a
This column lists the countries of the foreign respondents named in the
original notice of investigation and may thus not reflect the countries of the
respondents covered by an exclusion order. “Hong Kong” refers to “Hong Kong,
China”; “Macau” refers to “Macau, China.”
b
Multiple dates indicate the expiration dates of separate patents within the
investigation.
c
There are three outstanding exclusion orders in inv. no. 337-TA-487.
d
There are two outstanding exclusion orders in inv. no. 337-TA-935.
e
There are two outstanding exclusion orders in inv. no. 337-TA-959.
Table
A.17
U.S. imports for
consumption claiming eligibility under the Generalized System of Preferences
(GSP), by source, 2016–18
Source
2016
2017
2018
% change 2017–18
Million $
India
4,741
5,691
6,307
10.8
Thailand
4,055
4,153
4,351
4.8
Brazil
2,197
2,498
2,483
-0.6
Indonesia
1,797
1,963
2,218
13.0
Turkey
1,464
1,659
1,925
16.0
Philippines
1,489
1,495
1,728
15.6
South Africa
986
1,114
879
-21.1
Cambodia
183
402
739
83.7
Ecuador
390
435
458
5.1
Argentina
0
0
379
(1)
Pakistan
247
328
326
-0.5
Tunisia
116
102
230
124.9
Sri Lanka
175
196
192
-1.8
Georgia
58
93
146
57.0
Kazakhstan
89
145
136
-6.0
Burma
3
94
117
24.3
Angola
1
<1
117
177,314.6
Serbia
80
91
93
2.9
Egypt
75
88
89
0.9
Bolivia
115
109
76
-30.0
Lebanon
65
74
64
-13.5
Zambia
2
<1
56
31,668.7
Zimbabwe
16
39
54
38.6
Paraguay
69
81
52
-35.8
Ukraine
54
55
48
-13.6
Subtotal, top 25 GSP
beneficiaries in 2018
18,467
20,906
23,262
11.3
All other beneficiaries
607
426
354
-16.9
Total U.S. imports for
consumption under the GSP
19,074
21,332
23,617
10.7
Source: USITC DataWeb/USDOC (accessed
May 9, 2019).
Note: Because of rounding, figures
may not add up to totals shown.
Table
A.18
Value of U.S. imports for
consumption claiming eligibility under the Generalized System of Preferences
(GSP), by USITC digest sector, 2016–18
Sector
Description
2016
2017
2018
% change 2017–18
Million $
1
Agricultural products
3,199
3,299
3,747
13.6
2
Forest products
572
668
740
10.8
3
Chemicals and related
products
3,835
4,558
5,282
15.9
4
Energy-related products
2
12
118
872.2
5
Textiles and apparel
630
690
735
6.5
6
Footwear
11
8
5
-33.8
7
Minerals and metals
3,386
4,212
3,813
-9.5
8
Machinery
2,183
2,144
2,304
7.5
9
Transportation equipment
2,456
2,506
2,624
4.7
10
Electronic products
1,154
1,121
1,110
-1.0
11
Miscellaneous manufactures
1,646
2,114
3,138
48.4
Total U.S. imports for
consumption under GSP
19,074
21,332
23,617
10.7
Source: USITC DataWeb/USDOC (accessed
May 9, 2019).
Note: Because of rounding, figures may
not add up to totals shown.
Table
A.19
Share of U.S. imports for
consumption claiming eligibility under the Generalized System of Preferences
(GSP), by USITC digest sector, 2016–18
Sector
Description
2016
2017
2018
1
Agricultural products
16.8
15.5
15.9
2
Forest products
3.0
3.1
3.1
3
Chemicals and related
products
20.1
21.4
22.4
4
Energy-related products
0.0
0.1
0.5
5
Textiles and apparel
3.3
3.2
3.1
6
Footwear
0.1
0.0
0.0
7
Minerals and metals
17.8
19.7
16.1
8
Machinery
11.4
10.0
9.8
9
Transportation equipment
12.9
11.7
11.1
10
Electronic products
6.0
5.3
4.7
11
Miscellaneous manufactures
8.6
9.9
13.3
Total U.S. imports for
consumption under the GSP
100.0
100.0
100.0
Source: USITC DataWeb/USDOC (accessed
May 9, 2019).
Note: Because of rounding, figures may
not add up to totals shown.
Table
A.20
Leading U.S. imports for
consumption claiming eligibility under the Generalized System of Preferences
(GSP), by HTS 6-digit subheading, 2016–18
HTS 6
Description
2016
2017
2018
% change 2017–18
Million $
7113.19
Jewelry and parts thereof,
of precious metal other than silver
555
664
658
-0.9
4202.92
Container bags, boxes,
cases and satchels n.e.s.o.i., with outer surface of sheeting of plastics or
of textile materials
27
171
435
154.5
7202.41
Ferrochromium, containing
more than 4% (wt.) carbon
263
481
365
-24.0
8708.99
Parts and accessories for
motor vehicles, n.e.s.o.i.
253
294
353
19.9
4015.19
Gloves, except surgical
and medical gloves, of vulcanized rubber, n.e.s.o.i.
Handbags, whether or not
with shoulder strap or handles, with outer surface of leather or of
composition leather
0
27
253
835.1
4202.22
Handbags, whether or not
with shoulder strap or handles, with outer surface of plastic sheeting or of
textile materials
11
97
252
159.3
8708.94
Steering wheels, steering
columns and steering boxes for motor vehicles
219
228
250
9.8
6802.91
Worked monumental or
building stone n.e.s.o.i., of marble, travertine and alabaster
189
223
242
8.4
1509.10
Olive oil and its
fractions, virgin, not chemically modified
82
83
230
178.3
6802.99
Worked monumental or
building stone n.e.s.o.i., of stone n.e.s.o.i.
233
273
221
-19.2
2008.99
Fruit and other edible
parts of plants, n.e.s.o.i., prepared or preserved, whether or not containing
added sweetening or spirit, n.e.s.o.i.
176
191
218
14.3
8415.9
Parts, n.e.s.o.i., of air
conditioning machines
261
223
217
-2.9
Total of items shown
2,717
3,817
4,521
18.4
All other HTS subheadings
16,358
17,515
19,095
9.0
Total of all commodities
19,074
21,332
23,617
10.7
Source: USITC DataWeb/USDOC (accessed
May 9, 2019).
Note: Data reflect shipments under
HTS chapters 1–97. Because of rounding, figures may not add up to totals shown.
N.e.s.o.i. = not elsewhere specified or included.
a
Trade in 2016 reported
under HTS subheading 2202.90.
Table
A.21
U.S. imports for
consumption claiming eligibility under the African Growth and Opportunity Act
(AGOA), by source, 2016–18
Source
2016
2017
2018
% change 2017–18
Thousand $
Nigeria
3,180,715
5,807,749
4,358,822
-24.9
Angola
1,998,268
2,270,554
1,950,021
-14.1
South Africa
1,858,403
1,817,858
1,485,800
-18.3
Chad
775,178
590,244
601,078
1.8
Kenya
390,900
402,448
466,274
15.9
Ghana
29,691
312,397
330,663
5.8
Lesotho
295,793
288,963
319,558
10.6
Congo (ROC)
61,681
79,464
270,059
239.8
Madagascar
93,828
148,012
188,583
27.4
Cote d`Ivoire
120
37,717
177,430
370.4
Ethiopia
61,791
86,606
153,805
77.6
Gabon
60,050
99,913
147,848
48.0
Mauritius
188,079
140,331
143,603
2.3
Cameroon
6,390
393
63,313
16,006.1
Tanzania
36,952
40,544
42,494
4.8
Senegal
86
5,133
32,550
534.1
Malawi
45,085
35,670
30,959
-13.2
Eswatini
a
(b)
(b)
4,083
(c)
Rwanda
1,226
2,177
3,868
77.7
Uganda
288
717
1,197
67.1
Cabo Verde
586
720
844
17.2
Mozambique
1,470
2,845
823
-71.1
Zambia
32
907
806
-11.1
Sierra Leone
523
92
682
638.0
Burkina Faso
17
720
588
-18.4
Benin
15
17
395
2,179.6
Namibia
0
31
338
1,002.6
Djibouti
11
1,304
226
-82.7
Mali
13
20
66
225.4
Guinea
7
32
64
101.5
Liberia
17
0
12
(c)
Togo
20
80
10
-87.2
Gambia
(b)
(b)
4
(c)
Botswana
4,766
991
0
(c)
Mauritania
47,711
54,854
0
(c)
Niger
3
2
0
(c)
Seychelles
34
0
0
(c)
Total U.S. imports for
consumption under AGOA (excluding GSP)
9,139,750
12,229,504
10,776,866
-11.9
Source: USITC DataWeb/USDOC (accessed
May 9, 2019).
Note: Data reflect shipments under
HTS chapters 1–97. Because of rounding, figures may not add up to totals shown.
N.e.s.o.i. = not elsewhere specified or included. Because of rounding, figures
may not add up to totals shown.
a
In 2018, the country’s name was changed from Swaziland to Eswatini.
b
Eswatini and Gambia were not AGOA-eligible in 2016 and 2017.
c
Undefined.
Table
A.22
Leading U.S. imports for
consumption claiming eligibility under the African Growth and Opportunity Act
(AGOA) (excluding GSP), by HTS 6-digit subheading, 2016–18
HTS 6
Description
2016
2017
2018
% change 2017–18
Million $
2709.00
Petroleum oils and oils
from bituminous minerals, crude
5,912
8,879
7,537
-15.1
8703.23
Passenger motor vehicles
with spark-ignition internal combustion reciprocating piston engine, cylinder
capacity over 1,500 cc but not over 3,000 cc
1,493
1,178
535
-54.6
6203.42
Men’s or boys’ trousers,
bib and brace overalls, breeches and shorts of cotton, not knitted or
crocheted
193
201
221
9.6
2710.12
Light oils and
preparations containing 70% by weight petroleum oils or oils from bituminous
minerals, not containing biodiesel, not waste oils
221
263
195
-25.9
6205.20
Men’s or boys’ shirts of
cotton, not knitted or crocheted
143
120
146
21.9
6110.30
Sweaters, pullovers,
sweatshirts, vests and similar articles of manmade fibers, knitted or
crocheted
109
123
139
13.6
0802.62
Macadamia nuts, shelled,
fresh or dried
86
108
139
29.0
2710.19
Petroleum oils, oils from
bituminous minerals (other than crude) & products containing by weight
70% or more of these oils, not biodiesel or waste
18
90
125
39.3
6104.63
Women’s or girls’
trousers, bib and brace overalls, breeches and shorts of synthetic fibers,
knitted or crocheted
92
94
113
20.8
6204.62
Women’s or girls’
trousers, bib and brace overalls, breeches and shorts of cotton, not knitted
or crocheted
98
85
99
17.5
7202.41
Ferrochromium, containing
more than 4% (wt.) carbon
11
27
86
217.9
7202.30
Ferrosilicon manganese
3
32
86
172.6
6105.20
Men’s or boys’ shirts of
manmade fibers, knitted or crocheted
78
77
81
5.3
7606.12
Aluminum alloy rectangular
(including square) plates, sheets and strip, over 0.2 mm thick
23
93
72
-22.8
7202.11
Ferromanganese, containing
more than 2% (wt.) carbon
33
85
61
-28.4
Total of items shown
8,513
11,454
9,635
-15.9
All other HTS provisions
627
776
1,142
47.2
Total U.S. imports for consumption
under AGOA
9,140
12,230
10,777
-11.9
Source: USITC DataWeb/USDOC (accessed
May 9, 2019).
Note: Data reflect shipments under
HTS chapters 1–97. Because of rounding, figures may not add up to totals shown.
N.e.s.o.i. = not elsewhere specified or included.
a
Undefined.
Table
A.23
U.S. imports for
consumption claiming eligibility under the
Caribbean
Basin Economic Recovery Act
(CBERA), by source, 2016–18
Source
2016
2017
2018
% change
2017–18
Thousand $
Haiti
857,223
879,004
957,401
8.9
Trinidad & Tobago
379,017
487,831
550,251
12.8
Jamaica
74,571
72,749
83,875
15.3
Bahamas
68,403
79,744
66,181
-17.0
Belize
17,136
12,398
10,676
-13.9
Barbados
2,321
3,558
7,453
109.5
St. Kitts-Nevis
7,158
5,123
5,095
-0.5
Grenada
1,809
2,405
2,912
21.1
Guyana
1,551
732
880
20.2
St. Lucia
627
342
373
8.9
Curaçao
85
124
119
-4.5
Dominica
22
48
36
-25.9
British Virgin Islands
9
0
22
(a)
St. Vincent & the
Grenadines
45
102
22
-78.4
Antigua Barbuda
37
161
19
-88.2
Aruba
15
36
16
-55.0
Total U.S. imports for
consumption under CBERA
1,410,031
1,544,358
1,685,330
9.1
Source: USITC DataWeb/USDOC (accessed
May 9, 2019).
Note: Because of rounding, figures
may not add up to totals shown. The data for U.S. imports under CBERA include
U.S. imports under CBERA as amended by both Caribbean Basin Trade Partnership
Act (CBTPA) and the Haitian Hemispheric Opportunity through Partnership
Encouragement (HOPE) and Haiti Economic Lift Program (HELP) Acts. In previous
Year
in Trade
reports, trade data under the
HOPE and
HELP Acts
were only reported and analyzed separately in the Haiti Initiatives section.
Thus, numbers from the previous report are not comparable to the numbers in the
table above
a
Undefined.
Table
A.24
Leading U.S. imports for
consumption under
Caribbean Basin Economic Recovery
Act
(CBERA), by HTS provision, 2016–18
HTS 6
Description
2016
2017
2018
% change 2017–18
Thousand $
2905.11
Methanol (methyl alcohol)
253,213
378,273
447,733
18.4
6109.10
T-shirts, singlets, tank
tops and similar garments of cotton, knitted or crocheted
301,987
258,647
284,494
10.0
6110.30
Sweaters, pullovers,
sweatshirts, vests and similar articles of manmade fibers, knitted or
crocheted
80,814
125,672
141,762
12.8
6110.20
Sweaters, pullovers,
sweatshirts, vests and similar articles of cotton, knitted or crocheted
128,311
110,440
112,035
1.4
6109.90
T-shirts, singlets, tank
tops and similar garments, of textile materials n.e.s.o.i., knitted or
crocheted
54,302
82,341
106,166
28.9
3903.11
Polystyrene, expandable,
in primary forms
66,625
78,149
64,394
-17.6
6104.62
Women’s or girls’
trousers, bib and brace overalls, breeches and shorts of cotton, knitted or
crocheted
40,782
39,791
59,931
50.6
6203.43
Men’s or boys’ trousers,
bib and brace overalls, breeches and shorts of synthetic fibers, not knitted
or crocheted
36,035
33,968
49,374
45.4
2709.00
Petroleum oils and oils
from bituminous minerals, crude
86,200
53,648
34,030
-36.6
6205.30
Men’s or boys’ shirts of
manmade fibers, not knitted or crocheted
22,431
20,637
31,341
51.9
6203.42
Men’s or boys’ trousers,
bib and brace overalls, breeches and shorts of cotton, not knitted or
crocheted
59,786
56,276
26,881
-52.2
0714.30
Yams, fresh, chilled,
frozen or dried
21,119
23,281
24,401
4.8
2710.19
Petroleum oils, oils from
bituminous minerals (other than crude) & products containing by weight
70% or more of these oils, not biodiesel or waste
298
12,262
21,483
75.2
6104.63
Women’s or girls’
trousers, bib and brace overalls, breeches and shorts of synthetic fibers,
knitted or crocheted
24,761
20,877
19,578
-6.2
2933.61
Melamine
12,257
16,512
19,497
18.1
Total of items shown
1,188,921
1,310,773
1,443,099
10.1
All other HTS provisions
221,110
233,585
242,231
3.7
Total U.S. imports for
consumption under CBERA
1,410,031
1,544,358
1,685,330
9.1
Source: USITC DataWeb/USDOC (accessed
May 9, 2019).
Note: Because of rounding, figures may
not add up to totals shown.
Table
A.25
WTO dispute settlement
cases to which the United States was a party, developments in 2018
Case no.
Title
Complainant
Action
(month/day/year)
DS217
United States—Continued
Dumping and Subsidy Offset Act of 2000 (CDSOA or Byrd Amendment)
Australia, Brazil, Chile,
European Communities (EC), India, Indonesia, Japan, South Korea, Thailand
Complaining parties
request consultations (12/21/00).
Panel is established
(08/23/01) and composed (10/25/01).
Panel report is circulated
(09/16/02).
U.S. notifies Dispute
Settlement Body (DSB) it will appeal panel decision (10/18/02).
Appellate Body report is
circulated (01/16/03).
Brazil, Chile, the EC,
India, Japan, South Korea, Canada, and Mexico request DSB authorization to
suspend concessions (01/15/04); U.S. objects and DSB refers the matter
arbitration (01/24/04).
Arbitrator circulates
decisions and rejects position of Brazil, Canada, Chile, the EC, India,
Japan, South Korea, and Mexico, and finds it appropriate to rely on the
economic effect of the measure (08/31/04).
Authority to retaliate
granted (11/26/04, 12/17/04).
DSB authorizes or takes
note of various requests or agreements to suspend concessions (2004–05).
U.S. states at DSB meeting
that recent changes bring U.S. law into conformity with its WTO obligations
(02/17/06).
Japan (2006-2013) and EC
(2006-2018) notify DSB annually of the new list of products on which the
additional import duty would be imposed further to the authorized suspension
of concessions.
Japan notifies DSB that,
because the level of authorization was marginal, no suspension of concessions
would be applied for the 10th year starting September 1, 2014 (08/18/14) and
similarly notifies the same for 2015, 2016, and 2017.
EU notifies DSB that it
will maintain unchanged the list of products subject to retaliation and will
decrease the duty on products from 4.3 percent to 0.3 percent (05/07/18).
Japan notifies DSB it will
continue its non-application of retaliatory measures for the coming year
(11/09/18).
DS316
European
Communities—Measures Affecting Trade in Large Civil Aircraft
United States
U.S. requests
consultations with EC (10/06/04).
Panel is established
(07/20/05) and composed (10/17/05).
Panel report is circulated
(06/30/10).
European Union (EU)
notifies DSB it will appeal decision to Appellate Body (07/21/10); U.S. does
the same (08/19/10).
Appellate Body report is
circulated (05/18/11).
DSB adopts Appellate Body
and panel reports (06/01/11).
EU informs DSB it intends
to implement DSB recommendation (06/17/11).
EU informs DSB it has
taken steps to bring its measures into conformity with obligations
(12/01/11).
U.S. requests
consultations with EU under Article 21.5 and requests authority to take
countermeasures (12/09/11).
EU objects to requested
level of U.S. measures and requests matter be referred to arbitration under
Article 22.6; DSB refers to arbitration (12/22/11).
U.S. and EU request
arbitrator to suspend work (01/19/12). Arbitrator suspends work until either
party requests resumption (01/20/12).
U.S. requests
establishment of an Article 21.5 compliance panel (03/30/12); panel
established (04/13/12).
Compliance panel issues
report, finding that the EU has largely failed to comply (09/22/16).
EU notifies the Appellate
Body of its decision to appeal certain issues of law and interpretation in
the panel report (10/13/16).
U.S. notifies the
Appellate Body it will appeal certain issues of law and interpretation in the
panel report (11/10/16).
Appellate Body circulates
its report to members, largely upholding the panel report (05/18/18).
Appellate Body issues its
report. Report (1) confirms EU and certain EU member states failed to comply
with earlier WTO determination finding launch aid inconsistent with WTO
obligations; (2) confirms almost $5 billion in new launch aid for A350 XWB
was WTO-inconsistent; (3) finds WTO-inconsistent subsidies continue to cause
significant lost sales of Boeing aircraft; and (4) finds, due to passage of
time, EU no longer needed to take action on some earlier (pre-A380) launch aid
subsidies previously found WTO-inconsistent (05/15/18).
At request of the United
States, the arbitration regarding the level of countermeasures was resumed
(07/13/18); an arbitral decision is expected in 2019.
EU informs DSB it has
taken new steps to achieve compliance (05/17/18). After consultations, the
United States disagrees compliance achieved. At request of EU, the WTO
establishes second compliance panel, with decision not expected before end of
2019 (08/27/18).
DS353
United States—Measures Affecting
Trade in Large Civil Aircraft—Second Complaint
European Communities
EC requests consultations
(06/27/05).
Panel is established
(02/17/06) and composed (11/22/06).
Panel chairman informs DSB
multiple times that panel needs additional time to complete work in light of
complexities of the dispute (05/18/07, 07/11/08, 12/16/09, 07/07/10).
Panel report is circulated
(03/31/11).
EU notifies DSB that it
will appeal the decision to the Appellate Body (04/01/11); U.S. also notifies
its decision to appeal (04/28/11).
Appellate Body report is
circulated (03/12/12); DSB adopts Appellate Body and panel reports
(03/23/12).
U.S. informs DSB it
intends to implement DSB recommendations and rulings (04/13/12).
EU and U.S. inform DSB of
agreed procedures under Articles 21 and 22 of DSU and Article 7 of Agreement
on Subsidies and Countervailing Measures (SCM Agreement) (04/24/12).
U.S. notifies DSB of
withdrawal of subsidies and removal of adverse effects in this dispute, and
that it fully complies with DSB recommendations and rulings (09/23/12).
Compliance proceedings: EU
requests consultations under Article 21.5 (09/25/12), and then requests
establishment of a compliance panel (10/11/12). A compliance panel is
established and composed (10/30/12). The panel chair subsequently informs the
DSB several times of delays in circulating its report due to scale and
complexity of the dispute.
Compliance report
circulates to members, upholding certain EU claims and rejecting others
(06/09/17).
EU notifies DSB of its
decision to appeal certain issues of law and legal interpretations
(06/29/17); and the U.S. notifies the DSB of its decision to cross-appeal
(08/10/17). A report is expected in 2019.
Countermeasures
: EU requests authority to take countermeasures
under Article 22 of the DSU (remedies) and Articles 4, 10, and 7.9 of the SCM
Agreement (09/27/12).
U.S. objects to the level
of suspension of concessions and other obligations, and refers the matter to
arbitration under Article 22.6 of the DSU (10/22/12). At the DSB meeting the
two parties agree to refer the matter to arbitration (10/23/10).
U.S. and EU later ask the
arbitrator to suspend arbitration proceedings (11/27/12), and the arbitrator
suspends proceedings (11/28/12).
DS381
United States—Measures
Concerning the Importation, Marketing and Sale of Tuna and Tuna Products
Mexico
Mexico requests
consultations with U.S. (10/24/08).
Panel is established
(04/20/09) and composed (12/14/09).
Panel chairman informs DSB
that the panel expects to issue report in February 2011 (06/15/10).
Parties agree on new panel
member following death of one member (08/12/10).
Panel report is circulated
(09/15/11).
U.S. notifies DSB of its
decision to appeal the panel’s decision (01/20/12); Mexico does the same
(01/25/12).
Appellate Body report is
circulated (05/16/12); DSB adopts the Appellate Body and panel reports
(06/13/12).
U.S. states that it
intends to implement DSB recommendations and rulings (06/25/12), and U.S. and
Mexico inform DSB that they have agreed that a reasonable period of time to
do so is by July 13, 2013 (09/17/12).
U.S. advises DSB that it
has made effective a final rule amending dolphin-safe labeling requirements
for tuna and tuna products, bringing its requirements into compliance
(07/23/13).
Mexico and U.S. inform DSB
of agreed procedures under Articles 21 and 22 of the DSU (08/02/13).
Compliance proceedings.
Mexico requests establishment of a compliance panel (11/14/13); DSB agrees to
refer to the original panel (01/22/14); panel is composed (01/27/14).
Compliance panel report
circulated to members (04/14/15).
U.S. notifies DSB of its
decision to appeal certain issues of law covered in the compliance panel
report (06/05/15); Mexico files an appeal in the same dispute (06/10/15).
Appellate Body report is
circulated to members (11/20/15).
DSB adopts Article 21.5
Appellate Body reports and panel reports, as modified by Appellate Body
reports (12/03/15).Mexico requests Article 22.2 authorization to suspend
concessions (03/10/16).
U.S. requests Article 22.6
arbitration of Mexico’s request to suspend concessions (03/22/16) and
requests establishment of an Article 21.5 panel to resolve disagreement over
U.S. compliance measures (04/11/16). Panels established and composed
(04/22/16, 05/27/16).
Mexico requests Article
21.5 (second recourse) consultations with U.S. (05/13/16); consultations held
(06/02/16).
Mexico requests
establishment of an Article 21.5 compliance panel to resolve disagreement
over the U.S. final rule as amended in 2016 (06/09/16).
Compliance panel composed
(07/11/16).
Compliance panel report
circulated to members; panel finds U.S. measures consistent with Article 2.1
of TBT Agreement and justified under Article XX of GATT 1994 (10/26/17).
Mexico notifies DSB of
decision to appeal certain issues of law and legal interpretation in the
compliance panel report (12/01/17).
Appellate Body report
circulated, upholding panel’s legal and factual analysis that Mexico
appealed, including findings that dolphin safe labeling measure was not
inconsistent with Article 2.1 of the TBT Agreement and was justified under
Article XX of the GATT 1994 (12/14/18).
DS427
China—Anti-dumping and
Countervailing Duty Measures on Broiler Products from the United States
United States
U.S. requests
consultations (09/20/11).
Panel established (01/20/12)
and composed (05/24/12).
Panel report circulated
(08/02/13) and is adopted by DSB (09/25/13).
China informs DSB it
intends to implement DSB recommendations and rulings (10/22/13).
China and U.S. inform DSB
that they have agreed that a reasonable period of time to implement is by
July 9, 2014 (12/19/13).
China informs DSB that it
has fully implemented DSB recommendations and rulings, but U.S. disagrees
that China has fully complied (07/22/14).
China and U.S. inform DSB
of agreed procedures under Articles 21 and 22 of the DSU (07/15/14).
U.S. requests Article 21.5
consultations for China’s failure to comply with DSB recommendations
(05/10/16).
U.S. requests
establishment of a compliance panel (05/27/16); and panel composed
((07/18/16).
Compliance report
circulated; panel upheld most of U.S. claims in its report (01/18/18).
DSB adopts compliance
panel report (02/28/18). China agreed to remove the antidumping and
countervailing duties that were subject to the dispute.
DS430
India—Measures Concerning
the Importation of Certain Agricultural Products from the United States
United States
U.S. requests
consultations (03/06/12).
Panel is established
(06/25/12).
Director-General composes
a panel (02/18/13).
Panel report is circulated
(10/14/14).
India, after receiving an
extension, notifies DSB it will appeal the decision to the Appellate Body
(01/26/15).
Appellate Body issues its
report (06/04/15).
DSB adopts the Appellate
Body report and the panel report, as modified by the Appellate Body report
(06/19/15).
India informs DSB it
intends to implement DSB’s recommendations and rulings and will need a
reasonable period of time to do so (07/13/15).
India and U.S. inform DSB
that they have agreed that the reasonable period of time is 12 months,
expiring on June 19, 2016 (12/08/15).
U.S. requests
authorization to suspend concessions for India’s failure to comply with
recommendations and rulings of DSB (07/07/16).
India objects to level of
suspension of concessions/ obligations, requests Article 22.6 arbitration,
and informs DSB it has adopted necessary measures to comply with DSB
recommendations and rulings (07/18/16 and 09/22/16).
India informs DSB of
subsequent amendments to its measures to comply with DSB’s rulings and
recommendations (03/02/17).
India requests establishment
of a compliance panel (04/06/17) and DSB agrees (05/22/17).
Compliance panel chair
informs DSB that it expects to issue its final report by the end of May 2018
(11/23/17).
Compliance panel chair
informs DSB that it expects to issue its report by the end of September 2019
(05/22/19).
DS436
United
States—Countervailing Measures on Certain Hot-Rolled Carbon Steel Flat
Products from India
India
India requests
consultations (04/12/12).
Panel is established
(08/31/12).
Director-General composes
the panel (02/18/13).
Panel report is circulated
(07/14/14).
India notifies DSB that it
will appeal certain issues of law and legal interpretation in the panel
report (08/08/14).
U.S. files an appeal
(08/13/14).
Appellate Body circulates
its report (12/08/14).
DSB adopts the Appellate
Body report and panel report as modified (12/19/14).
U.S. informs DSB that it
intends to implement DSB’s recommendations and rulings and will need a
reasonable period of time to do so (01/16/15).
India and U.S. inform DSB
that they agree that a reasonable period of time is 15 months, expiring on
March 19, 2016 (03/24/15).
India and U.S. inform DSB
they have agreed to modify the reasonable period of time, to expire April 18,
2016 (03/09/16).
U.S. informs DSB that
USITC and USDOC have issued new final determinations making findings
consistent with DSB recommendations and rulings (04/22/16).
India and U.S. inform DSB
of agreed procedures under DSU Articles 21 and 22 (05/06/16).
India requests
consultations with U.S. concerning U.S. compliance measures (06/05/17).
India requests
establishment of a compliance panel (03/29/18). Chair informs DSB that the
panel expects to issue its final report during 2019 (08/30/18).
DS437
United
States—Countervailing Duty Measures on Certain Products from China
China
China requests
consultations (05/25/12).
Panel is established
(09/28/12).
Director-General composes
the panel (11/26/12).
Panel report is circulated
(07/14/14).
China appeals the panel
decision to the Appellate Body (08/22/14).
U.S. files a cross-appeal
of a preliminary determination by the panel (08/27/14).
Appellate Body issues its
report (12/18/14).
DSB adopts Appellate Body
and panel reports (01/16/15).
U.S. informs DSB that it
intends to implement DSB’s recommendations and rulings and that it will need
a reasonable period of time to do so (02/13/15).
China requests that the
reasonable period of time be determined through binding arbitration pursuant
to Article 21.3(c) of the DSU (06/26/15).
An arbitrator determines
that the reasonable period of time expires on April 1, 2016 (10/09/15).
China and U.S. inform DSB
of agreed procedures under Articles 21 and 22 of the DSU (04/15/16).
China requests DSU Article
21.5 consultations (05/13/16) and subsequently establishment of a compliance
panel (07/08/16).
A compliance panel is
established (07/21/16) and composed (10/05/16).
Compliance panel report is
circulated (03/21/18).
U.S. notifies DSB it will
appeal to the Appellate Body certain issues of law and legal interpretations
in the compliance panel report (04/27/18).
Citing a backlog of
appeals, the Appellate Body informed the DSB that it could not provide a date
for a hearing on the appeal (06/28/18).
DS456
India—Certain Measures
Relating to Solar Cells and Solar Modules
United States
U.S. requests
consultations (02/06/13); U.S. requests supplementary consultations
(02/10/14).
Panel is established
(05/23/14).
Parties agree on
composition of panel (09/24/14).
Panel report is circulated
to members (02/24/16).
India notifies DSB of its
decision to appeal to the Appellate Body certain issues of law and legal
interpretation in the panel report (04/20/16).
Appellate Body report
circulated (09/16/16).
DSB adopts the panel and
Appellate Body reports (10/26/16).
India informs DSB it
intends to implement DSB’s recommendations and rulings (11/08/16).
U.S. and India inform DSB
they have agreed that a reasonable time to implement would be 14 months,
expiring on Dec. 14, 2017 (06/16/17).
India informs DSB it has
ceased to apply measures found to be inconsistent (12/14/17).
U.S. requests
authorization from DSB to suspend concessions/obligations on grounds India
has failed to comply within a reasonable time (12/19/17).
India objects and
disagrees it has failed to comply (01/02/18).
Matter is referred to
arbitration (01/12/18).
India requests the
establishment of a compliance panel (01/23/18). The DSB refers the matter to
the original panel (02/28/18).
DS464
United States—Anti-dumping
and Countervailing Measures on Large Residential Washers from Korea
Republic of Korea
Korea requests
consultations (08/29/13).
Panel is established
(01/22/14).
Director-General composes
the panel (06/20/14).
Panel report is circulated
to members (03/11/16).
U.S. notifies DSB of its
decision to appeal to the Appellate Body certain issues of law and legal
interpretation in the panel report (04/19/16).
Appellate Body report is
circulated (09/07/16).
DSB adopts Appellate Body
and panel reports (09/26/16).
U.S. states that it
intends to implement the DSB’s recommendations and rulings and will need a
reasonable period of time (10/26/16).
Korea requests
authorization of the DSB to suspend concessions or other obligations pursuant
to Article 22.2 of the DSU because the United States has not complied with
the DSB’s recommendations and rulings within the reason-able time (01/11/18).
The United States objects (01/19/18). The DSB refers the matter to
arbitration (01/22/18).
The arbitrator circulates
decision to members and sets a dollar amount on the level of suspension of
concessions or other obligations (02/08/19).
DS471
United States—Certain
Methodologies and Their Application to Anti-dumping Proceedings Involving
China
China
China requests
consultations (12/3/13).
Panel is established
(03/26/14).
Director-General composes
the panel (08/28/14).
Panel report is circulated
(10/19/16).
China notifies DSB it will
appeal certain issues of law and legal interpretation in the panel report
(11/18/16).
Appellate Body report is
circulated and upholds in part and reverses in part certain panel findings
regarding U.S. Department of Commerce antidumping methodologies (05/11/17).
U.S. states that it
intends to implement the DSB’s recommendations and rulings and will need a
reasonable period of time (06/19/17).
China requests that
reasonable period of time be determined through arbitration (10/17/17).
Arbitrator determines that
the reasonable period of time is 15 months, expiring on Aug. 22, 2018
(01/19/18).
China requests
authorization to suspend concessions or other obligations pursuant to Article
22.2 of the DSU (09/09/18). The United States objects to China’s proposed
level (09/19/18).
DS478
Indonesia—Importation of
Horticultural Products, Animals and Animal Products
United States
U.S. requests
consultations (05/08/14).
Single panel established
to consider this dispute and DS477 brought by New Zealand (05/20/15).
Director-General composes
the panel (10/08/15).
Panel report is circulated
(12/22/16).
Indonesia notifies DSB it
will appeal certain issues of law and legal interpretation in the panel
report (02/17/17).
Appellate Body report is
circulated and upholds panel findings that 18 import measures imposed by
Indonesia are inconsistent with Indonesia’s obligations (11/09/17).
DSB adopts Appellate Body
report and panel report as modified by Appellate Body (11/22/17).
Arbitrator determines that
the reasonable period of time for Indonesia to comply expires July 22, 2018.
United States requests authorization to suspend concessions of other
obligation pursuant to Article 22.2 of the DSU (08/02/18).
Indonesia objects to U.S.
proposed suspension level (08/14/18).
DS487
United States—Conditional
Tax Incentives for Large Civil Aircraft
European Union
EU requests consultations
(12/19/14).
EU requests establishment
of a panel (02/12/15); panel established (02/23/15); panel composed
(04/13/15).
Panel circulates its
report (11/28/16).
U.S. notifies DSB of its
decision to appeal certain issues of law and legal interpretation in the
panel report (12/16/16).
EU notifies DSB it will
cross-appeal (01/17/17).
Appellate Body circulates
its report, affirming the panel’s rejection of six of seven EU claims
alleging that certain Washington State tax incentives were inconsistent with
U.S. obligations and reversing the panel finding of U.S. inconsistency on the
seventh claim (09/04/17).
DSB adopts Appellate Body
report and panel report as modified by the Appellate Body (09/22/17).
DS488
United States—Anti-dumping
Measures on Certain Oil Country Tubular Goods from South Korea
Korea
South Korea requests
consultations (12/22/14).
DSB establishes a panel
(03/25/15).
Parties agree on
composition of panel (07/13/15).
Panel circulates its
report; panel finds the U.S. acted inconsistently with its obligations in
several respects and rejects other claims of South Korea (11/14/17).
The DSB adopts the panel
report (01/12/18).
U.S. and South Korea agree
that a reasonable time for U.S. to implement the panel’s recommendations and
rulings is by January 19, 2019 (01/12/18).
Korea and the United
States inform the DSB they have agreed to modify the reasonable period of
time for implementation to July 12, 2019 (01/11/19).
DS491
United States—Anti-dumping
Measures and Countervailing Measures on Certain Coated Paper from Indonesia
Indonesia
Indonesia requests
consultations (03/13/15).
DSB establishes a panel
(09/28/15).
Director-General composes
the panel (02/04/16).
Panel report rejecting all
of Indonesia’s claims is circulated to members (12/06/17).
DSB adopts the panel
report (01/12/18).
DS503
United States—Measures
Concerning Non-Immigrant Visas
India
India requests
consultations (03/03/16).
Consultations held in
Geneva (05-11/16).
DS505
United
States—Countervailing Measures on Supercalendered Paper from Canada
Canada
Canada requests
consultations (03/30/16).
DSB establishes a panel
(07/21/16).
Director-General composes
the panel (08/31/16).
Panel circulates its
report (07/05/18).
The United States informs
the DSB it will appeal certain issues of law and legal interpretations in the
panel report (08/27/18).
Appellate body informs the
DSB that, due to the size of the record, complexity of issues, and backlog of
appeals it would communicate a hearing date at a later time (10/24/18).
DS508
China—Export Duties on
Certain Raw Materials
United States
U.S. requests
consultations (07/13/16).
DSB establishes a panel
(11/08/16).
DS510
U.S.—Certain Measures
Relating to the Renewable Energy Sector
India
India requests
consultations (09/09/16).
DSB establishes a panel
(03/21/17).
Director-General composes
the panel (04/24/18).
Panel circulates its
report (06/27/19).
DS511
China—Domestic Support for
Agricultural Producers
United States
U.S. requests
consultations (09/13/16).
DSB establishes a panel
(01/25/17).
Parties agree on panel
composition (06/24/17).
Panel circulates its
report (02/28/19).
DSB adopts the panel
report (04/26/19).
China informs the DSB it
intends to implement the rulings and recommendations (05/16/19).
United States and China
inform the DSB they have agreed that a reasonable time for China to implement
will expire March 31, 2020 (06/10/19).
DS514
United
States—Countervailing Measures on Cold- and Hot-Rolled Steel Flat Products
from Brazil
Brazil
Brazil requests
consultations (11/11/16).
DS515
United States—Measures
Related to Price Comparison Methodologies
China
China requests
consultations (12/12/16).
DS517
China—Tariff Rate Quotas
for Certain Agricultural Products
United States
U.S. requests
consultations (12/15/16).
DSB establishes a panel
(09/22/17).
Director-General composes
the panel (02/12/18).
Panel circulates its
report to members (04/18/19).
DSB adopts panel report
(05/28/19).
DS519
China—Subsidies to
Producers of Primary Aluminum
United States
U.S. requests
consultations (01/12/17).
DS520
Canada—Measures Governing
the Sale of Wine in Grocery Stores
United States
U.S. requests
consultations (01/18/17).
DS523
United
States—Countervailing Measures on Certain Pipe and Tube Products (Turkey)
Turkey
Turkey requests
consultations (03/08/17).
DSB establishes a panel
(06/19/17).
Director-General composes
the panel (09/14/17).
Panel circulates its
report to member (12/18/18).
United States notifies the
DSB that it will appeal certain issues of law and legal interpretations to
the Appellate Body (01/25/19).
Turkey notifies the DSB of
its decision to cross-appeal (01/30/19).
DS531
Canada—Measures Governing
the Sale of Wine in Grocery Stores (second complaint)
United States
U.S. requests
consultations (09/28/17).
DSB establishes a panel
(07/20/18).
DS533
United
States—Countervailing Measures on Softwood Lumber from Canada
Canada
Canada requests
consultations (11/28/17).
DSB establishes a panel
(04/09/18).
Director-General composes
the panel (07/06/18).
DS534
United States—Anti-Dumping
Measures Applying Differential Pricing Methodology to Softwood Lumber from Canada
Canada
Canada requests
consultations (11/28/17).
DSB establishes a panel
(04/09/18).
Director-General composes
the panel (05/22/18).
The panel circulates its
report to members (04/09/19).
Canada notifies the DSB it
will appeal certain issues of law and legal interpretations in the panel
report to the Appellate Body (06/04/19).
DS535
United States—Certain
Systemic Trade Remedies Measures
Canada
Canada requests
consultations (12/20/17).
DS536
United States—Anti-Dumping
Measures on Fish Fillets from Viet Nam
Viet Nam
Viet Nam requests
consultations (01/08/18).
DSB establishes a panel
(07/20/18).
Director-General composes
the panel (11/30/18).
DS539
United States—Anti-Dumping
and Countervailing Duties on Certain Products and the Use of Facts Available
Korea
Korea requests
consultations (02/14/18).
DSB establishes a panel
(05/28/18).
Director-General composes
the panel (12/05/18).
DS540
United States—Certain
Measures Concerning Pangasius Seafood Products from Viet Nam
Viet Nam
Vietnam requests
consultations (02/22/18)
DS541
India—Export Related
Measures
United States
United States requests
consultations (03/14/18).
DSB establishes a panel
(05/28/18).
Director-General composes
the panel (07/23/18).
DS542
China—Certain Measures
Concerning the Protection of Intellectual Property Rights
United States
United States requests
consultations (01/08/18).
DSB establishes a panel
(11/21/18).
Director-General composes
the panel (01/16/19).
DS543
United States—Tariff
Measures on Certain Goods from China
China
China requests
consultations (04/04/18).
DSB establishes a panel
(01/28/19).
Director-General composes
the panel (06/03/19).
DS544
United States—Certain
Measures on Steel and Aluminum Products
China
China requests
consultations (01/08/18).
DSB establishes a panel
(11/21/18).
Director-General composes
the panel (01/25/19).
DS545
United States—Safeguard
Measure on Imports of Crystalline Silicon Photovoltaic Products
Korea
Korea requests
consultations (05/14/18)
DSB establishes a panel
(09/26/18).
DS546
United States—Safeguard
Measure on Imports of Large Residential Washers
Korea
Korea requests
consultations (05/14/18)
DSB establishes a panel
(09/26/18).
DS547
United States—Certain
Measures on Steel and Aluminum Products
India
India requests consultations
(05/18/18).
DSB establishes a panel
(12/04/18).
Director-General composes
the panel (01/25/19).
DS548
United States—Certain
Measures on Steel and Aluminum Products
European Union
European Union requests
consultations (06/01/18).
DSB establishes a panel
(11/21/18).
Director-General composes
the panel (01/25/19).
DS550
United States—Certain
Measures on Steel and Aluminum Products
Canada
Canada requests
consultations (06/01/18).
DSB establishes a panel
(11/21/18).
Director-General composes
the panel (01/25/19).
Withdrawn, mutually agreed
solution (05/23/19).
DS551
United States—Certain
Measures on Steel and Aluminum Products
Mexico
Mexico requests
consultations (01/08/18).
DSB establishes a panel
(11/21/18).
Director-General composes
the panel (01/25/19).
Withdrawn, mutually agreed
solution (05/28/19).
DS552
United States—Certain
Measures on Steel and Aluminum Products
Norway
Norway requests
consultations (06/13/18).
DSB establishes a panel
(11/21/18).
Director-General composes
the panel (01/25/19).
DS554
United States—Certain
Measures on Steel and Aluminum Products
Russian Federation
Russian Federation
requests consultations (06/29/18).
DSB establishes a panel
(11/21/18).
Director-General composes
the panel (01/25/19).
DS556
United States—Certain
Measures on Steel and Aluminum Products
Switzerland
Switzerland requests
consultations (07/09/18).
DSB establishes a panel
(12/04/18).
Director-General composes
the panel (01/25/19).
DS557
Canada—Additional Duties
on Certain Products from the United States
United States
United States requests
consultations (07/16/18).
DSB establishes a panel
(11/21/18).
Director-General composes
the panel (01/25/19).
Withdrawn, mutually agreed
solution (05/23/19).
DS558
China—Additional Duties on
Certain Products from the United States
United States
United States requests
consultations (07/16/18).
DSB establishes a panel
(11/21/18).
Director-General composes
the panel (01/25/19).
DS559
European Union—Additional
Duties on Certain Products from the United States
United States
United States requests
consultations (07/16/18).
DSB establishes a panel
(11/21/18).
Director-General composes
the panel (01/25/19).
DS560
Mexico—Additional Duties
on Certain Products from the United States
United States
United States requests
consultations (07/16/18).
DSB establishes a panel
(11/21/18).
Director-General composes
the panel (01/25/19).
Withdrawn, mutually agreed
solution (05/28/19).
DS561
Turkey—Additional Duties
on Certain Products from the United States
United States
United States requests
consultations (07/16/18).
DSB establishes a panel
(01/28/19).
Director-General composes
the panel (02/28/19).
DS562
United States—Safeguard
Measures on Imports of Crystalline Silicon Photovoltaic Products
China
China requests
consultations (08/14/18).
DS563
United States—Certain
Measures Related to Renewable Energy
China
China requests
consultations (08/14/18).
DS564
United States—Certain
Measures on Steel and Aluminum Products
Turkey
Turkey requests
consultations (08/15/18).
DSB establishes a panel
(11/21/18).
Director-General composes
the panel (01/25/19).
DS565
United States—Tariff
Measures on Certain Goods from China II
China
China requests
consultations (08/23/18).
DS566
Russian
Federation—Additional Duties on Certain Products from the United States
United States
United States requests
consultations (08/27/18).
DSB establishes a panel
(12/18/18).
Director-General composes
the panel (01/25/19).
DS574
United States—Measures
Relating to Trade in Goods and Services
Table
A.26
NAFTA Chapter 19
substantive challenges to original and five-year review determinations of USITC
and USDOC, developments in 2018
Panel review no.
Dispute
Action
(month/day/year)
MEX-USA-2015-1904-01
Ammonium sulfate from U.S.
and China (AD) (Investigating authority: Secretaría de Economía)
Request for panel review
(11/06/15). Oral argument hearing date (06/25/18). Status: Active.
USA-CDA-2015-1904-01
Supercalendered Paper from
Canada (CVD) (Investigating authority: International Trade Administration)
Request for panel review
(11/18/15). Oral argument hearing date (10/25/16); Decision date
(04/13/2017). Decision: On 04/13/17, the Panel unanimously affirmed in part
and remanded in part the Investigating Authority’s Determination. On
06/05/18, the Panel granted the Consent Motion to Stay Proceedings until
07/27/18. Panel review was terminated on 07/24/2018 by joint consent of
participants. Status: Terminated.
MEX-USA-2016-1904-01
Ethylene Glycol Monobutyl
Ether from U.S. (AD) (Investigating authority: Secretaría de Economía)
Request for panel review
(06/24/16). Decision: panel review was terminated on 04/20/2018 by joint
consent of participants. Status: Terminated.
USA-MEX-2017-1904-01
Certain Circular Welded
Non-Alloy Steel Pipe from Mexico (AR) (Investigating authority: International
Trade Administration)
Request for panel review
(07/12/17). Decision: panel review was terminated on 10/11/2018 by joint
consent of participants. Status: Terminated.
USA-CDA-2017-1904-02
Certain softwood lumber
products from Canada (CVD) (Investigating authority: International Trade
Administration)
Request for panel review
(11/14/17). Status: Active.
USA-CDA-2017-1904-03
Certain softwood lumber
products from Canada (AD) (Investigating authority: International Trade
Administration)
Request for panel review
(12/05/17). Status: Active.
USA-CDA-2018-1904-01
100- to 150-Seat Large
Civil Aircraft from Canada (CVD) (Investigating authority: International
Trade Administration)
Request for panel review
(01/19/18). Decision: panel review was terminated on 05/07/18 by joint
consent of the participants. Status: Terminated.
USA-CDA-2018-1904-02
100- to 150-Seat Large
Civil Aircraft from Canada (AD) (Investigating authority: International Trade
Administration)
Request for panel review
(01/19/18). Decision: panel review was terminated on 05/02/2018 by joint
consent of the participants. Status: Terminated.
USA-CDA-2018-1904-03
Supercalendered paper from
Canada (INJ) (Investigating authority: International Trade Commission)
Request for panel review
(01/19/18). Oral argument hearing date (05/07/19). Status: Active.
USA-MEX-2018-1904-04
Large Residential Washers
from Mexico (AR) (Investigating authority: International Trade
Administration)
Request for panel review
(04/18/18). Status: Active.
USA-CDA-2018-1904-05
Certain Uncoated
Groundwood Paper From Canada (AD) (Investigating authority: International
Trade Administration)
Request for panel review
(09/07/18).
Decision: the NAFTA
Secretariat received submissions from all participants requesting termination
of proceedings. Proceedings terminated on 11/30/18. Status: Terminated.
USA-CDA-2018-1904-06
Certain Uncoated
Groundwood Paper From Canada (CVD) (Investigating Authority: International
Trade Administration)
Request for panel review
(09/10/18). Decision: the NAFTA Secretariat received submissions from all
participants requesting termination of proceedings. Proceedings terminated
on 11/30/18. Status: Terminated
USA-CDA-2018-1904-07
Uncoated Groundwood Paper
From Canada (INJ) (Investigating authority: International Trade Commission)
Request for panel review
(10/26/18). Decision: proceedings terminated on 11/30/18 by operation of Rule
71.3 of the
NAFTA Rules of Procedure for Article 1904 Binational Panel
Reviews
. Status: Terminated.
Note: This list includes active cases
during 2018, including those in which little if any formal action occurred
during 2017. AD means “antidumping duty,” CVD means “countervailing duty,” and
AR means “administrative review.”
Table
A.27
U.S. total exports to the
EU, by USITC digest sector, 2016–18
Sector
Description
2016
2017
2018
% change 2017–18
Million $
1
Agricultural products
13,344
13,450
15,590
15.9
2
Forest products
5,073
5,170
5,482
6.0
3
Chemicals and related
products
60,657
59,536
63,137
6.0
4
Energy-related products
13,834
19,952
29,785
49.3
5
Textiles and apparel
2,568
2,585
2,649
2.5
6
Footwear
88
105
96
-8.2
7
Minerals and metals
21,972
24,574
29,248
19.0
8
Machinery
20,021
21,544
23,227
7.8
9
Transportation equipment
63,846
64,985
73,193
12.6
10
Electronic products
47,854
50,935
53,499
5.0
11
Miscellaneous manufactures
12,032
11,661
12,948
11.0
12
Special provisions
8,260
8,773
9,766
11.3
Total
269,549
283,269
318,619
12.5
Source: USITC DataWeb/USDOC (accessed
May 9, 2019).
Note: Because of rounding, figures may
not add up to totals shown.
Table
A.28
U.S. general imports
from the EU, by USITC digest sector, 2016–18
Sector
Description
2016
2017
2018
% change 2017–18
Million $
1
Agricultural products
24,664
26,207
27,884
6.4
2
Forest products
5,323
5,809
6,741
16.0
3
Chemicals and related
products
106,665
106,936
126,351
18.2
4
Energy-related products
11,948
12,837
17,782
38.5
5
Textiles and apparel
5,676
5,861
6,574
12.2
6
Footwear
2,053
2,098
2,316
10.4
7
Minerals and metals
27,182
29,609
32,968
11.3
8
Machinery
44,197
48,491
53,887
11.1
9
Transportation equipment
95,780
99,781
106,300
6.5
10
Electronic products
48,517
50,093
53,619
7.0
11
Miscellaneous manufactures
18,769
19,927
21,659
8.7
12
Special provisions
25,495
26,809
31,670
18.1
Total
416,270
434,459
487,753
12.3
Source: USITC DataWeb/USDOC (accessed
May 9, 2019).
Note: Because of rounding, figures may
not add up to totals shown.
Table
A.29
Leading U.S. total
exports to the EU, by HTS 6-digit subheading, 2016–18
HTS 6
Description
2016
2017
2018
% change 2017–18
Million $
8800.00
Civilian aircraft,
engines, and parts
36,530
36,891
44,099
19.5
2709.00
Petroleum oils and oils
from bituminous minerals, crude
1,485
5,828
12,217
109.6
3004.90
Medicaments, in measured
doses, etc. (excluding vaccines, etc., coated bandages etc., and
pharmaceutical goods), n.e.s.o.i.
10,271
8,886
9,278
4.4
2710.19
Petroleum oils, oils from
bituminous minerals (other than crude) & products containing by weight
70% or more of these oils, not biodiesel or waste
7,159
6,702
7,135
6.5
7108.12
Gold, nonmonetary,
unwrought n.e.s.o.i. (other than powder)
3,983
4,985
6,410
28.6
9701.10
Paintings, drawings and
pastels, hand executed works of art, framed or not framed
4,908
5,051
6,053
19.8
3002.15
Immunological products,
put up in measured doses or in forms or packings for retail sale
(a)
5,219
5,972
14.4
9018.90
Instruments and appliances
for medical, surgical or veterinary sciences, n.e.s.o.i., and parts and
accessories thereof
4,369
4,324
4,521
4.6
8517.62
Machines for the
reception, conversion and transmission or regeneration of voice, images or
other data, including switching and routing apparatus
3,964
4,551
4,442
-2.4
3002.12
Antisera and other blood
fractions
(a)
4,088
4,275
4.6
2701.12
Bituminous coal, whether
or not pulverized, but not agglomerated
1,641
3,396
3,926
15.6
7102.39
Diamonds, nonindustrial,
worked, including polished or drilled
3,692
3,062
3,425
11.9
3822.00
Composite diagnostic or
laboratory reagents, other than pharmaceutical preparations of heading 3002
or 3006
2,856
3,079
3,258
5.8
8703.33
Passenger motor vehicles
with compression-ignition internal combustion piston engine (diesel),
cylinder capacity over 2,500 cc
3,890
3,349
3,162
-5.6
1201.90
Soybeans, other than seed
1,899
1,637
3,082
88.3
Total of items shown
86,647
101,048
121,257
20.0
All other HTS subheadings
182,902
182,222
197,363
8.3
Total of all commodities
269,549
283,269
318,619
12.5
Source: USITC DataWeb/USDOC (accessed
May 9, 2019).
Note: Data reflect shipments under
HTS chapters 1–97. Because of rounding, figures may not add up to totals shown.
N.e.s.o.i. = not elsewhere specified or included.
a
Trade
in 2016 reported under HTS subheading 3002.10.
Table
A.30
Leading U.S. total
imports from the EU, by HTS 6-digit subheading, 2016–18
HTS 6
Description
2016
2017
2018
% change 2017–18
Million $
8703.23
Passenger motor vehicles
with spark-ignition internal combustion reciprocating piston engine, cylinder
capacity over 1,500 cc but not over 3,000 cc
26,687
29,779
31,608
6.1
3004.90
Medicaments, in measured
doses, etc. (excluding vaccines, etc., coated bandages etc., and
pharmaceutical goods), n.e.s.o.i.
25,123
25,504
29,107
14.1
3002.15
Immunological products,
put up in measured doses or in forms or packings for retail sale
(a)
5,808
11,351
95.4
2710.12
Light oils and
preparations containing 70% by weight petroleum oils or oils from bituminous
minerals, not containing biodiesel, not waste oils
7,582
7,863
10,389
32.1
8703.24
Passenger motor vehicles
with spark-ignition internal combustion reciprocating piston engine, cylinder
capacity over 3,000 cc
13,498
10,188
8,462
-16.9
8411.91
Parts of turbojets or
turbopropellers
6,945
8,009
8,348
4.2
8803.30
Parts of airplanes or
helicopters, n.e.s.o.i.
4,641
5,094
6,843
34.3
9701.10
Paintings, drawings and
pastels, hand executed works of art, framed or not framed
5,251
5,810
6,457
11.1
3004.39
Medicaments, in measured
doses, etc., containing hormones or other steroids used primarily as
hormones, but not containing antibiotics, n.e.s.o.i.
5,370
5,060
5,509
8.9
3002.20
Vaccines for human
medicine
3,615
4,483
5,138
14.6
8802.40
Airplanes and other
aircraft n.e.s.o.i., of an unladen weight exceeding 15,000 kg
5,476
6,378
5,107
-19.9
2933.59
Heterocyclic compounds
containing a pyrimidine ring (hydrogenated or not) or a piperazine ring in
the structure, n.e.s.o.i.
1,936
2,428
4,414
81.8
8411.12
Turbojets of a thrust
exceeding 25 kN
2,647
2,225
4,387
97.2
3002.90
Human blood; animal blood
prepared for therapeutic, etc. uses; toxins, cultures of micro-organisms
(excluding yeasts) and similar products n.e.s.o.i.
2,381
2,660
3,516
32.2
2710.19
Petroleum oils, oils from
bituminous minerals (other than crude) & products containing by weight
70% or more of these oils, not biodiesel or waste
2,075
2,626
3,475
32.3
Total of items shown
113,227
123,916
144,111
16.3
All other HTS subheadings
303,043
310,543
343,642
10.7
Total all commodities
416,270
434,459
487,753
12.3
Source: USITC DataWeb/USDOC (accessed
May 9, 2019).
Note: Data reflect shipments under
HTS chapters 1–97. Because of rounding, figures may not add up to totals shown.
N.e.s.o.i. = not elsewhere specified or included; cc = cubic centimeters; kN =
kilonewton.
a
Trade
in 2016 reported under HTS subheading 3002.10.
Table
A.31
U.S. private services exports to the EU, by category, 2016–18
Type of service
2016
2017
2018
% change 2017-18
Million $
Other business services
62,581
63,745
67,037
5.2
Charges for IP Use
50,211
50,551
49,885
-1.3
Travel (Business, Personal)
40,556
40,560
41,983
3.5
Financial Services
30,660
34,746
36,806
5.9
Transport (Sea, Air,
Other)
25,131
26,376
27,741
5.2
Telecommunications,
computer, and information services
12,241
13,778
14,178
2.9
Maintenance and repair
services
8,204
8,686
9,547
9.9
Insurance Services
4,173
4,443
4,649
4.6
Total
233,757
242,884
251,824
3.7
Source: USDOC, BEA, U.S.
International Transactions, Services, & IIP, International Transactions, tables
3.1 and 3.2, June 20, 2019.
Notes: Data for 2018 are preliminary.
Table
A.32
U.S. private services imports from the EU, by category, 2016–18
Type of service
2016
2017
2018
% change 2017-18
Million $
Travel (Business,
Personal)
37,391
42,829
47,257
10.3
Other business services
43,539
42,448
44,147
4.0
Transport (Sea, Air,
Other)
33,895
35,649
38,301
7.4
Charges for IP Use
19,677
23,728
23,178
-2.3
Financial Services
12,178
13,452
14,640
8.8
Telecommunications,
computer, and information services
9,308
10,457
11,737
12.2
Insurance Services
11,371
12,297
8,482
-31.0
Maintenance and repair
services
NA
NA
NA
NA
Total
179,557
192,597
198,621
3.1
Source: USDOC, BEA, U.S.
International Transactions, Services, & IIP, International Transactions, tables
3.1 and 3.2, June 20, 2019.
Notes: (1) Data for 2018 are
preliminary and (2) NA for trade data are data suppressed to avoid the
disclosure of data of individual companies.
Table
A.33
U.S. total exports to
China, by USITC digest sector, 2016–18
Sector
Description
2016
2017
2018
% change 2017–18
Million $
1
Agricultural products
22,925
21,017
10,463
-50.2
2
Forest products
6,791
7,496
6,824
-9.0
3
Chemicals and related
products
14,361
16,642
17,850
7.3
4
Energy-related products
2,945
8,969
8,890
-0.9
5
Textiles and apparel
918
932
878
-5.9
6
Footwear
90
109
151
38.7
7
Minerals and metals
7,347
9,059
8,001
-11.7
8
Machinery
9,602
10,449
12,022
15.1
9
Transportation equipment
27,695
31,627
30,174
-4.6
10
Electronic products
20,973
21,522
22,914
6.5
11
Miscellaneous manufactures
875
898
1,035
15.3
12
Special provisions
1,023
1,172
1,140
-2.7
Total
115,546
129,894
120,341
-7.4
Source: USITC DataWeb/USDOC (accessed
May 9, 2019).
Note: Because of rounding, figures may
not add up to totals shown.
Table
A.34
U.S. general imports from
China, by USITC digest sector, 2016–18
Sector
Description
2016
2017
2018
% change 2017–18
Million $
1
Agricultural products
6,721
7,068
7,724
9.3
2
Forest products
9,561
9,816
10,529
7.3
3
Chemicals and related
products
29,842
33,552
40,077
19.4
4
Energy-related products
717
687
798
16.1
5
Textiles and apparel
45,190
45,014
46,979
4.4
6
Footwear
14,821
14,255
14,061
-1.4
7
Minerals and metals
30,280
32,989
36,854
11.7
8
Machinery
48,408
52,979
59,404
12.1
9
Transportation equipment
24,232
26,344
30,434
15.5
10
Electronic products
180,380
205,604
209,956
2.1
11
Miscellaneous manufactures
66,935
70,992
75,738
6.7
12
Special provisions
5,441
6,161
6,940
12.6
Total
462,528
505,462
539,495
6.7
Source: USITC DataWeb/USDOC (accessed
May 9, 2019).
Note: Because of rounding, figures may
not add up to totals shown.
Table
A.35
Leading U.S. total
exports to China, by HTS 6-digit subheading, 2016–18
HTS 6
Description
2016
2017
2018
% change 2017–18
Million $
8800.00
Civilian aircraft,
engines, and parts
14,577
16,265
18,222
12.0
2709.00
Petroleum oils and oils
from bituminous minerals, crude
361
4,401
5,392
22.5
8703.23
Passenger motor vehicles
with spark-ignition internal combustion reciprocating piston engine, cylinder
capacity over 1,500 cc but not over 3,000 cc
6,953
6,524
4,042
-38.0
8542.31
Processors and
controllers, electronic integrated circuits
3,847
3,106
3,929
26.5
1201.90
Soybeans, other than seed
14,203
12,253
3,145
-74.3
8486.20
Machines and apparatus for
the manufacture of semiconductor devices or of electronic integrates circuits
1,743
2,004
2,974
48.4
8542.39
Electronic integrated
circuits, n.e.s.o.i.
777
1,210
1,302
7.6
8703.80
Motor vehicles with only
electric motor, n.e.s.o.i.
0
1,375
1,107
-19.5
7404.00
Copper waste and scrap
1,359
1,716
1,079
-37.1
3004.90
Medicaments, in measured
doses, etc. (excluding vaccines, etc., coated bandages etc., and
pharmaceutical goods), n.e.s.o.i.
721
979
1,069
9.2
8703.24
Passenger motor vehicles
with spark-ignition internal combustion reciprocating piston engine, cylinder
capacity over 3,000 cc
792
1,668
1,054
-36.8
8708.99
Parts and accessories for
motor vehicles, n.e.s.o.i.
883
1,025
1,046
2.0
4703.21
Chemical woodpulp, soda or
sulfate, other than dissolving grades, semibleached or bleached, coniferous
950
1,092
1,028
-5.8
4707.10
Waste and scrap of
unbleached kraft paper or paperboard or of corrugated paper or paperboard
1,021
872
944
8.3
2711.12
Propane, liquefied
817
1,698
929
-45.3
Total of items shown
49,003
56,188
47,262
-15.9
All other HTS subheadings
66,543
73,706
73,079
-0.8
Total of all commodities
115,546
129,894
120,341
-7.4
Source: USITC DataWeb/USDOC (accessed
May 9, 2019).
Note: Because of rounding, figures may
not add up to totals shown. N.e.s.o.i. = not elsewhere specified or included;
cc = cubic centimeters.
Table
A.36
Leading U.S. general
imports from China, by HTS 6-digit subheading, 2016–18
HTS 6
Description
2016
2017
2018
% change 2017–18
Million $
8517.12
Telephones for cellular
networks or for other wireless networks
37,051
44,578
43,207
-3.1
8471.30
Portable digital automatic
data processing machines, weight not more than 10 kg, consisting of at least
a central processing unit, keyboard & a display
33,612
37,306
37,457
0.4
8517.62
Machines for the
reception, conversion and transmission or regeneration of voice, images or
other data, including switching and routing apparatus
18,934
22,935
23,484
2.4
8473.30
Parts and accessories for
automatic data processing machines and units thereof, magnetic or optical
readers, transcribing machines, etc., n.e.s.o.i.
10,218
15,009
16,426
9.4
9503.00
Tricycles, scooters, pedal
cars and similar wheeled toys; dolls’ carriages; dolls; other toys; etc.
12,011
12,238
11,928
-2.5
8471.50
Digital processing units
other than those of 8471.41 and 8471.49, n.e.s.o.i.
3,254
4,412
5,564
26.1
9504.50
Video game consoles and
machines, other than those of subheading 9504.30
3,549
4,498
5,368
19.3
8504.40
Electrical static
converters; power supplies for adp machines or units of 8471
4,445
4,612
5,085
10.2
8528.52
Other monitors capable of
directly connecting to and designed for use with machines of heading 8471
(
a
)
4,596
4,656
1.3
8528.72
Reception apparatus for
television, color, n.e.s.o.i.
Television cameras,
digital cameras and video camera recorders
2,261
3,004
3,430
14.2
9405.40
Electric lamps and
lighting fittings, n.e.s.o.i.
2,943
3,115
3,260
4.6
Total of items shown
141,283
172,111
176,716
2.7
All other HTS subheadings
321,245
333,351
362,779
8.8
Total of all commodities
462,528
505,462
539,495
6.7
Source: USITC DataWeb/USDOC (accessed
May 9, 2019).
Note: Because of rounding, figures
may not add up to totals shown. N.e.s.o.i. = not elsewhere specified or
included; adp = automatic data processing.
a
Trade
in 2016 reported under HTS subheading 8528.51.
Table
A.37
U.S. private services exports to China, by category, 2016–18
Type of service
2016
2017
2018
% change 2017-18
Million $
Travel (Business,
Personal)
31,478
32,828
32,068
-2.3
Charges for IP Use
7,423
7,590
8,467
11.6
Transport (Sea, Air,
Other)
4,937
5,187
5,328
2.7
Financial Services
3,318
3,619
4,171
15.3
Other business services
3,556
3,289
3,532
7.4
Maintenance and repair
services
1,694
1,553
1,863
20.0
Telecommunications,
computer, and information services
832
900
945
5.0
Insurance Services
665
589
335
-43.1
Total
53,903
55,555
56,710
2.1
Source: USDOC, BEA, U.S.
International Transactions, Services, & IIP, International Transactions, tables
3.1 and 3.2, June 20, 2019.
Notes: Data for 2018 are preliminary.
Table
A.38
U.S. private services imports from China, by category, 2016–18
Type of service
2016
2017
2018
% change 2017-18
Million $
Other business services
4,648
4,773
5,443
14.0
Transport (Sea, Air,
Other)
4,387
4,713
5,025
6.6
Travel (Business,
Personal)
4,395
4,554
4,532
-0.5
Financial Services
606
766
878
14.6
Charges for IP Use
548
942
763
-19.0
Telecommunications,
computer, and information services
899
843
709
-15.9
Insurance Services
51
400
654
63.5
Maintenance and repair
services
551
355
257
-27.6
Total
16,084
17,346
18,261
5.3
Source: USDOC, BEA, U.S.
International Transactions, Services, & IIP, International Transactions, tables
3.1 and 3.2, June 20, 2019.
Notes: Data for 2018 are preliminary.
Table
A.39
U.S. total exports to
Canada, by USITC digest sector, 2016–18
Sector
Description
2016
2017
2018
% change 2017–18
Million $
1
Agricultural products
25,889
26,349
26,748
1.5
2
Forest products
9,710
9,946
10,056
1.1
3
Chemicals and related
products
36,491
38,499
39,640
3.0
4
Energy-related products
17,450
20,339
26,545
30.5
5
Textiles and apparel
5,076
5,274
5,135
-2.6
6
Footwear
509
500
486
-2.8
7
Minerals and metals
24,901
26,395
27,935
5.8
8
Machinery
26,263
27,640
29,483
6.7
9
Transportation equipment
73,517
78,364
80,370
2.6
10
Electronic products
31,449
32,816
33,548
2.2
11
Miscellaneous manufactures
8,452
8,864
9,101
2.7
12
Special provisions
7,027
7,278
9,672
32.9
Total
266,734
282,265
298,719
5.8
Source: USITC DataWeb/USDOC (accessed
May 9, 2019).
Note: Because of rounding, figures may
not add up to totals shown.
Table
A.40
U.S. general imports from
Canada, by USITC digest sector, 2016–18
Sector
Description
2016
2017
2018
% change 2017–18
Million $
1
Agricultural products
25,242
26,078
26,888
3.1
2
Forest products
18,704
19,089
19,767
3.5
3
Chemicals and related
products
29,682
29,435
32,436
10.2
4
Energy-related products
54,725
73,689
85,197
15.6
5
Textiles and apparel
2,181
2,230
2,332
4.5
6
Footwear
50
52
51
-0.5
7
Minerals and metals
28,785
31,581
32,830
4.0
8
Machinery
12,172
13,541
14,511
7.2
9
Transportation equipment
73,657
71,870
70,778
-1.5
10
Electronic products
8,927
9,286
9,807
5.6
11
Miscellaneous manufactures
5,534
5,251
5,503
4.8
12
Special provisions
18,107
17,176
18,314
6.6
Total
277,766
299,280
318,414
6.4
Source: USITC DataWeb/USDOC (accessed
May 9, 2019).
Note: Because of rounding, figures may
not add up to totals shown.
Table
A.41
Leading U.S. total
exports to Canada, by HTS 6-digit subheading, 2016–18
HTS 6
Description
2016
2017
2018
% change 2017–18
Million $
2709.00
Petroleum oils and oils
from bituminous minerals, crude
5,634
6,664
9,344
40.2
8800.00
Civilian aircraft,
engines, and parts
7,494
8,204
8,971
9.4
8703.24
Passenger motor vehicles
with spark-ignition internal combustion reciprocating piston engine, cylinder
capacity over 3,000 cc
7,446
8,581
8,293
-3.4
2710.12
Light oils and
preparations containing 70% by weight petroleum oils or oils from bituminous
minerals, not containing biodiesel, not waste oils
5,208
5,547
7,708
38.9
8704.31
Motor vehicles for goods
transport n.e.s.o.i., with spark-ignition internal combustion piston engine,
gvw not over 5 metric tons
7,420
8,405
7,562
-10.0
8708.29
Parts and accessories of bodies
(including cabs) for motor vehicles, n.e.s.o.i.
5,187
4,973
4,817
-3.1
2710.19
Petroleum oils, oils from
bituminous minerals (other than crude) & products containing by weight
70% or more of these oils, not biodiesel or waste
2,786
2,953
4,206
42.4
8703.23
Passenger motor vehicles
with spark-ignition internal combustion reciprocating piston engine, cylinder
capacity over 1,500 cc but not over 3,000 cc
5,661
4,244
3,783
-10.9
8407.34
Spark-ignition
reciprocating piston engines for propulsion of vehicles except railway or
tramway stock, over 1,000 cc cylinder capacity
3,922
3,849
3,304
-14.1
8708.99
Parts and accessories for
motor vehicles, n.e.s.o.i.
2,820
2,814
2,663
-5.4
8708.40
Gear boxes for motor
vehicles
2,015
2,316
2,377
2.6
8517.62
Machines for the
reception, conversion and transmission or regeneration of voice, images or
other data, including switching and routing apparatus
1,949
2,259
2,345
3.8
8471.30
Portable digital automatic
data processing machines, weight not more than 10 kg, consisting of at least
a central processing unit, keyboard & a display
2,033
2,157
2,274
5.5
8701.20
Road tractors for
semi-trailers
1,269
1,405
2,234
59.0
2711.21
Natural gas, gaseous
1,594
2,616
2,172
-17.0
Total of items shown
62,438
66,989
72,050
7.6
All other HTS subheadings
204,297
215,276
226,669
5.3
Total of all commodities
266,734
282,265
298,719
5.8
Source: USITC DataWeb/USDOC (accessed
May 9, 2019).
Note: Data reflect shipments under HTS
chapters 1–97. Because of rounding, figures may not add up to totals shown.
N.e.s.o.i. = not elsewhere specified or included; gvw = gross vehicle weight;
cc=cubic centimeters.
Table
A.42
Leading U.S. general
imports from Canada, by HTS 6-digit subheading, 2016–18
HTS 6
Description
2016
2017
2018
% change 2017–18
Million $
2709.00
Petroleum oils and oils
from bituminous minerals, crude
36,184
50,125
60,845
21.4
8703.24
Passenger motor vehicles
with spark-ignition internal combustion reciprocating piston engine, cylinder
capacity over 3,000 cc
21,848
21,361
17,814
-16.6
8703.23
Passenger motor vehicles
with spark-ignition internal combustion reciprocating piston engine, cylinder
capacity over 1,500 cc but not over 3,000 cc
21,521
15,068
12,874
-14.6
2710.19
Petroleum oils, oils from
bituminous minerals (other than crude) & products containing by weight
70% or more of these oils, not biodiesel or waste
3,424
4,913
6,280
27.8
2711.21
Natural gas, gaseous
5,666
6,902
6,073
-12.0
8703.22
Passenger motor vehicles
with spark-ignition internal combustion reciprocating piston engine, cylinder
capacity over 1,000 cc but not over 1,500 cc
1,317
5,494
5,468
-0.5
4407.10
Coniferous wood sawn or
chipped lengthwise, sliced or peeled, whether or not planed, etc., over 6 mm
(.236 in.) thick
5,549
5,773
4,522
-21.7
2710.12
Light oils and
preparations containing 70% by weight petroleum oils or oils from bituminous
minerals, not containing biodiesel, not waste oils
3,755
4,793
4,420
-7.8
8708.29
Parts and accessories of
bodies (including cabs) for motor vehicles, n.e.s.o.i.
3,451
3,347
3,794
13.3
3004.90
Medicaments, in measured
doses, etc. (excluding vaccines, etc., coated bandages etc., and
pharmaceutical goods), n.e.s.o.i.
3,422
2,316
2,688
16.0
7601.10
Aluminum, not alloyed,
unwrought
2,321
3,233
2,586
-20.0
7601.20
Aluminum alloys, unwrought
1,904
2,240
2,584
15.3
3104.20
Potassium chloride
1,779
2,082
2,329
11.9
8407.34
Spark-ignition
reciprocating piston engines for propulsion of vehicles except railway or
tramway stock, over 1,000 cc cylinder capacity
2,437
2,238
2,328
4.0
2716.00
Electrical energy
2,192
2,266
2,084
-8.0
Total of items shown
116,770
132,151
136,688
3.4
All other HTS subheadings
160,996
167,128
181,726
8.7
Total of all commodities
277,766
299,280
318,414
6.4
Source: USITC DataWeb/USDOC (accessed
May 9, 2019).
Note: Data reflect shipments under HTS
chapters 1–97. Because of rounding, figures may not add up to totals shown.
N.e.s.o.i. = not elsewhere specified or included; cc = cubic centimeters.
Table
A.43
U.S. private services exports to Canada, by category, 2016–18
Type of service
2016
2017
2018
% change 2017-18
Million $
Travel (Business,
Personal)
16,010
17,160
18,164
5.9
Other business services
9,695
11,123
14,215
27.8
Charges for IP Use
7,908
8,483
8,538
0.6
Transport (Sea, Air,
Other)
6,572
7,063
8,017
13.5
Financial Services
6,427
6,952
7,236
4.1
Telecommunications,
computer, and information services
3,356
4,002
4,313
7.8
Insurance Services
2,029
1,783
1,828
2.5
Maintenance and repair
services
2,034
1,258
1,338
6.4
Total
54,031
57,823
63,648
10.1
Source: USDOC, BEA, U.S.
International Transactions, Services, & IIP, International Transactions, tables
3.1 and 3.2, June 20, 2019.
Notes: Data for 2018 are preliminary.
Table
A.44
U.S. private services imports from Canada, by category, 2016–18
Type of service
2016
2017
2018
% change 2017-18
Million $
Travel (Business,
Personal)
7,898
8,519
9,164
7.6
Other business services
7,498
8,635
8,822
2.2
Transport (Sea, Air,
Other)
5,309
5,464
5,535
1.3
Telecommunications,
computer, and information services
4,159
4,395
4,993
13.6
Financial Services
2,019
2,153
2,424
12.6
Charges for IP Use
1,580
1,707
2,347
37.5
Maintenance and repair
services
1,458
1,442
1,673
16.0
Insurance Services
501
618
679
9.9
Total
30,422
32,933
35,635
8.2
Source: USDOC, BEA, U.S.
International Transactions, Services, & IIP, International Transactions, tables
3.1 and 3.2, June 20, 2019.
Notes: Data for 2018 are preliminary.
Table
A.45
U.S. total exports to
Mexico, by USITC digest sector, 2016–18
Sector
Description
2016
2017
2018
% change 2017–18
Million $
1
Agricultural products
18,497
19,263
19,710
2.3
2
Forest products
5,754
6,055
6,314
4.3
3
Chemicals and related
products
32,906
35,064
38,398
9.5
4
Energy-related products
19,810
27,018
34,695
28.4
5
Textiles and apparel
5,471
5,554
5,870
5.7
6
Footwear
97
95
104
9.1
7
Minerals and metals
20,994
22,030
23,792
8.0
8
Machinery
23,200
24,066
25,237
4.9
9
Transportation equipment
39,959
41,096
43,282
5.3
10
Electronic products
53,558
53,046
56,752
7.0
11
Miscellaneous manufactures
3,044
2,974
3,145
5.8
12
Special provisions
6,761
7,054
7,711
9.3
Total
230,051
243,314
265,010
8.9
Source: USITC DataWeb/USDOC (accessed
May 9, 2019).
Note: Because of rounding, figures may
not add up to totals shown.
Table
A.46
U.S. general imports from
Mexico, by USITC digest sector, 2016–18
Sector
Description
2016
2017
2018
% change 2017–18
Million $
1
Agricultural products
24,885
26,697
28,313
6.1
2
Forest products
1,906
1,978
2,150
8.7
3
Chemicals and related
products
10,604
11,531
12,740
10.5
4
Energy-related products
8,724
11,407
15,901
39.4
5
Textiles and apparel
5,798
6,097
6,148
0.8
6
Footwear
413
416
500
20.2
7
Minerals and metals
18,084
19,364
21,152
9.2
8
Machinery
29,888
31,391
33,736
7.5
9
Transportation equipment
105,197
114,193
126,991
11.2
10
Electronic products
73,500
75,758
82,745
9.2
11
Miscellaneous manufactures
6,783
6,704
7,100
5.9
12
Special provisions
8,138
8,726
9,049
3.7
Total
293,920
314,262
346,524
10.3
Source: USITC DataWeb/USDOC (accessed
May 9, 2019).
Note: Because of rounding, figures may
not add up to totals shown.
Table
A.47
Leading U.S. total
exports to Mexico, by HTS 6-digit subheading, 2016–18
HTS 6
Description
2016
2017
2018
% change 2017–18
Million $
2710.12
Light oils and
preparations containing 70% by weight petroleum oils or oils from bituminous
minerals, not containing biodiesel, not waste oils
9,479
11,911
15,459
29.8
2710.19
Petroleum oils, oils from
bituminous minerals (other than crude) & products containing by weight
70% or more of these oils, not biodiesel or waste
6,008
8,992
12,041
33.9
8473.30
Parts and accessories for
automatic data processing machines and units thereof, magnetic or optical
readers, transcribing machines, etc., n.e.s.o.i.
10,856
10,441
11,621
11.3
8408.20
Compression-ignition
internal combustion piston engines (diesel or semi-diesel), for the
propulsion of vehicles except railway or tramway stock
2,507
3,581
4,474
24.9
8542.31
Processors and
controllers, electronic integrated circuits
3,310
3,618
3,913
8.1
8708.29
Parts and accessories of
bodies (including cabs) for motor vehicles, n.e.s.o.i.
3,119
3,279
3,582
9.3
8800.00
Civilian aircraft,
engines, and parts
2,677
3,234
3,399
5.1
8471.70
Automatic data processing
storage units, n.e.s.o.i.
2,810
2,882
3,212
11.4
1005.90
Corn (maize), other than
seed corn
2,575
2,668
3,099
16.1
8517.62
Machines for the
reception, conversion and transmission or regeneration of voice, images or
other data, including switching and routing apparatus
3,046
2,932
3,074
4.8
8708.40
Gear boxes for motor
vehicles
2,546
2,843
3,057
7.5
8708.99
Parts and accessories for
motor vehicles, n.e.s.o.i.
3,666
3,032
3,032
0.0
3926.90
Articles of plastics,
n.e.s.o.i.
2,377
2,507
2,603
3.8
2711.21
Natural gas, gaseous
2,059
2,036
2,368
16.3
2711.12
Propane, liquefied
1,093
1,918
2,050
6.9
Total of items shown
58,130
65,874
76,983
16.9
All other HTS subheadings
171,922
177,441
188,027
6.0
Total of all commodities
230,051
243,314
265,010
8.9
Source: USITC DataWeb/USDOC (accessed
May 9, 2019).
Note: Data reflect shipments under HTS
chapters 1–97. Because of rounding, figures may not add up to totals shown.
N.e.s.o.i. = not elsewhere specified or included.
Table
A.48
Leading U.S. general
imports from Mexico, by HTS 6-digit subheading, 2016–18
HTS 6
Description
2016
2017
2018
% change 2017–18
Million $
8471.50
Digital processing units
other than those of 8471.41 and 8471.49, n.e.s.o.i.
15,165
17,488
24,211
38.4
8703.23
Passenger motor vehicles
with spark-ignition internal combustion reciprocating piston engine, cylinder
capacity over 1,500 cc but not over 3,000 cc
17,964
20,358
22,700
11.5
8704.31
Motor vehicles for goods
transport n.e.s.o.i., with spark-ignition internal combustion piston engine,
gvw not over 5 metric tons
15,400
15,378
15,436
0.4
2709.00
Petroleum oils and oils
from bituminous minerals, crude
7,583
10,052
14,445
43.7
8517.62
Machines for the
reception, conversion and transmission or regeneration of voice, images or
other data, including switching and routing apparatus
11,063
9,512
9,100
-4.3
8701.20
Road tractors for
semi-trailers
4,756
5,750
8,479
47.4
8528.72
Reception apparatus for
television, color, n.e.s.o.i.
8,720
8,404
8,123
-3.4
8703.22
Passenger motor vehicles
with spark-ignition internal combustion reciprocating piston engine, cylinder
capacity over 1,000 cc but not over 1,500 cc
3,613
5,934
8,005
34.9
8544.30
Insulated ignition wiring
sets and other wiring sets for vehicles, aircraft and ships
7,057
6,873
7,937
15.5
9401.90
Parts of seats (except
parts of medical, dentist, barber, and similar seats), n.e.s.o.i.
6,613
6,211
6,154
-0.9
8708.29
Parts and accessories of
bodies (including cabs) for motor vehicles, n.e.s.o.i.
4,988
4,872
5,572
14.4
8708.99
Parts and accessories for
motor vehicles, n.e.s.o.i.
3,839
4,291
4,717
9.9
8704.21
Motor vehicles for goods
transport n.e.s.o.i., with compression-ignition internal combustion piston
engine (diesel), gvw not over 5 metric tons
2,397
2,494
3,829
53.5
9018.90
Instruments and appliances
for medical, surgical or veterinary sciences, n.e.s.o.i., and parts and
accessories thereof
3,407
3,450
3,675
6.5
2203.00
Beer made from malt
3,100
3,321
3,604
8.5
Total of items shown
115,664
124,388
145,986
17.4
All other HTS subheadings
178,256
189,874
200,538
5.6
Total of all commodities
293,920
314,262
346,524
10.3
Source: USITC DataWeb/USDOC (accessed
May 9, 2019).
Note: Data reflect shipments under HTS
chapters 1–97. Because of rounding, figures may not add up to totals shown.
N.e.s.o.i. = not elsewhere specified or included; gvw = gross vehicle weight;
cc = cubic centimeters.
Table
A.49
U.S. private services exports to Mexico, by category, 2016–18
Type of service
2016
2017
2018
% change 2017-18
Million $
Travel (Business,
Personal)
16,848
17,573
17,884
1.8
Transport (Sea, Air,
Other)
3,885
3,975
4,202
5.7
Charges for IP Use
3,777
3,691
3,895
5.5
Other business services
2,787
3,078
3,120
1.4
Financial Services
1,504
1,438
1,566
8.9
Telecommunications,
computer, and information services
1,057
1,295
1,508
16.4
Maintenance and repair
services
674
632
778
23.1
Insurance Services
385
413
421
1.9
Total
30,918
32,097
33,374
4.0
Source: USDOC, BEA, U.S.
International Transactions, Services, & IIP, International Transactions, tables
3.1 and 3.2, June 20, 2019.
Notes: Data for 2018 are preliminary.
Table
A.50
U.S. private services imports from Mexico, by category, 2016–18
Type of service
2016
2017
2018
% change 2017-18
Million $
Travel (Business,
Personal)
15,942
17,085
17,375
1.7
Transport (Sea, Air,
Other)
3,076
3,096
3,370
8.9
Other business services
2,628
2,856
2,408
-15.7
Telecommunications,
computer, and information services
925
947
948
0.1
Charges for IP Use
766
699
917
31.2
Financial Services
360
355
400
12.7
Maintenance and repair services
252
299
238
-20.4
Insurance Services
24
18
7
-61.1
Total
23,973
25,354
25,664
1.2
Source: USDOC, BEA, U.S.
International Transactions, Services, & IIP, International Transactions, tables
3.1 and 3.2, June 20, 2019.
Notes: Data for 2018 are preliminary.
Table
A.51
U.S. total exports to
Japan, by USITC digest sector, 2016–18
Sector
Description
2016
2017
2018
% change 2017–18
Million $
1
Agricultural products
12,099
12,918
13,867
7.4
2
Forest products
1,887
1,922
2,013
4.8
3
Chemicals and related
products
11,531
11,853
12,394
4.6
4
Energy-related products
2,667
5,780
9,195
59.1
5
Textiles and apparel
523
513
553
7.8
6
Footwear
56
50
50
-0.3
7
Minerals and metals
3,405
3,669
4,252
15.9
8
Machinery
4,308
5,769
6,617
14.7
9
Transportation equipment
11,123
9,671
9,806
1.4
10
Electronic products
12,311
12,174
12,528
2.9
11
Miscellaneous manufactures
2,163
2,076
2,330
12.2
12
Special provisions
1,152
1,210
1,360
12.4
Total
63,226
67,605
74,967
10.9
Source: USITC DataWeb/USDOC (accessed
May 9, 2019).
Note: Because of rounding, figures may
not add up to totals shown.
Table
A.52
U.S. general imports from
Japan, by USITC digest sector, 2016–18
Sector
Description
2016
2017
2018
% change 2017–18
Million $
1
Agricultural products
916
915
988
7.9
2
Forest products
449
443
428
-3.3
3
Chemicals and related
products
11,493
11,948
13,424
12.4
4
Energy-related products
506
594
872
46.9
5
Textiles and apparel
737
747
795
6.3
6
Footwear
9
3
5
59.0
7
Minerals and metals
6,234
6,354
6,702
5.5
8
Machinery
17,308
18,689
18,924
1.3
9
Transportation equipment
68,643
70,605
72,545
2.7
10
Electronic products
21,214
21,514
22,585
5.0
11
Miscellaneous manufactures
1,196
1,284
1,440
12.2
12
Special provisions
3,323
3,385
3,887
14.8
Total
132,029
136,480
142,596
4.5
Source: USITC DataWeb/USDOC (accessed
May 9, 2019).
Note: Because of rounding, figures may
not add up to totals shown.
Table
A.53
Leading U.S. total
exports to Japan, by HTS 6-digit subheading, 2016–18
HTS 6
Description
2016
2017
2018
% change 2017–18
Million $
8800.00
Civilian aircraft,
engines, and parts
6,877
5,725
5,637
-1.5
2711.12
Propane, liquefied
1,334
2,894
3,986
37.7
1005.90
Corn (maize), other than
seed corn
2,099
2,154
2,812
30.6
8486.20
Machines and apparatus for
the manufacture of semiconductor devices or of electronic integrates circuits
848
1,731
2,185
26.2
3004.90
Medicaments, in measured
doses, etc. (excluding vaccines, etc., coated bandages etc., and
pharmaceutical goods), n.e.s.o.i.
2,095
1,658
1,617
-2.5
2709.00
Petroleum oils and oils
from bituminous minerals, crude
112
504
1,451
187.7
9018.90
Instruments and appliances
for medical, surgical or veterinary sciences, n.e.s.o.i., and parts and
accessories thereof
1,217
1,220
1,388
13.8
3002.15
Immunological products,
put up in measured doses or in forms or packings for retail sale
(
a
)
1,132
1,305
15.3
2701.12
Bituminous coal, whether
or not pulverized, but not agglomerated
409
865
1,230
42.2
2909.19
Acyclic ethers (excluding
diethyl ether) and their halogenated, sulfonated, nitrated or nitrosated
derivatives
912
1,133
1,171
3.4
0201.30
Meat of bovine animals,
boneless, fresh or chilled
796
1,090
1,162
6.6
0203.19
Meat of swine, n.e.s.o.i.,
fresh or chilled
968
1,002
972
-3.0
1201.90
Soybeans, other than seed
1,000
974
947
-2.7
2711.11
Natural gas, liquefied
73
337
825
145.1
1001.99
Wheat and meslin, not
durum wheat, other than seed
604
708
695
-1.9
Total of items shown
19,346
23,128
27,384
18.4
All other HTS subheadings
43,880
44,478
47,583
7.0
Total of all commodities
63,226
67,605
74,967
10.9
Source: USITC DataWeb/USDOC (accessed
May 9, 2019).
Note: Data reflect shipments under
HTS chapters 1–97. Because of rounding, figures may not add up to totals shown.
N.e.s.o.i. = not elsewhere specified or included.
a
Trade
in 2015 and 2016 reported under HTS subheading 3002.10.
Table
A.54
Leading U.S. total
imports from Japan, by HTS 6-digit subheading, 2016–18
HTS 6
Description
2016
2017
2018
% change 2017–18
Million $
8703.23
Passenger motor vehicles
with spark-ignition internal combustion reciprocating piston engine, cylinder
capacity over 1,500 cc but not over 3,000 cc
26,339
24,302
23,608
-2.9
8703.24
Passenger motor vehicles
with spark-ignition internal combustion reciprocating piston engine, cylinder
capacity over 3,000 cc
10,557
10,800
10,541
-2.4
8803.30
Parts of airplanes or
helicopters, n.e.s.o.i.
4,471
3,983
4,155
4.3
8708.40
Gear boxes for motor
vehicles
2,688
3,343
3,176
-5.0
8703.40
Passenger motor vehicles,
with both spark-ignition internal combustion and electric motor, other than
those charges by plug in to external electric power
(
a
)
3,151
2,738
-13.1
8703.22
Passenger motor vehicles
with spark-ignition internal combustion reciprocating piston engine, cylinder
capacity over 1,000 cc but not over 1,500 cc
2,312
686
2,674
289.5
8443.99
Parts and accessories of
printers, copying machines and facsimile machines, n.e.s.o.i.
2,598
2,556
2,587
1.2
8429.52
Mechanical shovels,
excavators and shovel loaders with 360 degree revolving superstructure,
self-propelled
1,942
2,004
2,497
24.6
8411.91
Parts of turbojets or
turbopropellers
1,815
1,927
1,977
2.6
8708.99
Parts and accessories for
motor vehicles, n.e.s.o.i.
2,090
1,895
1,811
-4.4
3004.90
Medicaments, in measured
doses, etc. (excluding vaccines, etc., coated bandages etc., and
pharmaceutical goods), n.e.s.o.i.
Machines and apparatus for
the manufacture of semiconductor devices or of electronic integrates circuits
1,198
1,267
1,324
4.5
8409.91
Parts for use with
spark-ignition internal combustion piston engines (including rotary engines),
n.e.s.o.i.
1,287
1,383
1,199
-13.3
8486.90
Machines and apparatus of
a kind used for the manufacture of semiconductor boules or wafers, etc.,
parts and accessories
887
1,169
1,188
1.7
Total of items shown
59,995
60,800
62,416
2.7
All other HTS subheadings
72,034
75,680
80,180
5.9
Total of all commodities
132,029
136,480
142,596
4.5
Source: USITC DataWeb/USDOC (accessed
May 9, 2019).
Note: Data reflect shipments under
HTS chapters 1–97. Because of rounding, figures may not add up to totals shown.
N.e.s.o.i. = not elsewhere specified or included; cc = cubic centimeters.
Table
A.55
U.S. private services exports to Japan, by category, 2016–18
Type of service
2016
2017
2018
% change 2017-18
Million $
Travel (Business,
Personal)
11,112
10,808
10,283
-4.9
Transport (Sea, Air,
Other)
9,627
10,065
9,810
-2.5
Other business services
7,995
7,908
7,662
-3.1
Charges for IP Use
6,786
7,025
6,606
-6.0
Financial Services
3,336
3,472
3,722
7.2
Insurance Services
2,294
2,555
2,777
8.7
Telecommunications,
computer, and information services
2,067
2,119
2,066
-2.5
Maintenance and repair
services
1,193
1,275
1,496
17.3
Total
44,409
45,227
44,422
-1.8
Source: USDOC, BEA, U.S.
International Transactions, Services, & IIP, International Transactions, tables
3.1 and 3.2, June 20, 2019.
Note: Data for 2018 are preliminary.
Table
A.56
U.S. private services imports from Japan, by category, 2016–18
Type of service
2016
2017
2018
% change 2017-18
Million $
Charges for IP Use
11,113
11,053
11,813
6.9
Transport (Sea, Air,
Other)
8,332
8,853
9,186
3.8
Travel (Business,
Personal)
3,055
3,294
3,586
8.9
Other business services
2,761
3,491
3,415
-2.2
Financial Services
1,492
1,417
1,641
15.8
Telecommunications,
computer, and information services
485
497
338
-32.0
Insurance Services
375
343
320
-6.7
Maintenance and repair
services
111
70
100
42.9
Total
27,725
29,018
30,397
4.8
Source: USDOC, BEA, U.S.
International Transactions, Services, & IIP, International Transactions, tables
3.1 and 3.2, June 20, 2019.
Note: Data for 2018 are preliminary.
Table
A.57
U.S. total exports to
South Korea, by USITC digest sector, 2016–18
Sector
Description
2016
2017
2018
% change 2017–18
Million $
1
Agricultural products
6,841
7,461
9,030
21.0
2
Forest products
791
785
852
8.6
3
Chemicals and related
products
6,527
7,234
8,233
13.8
4
Energy-related products
1,752
4,183
10,027
139.7
5
Textiles and apparel
321
310
314
1.4
6
Footwear
53
45
37
-19.0
7
Minerals and metals
2,549
2,613
3,269
25.1
8
Machinery
5,617
8,702
7,474
-14.1
9
Transportation equipment
8,582
6,314
6,574
4.1
10
Electronic products
7,652
9,106
8,580
-5.8
11
Miscellaneous manufactures
990
863
1,092
26.6
12
Special provisions
638
711
861
21.1
Total
42,313
48,326
56,344
16.6
Source: USITC DataWeb/USDOC (accessed
May 9, 2019).
Note: Because of rounding, figures may
not add up to totals shown.
Table
A.58
U.S. general imports from
South Korea, by USITC digest sector, 2016–18
Sector
Description
2016
2017
2018
% change 2017–18
Million $
1
Agricultural products
810
843
864
2.4
2
Forest products
544
537
696
29.5
3
Chemicals and related
products
8,512
7,822
10,002
27.9
4
Energy-related products
2,260
2,874
3,125
8.7
5
Textiles and apparel
1,271
1,232
1,319
7.1
6
Footwear
27
45
55
23.7
7
Minerals and metals
5,309
5,823
5,788
-0.6
8
Machinery
7,082
7,902
8,231
4.2
9
Transportation equipment
25,305
25,300
24,173
-4.5
10
Electronic products
16,551
16,813
17,561
4.4
11
Miscellaneous manufactures
968
887
915
3.1
12
Special provisions
1,251
1,366
1,496
9.5
Total
69,888
71,444
74,223
3.9
Source: USITC DataWeb/USDOC (accessed
May 9, 2019).
Note: Because of rounding, figures may
not add up to totals shown.
Table
A.59
Leading U.S. total
exports to South Korea, by HTS 6-digit subheading, 2016–18
HTS 6
Description
2016
2017
2018
% change 2017–18
Million $
2709.00
Petroleum oils and oils
from bituminous minerals, crude
181
1,095
5,590
410.4
8486.20
Machines and apparatus for
the manufacture of semiconductor devices or of electronic integrated circuits
1,911
4,731
3,392
-28.3
8800.00
Civilian aircraft,
engines, and parts
3,505
2,862
2,986
4.3
8542.31
Processors and
controllers, electronic integrated circuits
2,094
2,513
2,572
2.3
2711.12
Propane, liquefied
556
921
1,402
52.2
1005.90
Corn (maize), other than
seed corn
870
711
1,363
91.6
2711.11
Natural gas, liquefied
43
596
1,284
115.4
8486.90
Machines and apparatus of
a kind used for the manufacture of semiconductor boules or wafers, etc.,
parts and accessories
663
838
1,104
31.7
8703.23
Passenger motor vehicles
with spark-ignition internal combustion reciprocating piston engine, cylinder
capacity over 1,500 cc but not over 3,000 cc
741
684
764
11.6
2905.11
Methanol (methyl alcohol)
122
205
604
194.5
0202.30
Meat of bovine animals,
boneless, frozen
418
334
604
81.0
0203.29
Meat of swine, n.e.s.o.i.,
frozen
298
403
561
39.1
0202.20
Meat of bovine animals,
cuts with bone in (other than half or whole carcasses), frozen
368
408
540
32.3
2701.12
Bituminous coal, whether
or not pulverized, but not agglomerated
287
623
480
-22.9
0201.30
Meat of bovine animals,
boneless, fresh or chilled
200
370
476
28.6
Total of items shown
12,256
17,294
23,721
37.2
All other HTS subheadings
30,056
31,032
32,624
5.1
Total of all commodities
42,313
48,326
56,344
16.6
Source: USITC DataWeb/USDOC (accessed
May 9, 2019).
Note: Data reflect shipments under
HTS chapters 1–97. Because of rounding, figures may not add up to totals shown.
N.e.s.o.i. = not elsewhere specified or included; cc = cubic centimeters.
Table
A.60
Leading U.S. general
imports from South Korea, by HTS 6-digit subheading, 2016–18
HTS 6
Description
2016
2017
2018
% change 2017–18
Million $
8703.23
Passenger motor vehicles
with spark-ignition internal combustion reciprocating piston engine, cylinder
capacity over 1,500 cc but not over 3,000 cc
10,807
8,547
9,076
6.2
8473.30
Parts and accessories for
automatic data processing machines and units thereof, magnetic or optical
readers, transcribing machines, etc., n.e.s.o.i.
1,325
2,661
4,966
86.6
8517.12
Telephones for cellular
networks or for other wireless networks
6,287
5,557
3,859
-30.6
2710.19
Petroleum oils, oils from
bituminous minerals (other than crude) & products containing by weight
70% or more of these oils, not biodiesel or waste
2,067
2,581
2,767
7.2
8703.22
Passenger motor vehicles
with spark-ignition internal combustion reciprocating piston engine, cylinder
capacity over 1,000 cc but not over 1,500 cc
2,443
2,032
2,535
24.7
3002.14
Immunological products,
mixed, not put up in measured doses or in forms or packings for retail sale
(
a
)
910
2,023
122.4
8542.39
Electronic integrated
circuits, n.e.s.o.i.
1,278
1,383
1,373
-0.7
8703.24
Passenger motor vehicles
with spark-ignition internal combustion reciprocating piston engine, cylinder
capacity over 3,000 cc
2,647
3,714
1,302
-64.9
8708.99
Parts and accessories for
motor vehicles, n.e.s.o.i.
1,301
1,166
1,227
5.2
4011.10
New pneumatic tires, of
rubber, of a kind used on motor cars (including station wagons and racing
cars)
1,068
952
988
3.8
8418.10
Combined
refrigerator-freezers fitted with separate external doors
1,045
1,012
906
-10.5
8708.29
Parts and accessories of
bodies (including cabs) for motor vehicles, n.e.s.o.i.
Passenger motor vehicles,
with both spark-ignition internal combustion and electric motor, other than those
charges by plug in to external electric power
(
b
)
921
741
-19.6
Total of items shown
32,458
33,798
34,226
1.3
All other HTS subheadings
37,431
37,645
39,997
6.2
Total of all commodities
69,888
71,444
74,223
3.9
Source: USITC DataWeb/USDOC (accessed
May 9, 2019).
Note: Data reflect shipments under
HTS chapters 1–97. Because of rounding, figures may not add up to totals shown.
N.e.s.o.i. = not elsewhere specified or included; cc = cubic centimeters.
a
Trade
in 2016 reported under HTS subheading 3002.10.
Table
A.61
U.S. private services exports to South Korea, by category, 2016–18
Type of service
2016
2017
2018
% change 2017-18
Million $
Travel (Business,
Personal)
8,783
9,871
9,388
-4.9
Charges for IP Use
5,852
6,130
5,043
-17.7
Transport (Sea, Air,
Other)
2,348
2,667
2,651
-0.6
Other business services
1,826
1,795
1,614
-10.1
Financial Services
991
1,113
1,166
4.8
Maintenance and repair
services
736
909
1,111
22.2
Telecommunications,
computer, and information services
647
734
677
-7.8
Insurance Services
243
259
252
-2.7
Total
21,426
23,478
21,902
-6.7
Source: USDOC, BEA, U.S.
International Transactions, Services, & IIP, International Transactions, tables
3.1 and 3.2, June 20, 2019.
Notes: Data for 2018 are preliminary.
Table
A.62
U.S. private services imports from South Korea, by category, 2016–18
Type of service
2016
2017
2018
% change 2017-18
Million $
Transport (Sea, Air,
Other)
5,718
6,048
6,498
7.4
Travel (Business, Personal)
1,246
1,247
1,451
16.4
Other business services
1,038
975
956
-1.9
Charges for IP Use
303
425
459
8.0
Financial Services
279
357
340
-4.8
Insurance Services
103
93
99
6.5
Telecommunications,
computer, and information services
56
52
43
-17.3
Maintenance and repair
services
27
28
25
-10.7
Total
8,767
9,224
9,871
7.0
Source: USDOC, BEA, U.S.
International Transactions, Services, & IIP, International Transactions, tables
3.1 and 3.2, June 20, 2019.
Notes: Data for 2018 are preliminary.
Table
A.63
U.S. total exports to
India, by USITC digest sector, 2016–18
Sector
Description
2016
2017
2018
% change 2017–18
Million $
1
Agricultural products
1,439
1,907
1,772
-7.1
2
Forest products
693
828
994
20.1
3
Chemicals and related
products
3,357
3,376
4,144
22.7
4
Energy-related products
1,259
3,137
6,711
113.9
5
Textiles and apparel
206
172
187
8.8
6
Footwear
2
2
4
91.2
7
Minerals and metals
7,838
7,861
9,344
18.9
8
Machinery
1,278
1,307
1,487
13.7
9
Transportation equipment
1,994
3,194
4,284
34.1
10
Electronic products
2,641
2,943
3,231
9.8
11
Miscellaneous manufactures
555
484
365
-24.6
12
Special provisions
374
476
597
25.5
Total
21,636
25,689
33,120
28.9
Source: USITC DataWeb/USDOC (accessed
May 9, 2019).
Note: Because of rounding, figures may
not add up to totals shown.
Table
A.64
U.S. general imports from
India, by USITC digest sector, 2016–18
Sector
Description
2016
2017
2018
% change 2017–18
Million $
1
Agricultural products
3,512
4,652
4,795
3.1
2
Forest products
251
282
357
26.7
3
Chemicals and related
products
11,168
10,378
11,166
7.6
4
Energy-related products
2,362
2,369
2,838
19.8
5
Textiles and apparel
7,949
8,194
8,550
4.4
6
Footwear
503
448
440
-1.9
7
Minerals and metals
11,428
12,139
13,130
8.2
8
Machinery
2,061
2,388
3,214
34.6
9
Transportation equipment
1,874
2,282
3,931
72.3
10
Electronic products
1,207
1,247
1,553
24.6
11
Miscellaneous manufactures
3,038
3,101
3,254
5.0
12
Special provisions
631
819
780
-4.8
Total
45,983
48,297
54,007
11.8
Source: USITC DataWeb/USDOC (accessed
May 9, 2019).
Note: Because of rounding, figures may
not add up to totals shown.
Table
A.65
Leading U.S. total
exports to India, by HTS 6-digit subheading, 2016–18
HTS 6
Description
2016
2017
2018
% change 2017–18
Million $
7102.39
Diamonds, nonindustrial,
worked, including polished or drilled
4,802
4,109
5,216
26.9
2709.00
Petroleum oils and oils
from bituminous minerals, crude
0
507
3,016
494.6
8800.00
Civilian aircraft,
engines, and parts
965
1,511
2,640
74.7
7108.12
Gold, nonmonetary,
unwrought n.e.s.o.i. (other than powder)
1,726
2,376
1,933
-18.6
2701.12
Bituminous coal, whether
or not pulverized, but not agglomerated
324
1,038
1,661
60.0
0802.11
Almonds, fresh or dried,
in shell
446
583
544
-6.8
2707.99
Oils and products of the
distillation of high temperature coal tar, n.e.s.o.i.; similar products which
have a predominate (wt.) aromatic constituent, n.e.s.o.i.
206
305
435
42.7
2901.10
Acyclic hydrocarbons,
saturated
10
233
384
64.9
2711.11
Natural gas, liquefied
104
103
352
243.4
5201.00
Cotton, not carded or
combed
251
435
329
-24.2
8517.62
Machines for the
reception, conversion and transmission or regeneration of voice, images or
other data, including switching and routing apparatus
287
315
305
-3.4
7602.00
Aluminum waste and scrap
81
110
304
175.2
7106.91
Silver, unwrought
n.e.s.o.i. (other than powder)
36
29
283
889.0
4707.10
Waste and scrap of
unbleached kraft paper or paperboard or of corrugated paper or paperboard
152
208
269
29.4
2713.11
Petroleum coke, not
calcined
368
465
255
-45.2
Total of items shown
9,758
12,327
17,924
45.4
All other HTS subheadings
11,878
13,362
15,196
13.7
Total of all commodities
21,636
25,689
33,120
28.9
Source: USITC DataWeb/USDOC (accessed
May 9, 2019).
Note: Data reflect shipments under
HTS chapters 1–97. Because of rounding, figures may not add up to totals shown.
N.e.s.o.i. = not elsewhere specified or included.
Table
A.66
Leading U.S. general
imports from India, by HTS 6-digit subheading, 2016–18
HTS 6
Description
2016
2017
2018
% change 2017–18
Million $
7102.39
Diamonds, nonindustrial,
worked, including polished or drilled
8,619
8,191
9,085
10.9
3004.90
Medicaments, in measured
doses, etc. (excluding vaccines, etc., coated bandages etc., and
pharmaceutical goods), n.e.s.o.i.
6,398
5,129
5,270
2.8
0306.17
Shrimps and prawns,
frozen, other than cold-water
1,394
1,972
1,990
0.9
2710.12
Light oils and
preparations containing 70% by weight petroleum oils or oils from bituminous
minerals, not containing biodiesel, not waste oils
1,501
1,467
1,754
19.6
7113.19
Jewelry and parts thereof,
of precious metal other than silver
1,507
1,432
1,503
5.0
2710.19
Petroleum oils, oils from
bituminous minerals (other than crude) & products containing by weight
70% or more of these oils, not biodiesel or waste
845
878
1,058
20.5
6302.31
Bed linen (other than
printed) of cotton, not knitted or crocheted
789
825
789
-4.3
6302.60
Toilet and kitchen linen
of cotton terry toweling or similar cotton terry fabrics
698
729
731
0.3
8703.23
Passenger motor vehicles
with spark-ignition internal combustion reciprocating piston engine, cylinder
capacity over 1,500 cc but not over 3,000 cc
0
66
697
953.0
6110.20
Sweaters, pullovers,
sweatshirts, vests and similar articles of cotton, knitted or crocheted
406
428
452
5.7
8703.21
Passenger motor vehicles
with spark-ignition internal combustion reciprocating piston engine, cylinder
capacity not over 1,000 cc
0
46
450
884.4
3004.20
Medicaments, in measured
doses, etc., containing antibiotics, n.e.s.o.i.
420
385
421
9.4
1302.32
Mucilages and thickeners,
whether or not modified, derived from locust beans, locust bean seeds or guar
seeds
178
335
326
-2.8
7113.11
Jewelry and parts thereof,
of silver
320
342
313
-8.6
8708.99
Parts and accessories for
motor vehicles, n.e.s.o.i.
190
238
307
29.0
Total of items shown
23,266
22,464
25,149
11.9
All other HTS subheadings
22,717
25,833
28,858
11.7
Total of all commodities
45,983
48,297
54,007
11.8
Source: USITC DataWeb/USDOC (accessed
May 9, 2019).
Note: Data reflect shipments under HTS
chapters 1–97. Because of rounding, figures may not add up to totals shown.
N.e.s.o.i. = not elsewhere specified or included; cc = cubic centimeters.
Table
A.67
U.S. private services exports to India, by category, 2016–18
Type of service
2016
2017
2018
% change 2017-18
Million $
Travel (Business,
Personal)
12,093
13,349
14,407
7.9
Charges for IP Use
2,512
3,481
3,446
-1.0
Transport (Sea, Air,
Other)
1,673
1,720
1,811
5.3
Other business services
1,358
1,400
1,473
5.2
Telecommunications,
computer, and information services
1,155
1,322
1,295
-2.0
Financial Services
879
1,001
1,233
23.2
Maintenance and repair
services
369
656
837
27.6
Insurance Services
134
366
268
-26.8
Total
20,173
23,295
24,769
6.3
Source: USDOC, BEA, U.S.
International Transactions, Services, & IIP, International Transactions, tables
3.1 and 3.2, June 20, 2019.
Notes: Data for 2018 are preliminary.
Table
A.68
U.S. private services imports from India, by category, 2016–18
Type of service
2016
2017
2018
% change 2017-18
Million $
Telecommunications,
computer, and information services
14,605
15,201
15,335
0.9
Other business services
6,693
7,549
8,483
12.4
Travel (Business,
Personal)
3,220
3,241
3,262
0.6
Charges for IP Use
380
781
1,227
57.1
Transport (Sea, Air,
Other)
558
620
650
4.8
Financial Services
543
602
473
-21.4
Insurance Services
82
68
81
19.1
Maintenance and repair
services
48
23
19
-17.4
Total
26,129
28,086
29,530
5.1
Source: USDOC, BEA, U.S.
International Transactions, Services, & IIP, International Transactions, tables
3.1 and 3.2, June 20, 2019.
Notes: Data for 2018 are preliminary.
Table
A.69
U.S. total exports to Taiwan, by USITC digest sector, 2016–18
Sector
Description
2016
2017
2018
% change 2017–18
Million $
1
Agricultural products
3,318
3,396
4,015
18.2
2
Forest products
424
415
507
22.1
3
Chemicals and related
products
3,556
3,718
4,176
12.3
4
Energy-related products
135
776
3,833
394.0
5
Textiles and apparel
102
116
94
-19.3
6
Footwear
8
9
5
-38.3
7
Minerals and metals
1,268
1,343
1,762
31.2
8
Machinery
5,531
5,060
4,710
-6.9
9
Transportation equipment
3,744
3,653
3,502
-4.1
10
Electronic products
6,605
6,354
6,679
5.1
11
Miscellaneous manufactures
866
363
346
-4.6
12
Special provisions
478
526
613
16.6
Total
26,034
25,730
30,243
17.5
Source:
USITC DataWeb/USDOC (accessed May 9, 2019).
Note: Because of rounding, figures may not add up to
totals shown.
Table
A.70
U.S. general imports from Taiwan, by USITC digest sector, 2016–18
Sector
Description
2016
2017
2018
% change 2017–18
Million $
1
Agricultural products
531
587
580
-1.2
2
Forest products
243
262
274
4.7
3
Chemicals and related
products
3,561
4,015
4,188
4.3
4
Energy-related products
96
143
303
112.4
5
Textiles and apparel
1,037
1,003
970
-3.3
6
Footwear
85
55
47
-14.0
7
Minerals and metals
5,130
5,856
6,397
9.2
8
Machinery
4,125
4,612
5,128
11.2
9
Transportation equipment
3,396
3,552
3,743
5.4
10
Electronic products
16,435
17,625
18,980
7.7
11
Miscellaneous manufactures
3,041
3,144
3,275
4.1
12
Special provisions
1,563
1,608
1,877
16.8
Total
39,241
42,462
45,761
7.8
Source: USITC DataWeb/USDOC (accessed
May 9, 2019).
Note: Because of rounding, figures may
not add up to totals shown.
Table
A.71
Leading U.S. total
exports to Taiwan, by HTS 6-digit subheading, 2016–18
HTS 6
Description
2016
2017
2018
% change 2017–18
Million $
2709.00
Petroleum oils and oils
from bituminous minerals, crude
0
329
3,049
826.0
8800.00
Civilian aircraft,
engines, and parts
2,937
2,509
2,149
-14.4
8486.20
Machines and apparatus for
the manufacture of semiconductor devices or of electronic integrates circuits
2,747
2,432
1,797
-26.1
8542.31
Processors and
controllers, electronic integrated circuits
1,557
1,133
1,129
-0.3
8542.32
Memories, electronic
integrated circuits
1,047
1,078
1,031
-4.3
1201.90
Soybeans, other than seed
580
586
830
41.7
8486.90
Machines and apparatus of
a kind used for the manufacture of semiconductor boules or wafers, etc.,
parts and accessories
621
816
814
-0.2
8542.39
Electronic integrated
circuits, n.e.s.o.i.
657
711
788
10.8
1005.90
Corn (maize), other than
seed corn
460
396
595
50.2
7204.49
Ferrous waste and scrap,
n.e.s.o.i.
280
329
554
68.2
2710.12
Light oils and
preparations containing 70% by weight petroleum oils or oils from bituminous
minerals, not containing biodiesel, not waste oils
33
306
397
29.8
8517.62
Machines for the
reception, conversion and transmission or regeneration of voice, images or
other data, including switching and routing apparatus
433
212
340
60.5
0201.30
Meat of bovine animals,
boneless, fresh or chilled
186
217
294
35.3
1001.99
Wheat and meslin, not
durum wheat, other than seed
257
296
267
-9.7
8802.12
Helicopters of an unladen
weight exceeding 2,000 kg
0
173
250
44.4
Total of items shown
11,795
11,524
14,285
24.0
All other HTS subheadings
14,239
14,206
15,957
12.3
Total of all commodities
26,034
25,730
30,243
17.5
Source: USITC DataWeb/USDOC (accessed
May 9, 2019).
Note: Data reflect shipments under
HTS chapters 1–97. Because of rounding, figures may not add up to totals shown.
N.e.s.o.i. = not elsewhere specified or included.
Table
A.72
Leading U.S. general
imports from Taiwan, by HTS 6-digit subheading, 2016–18
HTS 6
Description
2016
2017
2018
% change 2017–18
Million $
8473.30
Parts and accessories for
automatic data processing machines and units thereof, magnetic or optical
readers, transcribing machines, etc., n.e.s.o.i.
1,248
1,387
2,273
63.8
8542.39
Electronic integrated
circuits, n.e.s.o.i.
1,462
1,640
1,826
11.3
8517.62
Machines for the
reception, conversion and transmission or regeneration of voice, images or
other data, including switching and routing apparatus
Processors and
controllers, electronic integrated circuits
1,206
1,418
1,364
-3.8
9801.00
Imports of articles
exported and returned, not advanced in value or condition; imports of animals
exported and returned within 8 months
902
954
1,162
21.8
8471.30
Portable digital automatic
data processing machines, weight not more than 10 kg, consisting of at least
a central processing unit, keyboard & a display
679
1,261
1,081
-14.2
8542.32
Memories, electronic
integrated circuits
689
723
854
18.0
8471.50
Digital processing units
other than those of 8471.41 and 8471.49, n.e.s.o.i.
210
450
725
61.1
7318.14
Self-tapping screws,
threaded, of iron or steel
505
583
682
17.1
8512.20
Electrical lighting or
visual signaling equipment, for use on cycles or motor vehicles, except for
use on bicycles
587
633
667
5.3
9999.95
Estimated imports of low
valued transactions
526
542
596
10.0
7318.15
Threaded screws and bolts
n.e.s.o.i., with or without their nuts or washers, of iron or steel
445
497
585
17.6
8525.80
Television cameras,
digital cameras and video camera recorders
608
523
546
4.3
Total of items shown
11,677
13,421
15,504
15.5
All other products
27,564
29,040
30,258
4.2
Total of all commodities
39,241
42,462
45,761
7.8
Source: USITC DataWeb/USDOC (accessed
May 9, 2019).
Note: Data reflect shipments under HTS
chapters 1–97. Because of rounding, figures may not add up to totals shown.
N.e.s.o.i. = not elsewhere specified or included; adp = automatic data
processing.
Table
A.73
U.S. private services exports to Taiwan, by category, 2016–18
Type of service
2016
2017
2018
% change 2017-18
Million $
Transport (Sea, Air,
Other)
2,140
2,284
2,386
4.5
Travel (Business,
Personal)
2,235
2,205
2,188
-0.8
Charges for IP Use
4,435
2,790
2,104
-24.6
Maintenance and repair services
952
532
1,233
131.8
Other business services
638
687
798
16.2
Financial Services
620
569
589
3.5
Telecommunications,
computer, and information services
122
192
196
2.1
Insurance Services
60
104
98
-5.8
Total
11,202
9,363
9,593
2.5
Source: USDOC, BEA, U.S.
International Transactions, Services, & IIP, International Transactions, tables
3.1 and 3.2, June 20, 2019.
Notes: Data for 2018 are preliminary.
Table
A.74
U.S. private services imports from Taiwan, by category, 2016–18
Type of service
2016
2017
2018
% change 2017-18
Million $
Transport (Sea, Air,
Other)
5,059
5,385
5,722
6.3
Travel (Business,
Personal)
1,361
1,364
1,264
-7.3
Other business services
918
801
829
3.5
Financial Services
136
206
222
7.8
Maintenance and repair
services
49
35
64
82.9
Telecommunications,
computer, and information services
49
55
62
12.7
Charges for IP Use
70
112
43
-61.6
Insurance Services
9
10
14
40.0
Total
7,651
7,968
8,220
3.2
Source: USDOC, BEA, U.S.
International Transactions, Services, & IIP, International Transactions, tables
3.1 and 3.2, June 20, 2019.
Table
B.2
U.S. goods and services trade with major bilateral
trade partners, 2018 (million dollars)
Country/region
Goods
Services
Exports
Imports
Total
Exports
Imports
Total
European Union
320,183
489,780
809,963
251,824
198,621
450,445
China
120,829
540,431
661,260
56,710
18,261
74,971
Canada
300,458
325,017
625,475
63,648
35,635
99,283
Mexico
265,998
352,583
618,581
33,374
25,664
59,038
Japan
75,959
144,410
220,369
44,422
30,397
74,819
South Korea
57,617
75,011
132,628
21,902
9,871
31,773
India
33,567
54,461
88,028
24,769
29,530
54,299
Taiwan
31,275
45,794
77,069
9,593
8,220
17,813
Source: USITC DataWeb/USDOC (accessed
June 28, 2018); BEA, Interactive data International Transactions, Services
& IIP, International Transactions, Table 1.2 and 1.3, June 28, 2019.
Table
B.7
U.S. private cross-border services trade with
selected major trading partners and the world, 2014–18 (billion dollars)
Country/region
Trade flow
2014
2015
2016
2017
2018
European Union
Exports
220.7
227.8
233.8
242.9
251.8
Imports
160.7
166.5
(
a
)179.6
(
a
)192.6
(
a
)198.6
Services trade balance
59.9
61.3
54.2
50.3
53.2
China
Exports
43.9
48.5
53.9
55.6
56.7
Imports
13.9
14.9
16.1
17.3
18.3
Services trade balance
29.9
33.6
37.8
38.2
38.4
Canada
Exports
60.6
54.3
54.0
57.8
63.6
Imports
29.8
29.0
30.4
32.9
35.6
Services trade balance
30.8
25.4
23.6
24.9
28.0
Mexico
Exports
29.8
31.0
30.9
32.1
33.4
Imports
19.8
22.8
24.0
25.4
25.7
Services trade balance
10.0
8.3
6.9
6.7
7.7
Japan
Exports
46.2
44.8
44.4
45.2
44.4
Imports
28.2
26.1
27.7
29.0
30.4
Services trade balance
18.0
18.7
16.7
16.2
14.0
South Korea
Exports
20.0
20.6
21.4
23.5
21.9
Imports
8.2
8.7
8.8
9.2
9.9
Services trade balance
11.7
11.9
12.7
14.3
12.0
India
Exports
14.9
18.1
20.2
23.3
24.8
Imports
22.4
24.6
26.1
28.1
29.5
Services trade balance
-7.5
-6.5
-6.0
-4.8
-4.8
Taiwan
Exports
12.0
11.9
11.2
9.4
9.6
Imports
7.2
7.6
7.7
8.0
8.2
Services trade balance
4.7
4.3
3.6
1.4
1.4
World
Exports
721.4
735.2
739.7
779.3
805.7
Imports
456.5
470.4
490.1
521.8
544.3
Services trade balance
264.9
264.8
249.5
257.5
261.4
Source: USDOC, BEA, Interactive data,
International Transactions, Services, & IIP, International Transactions,
“Table 1.2 U.S. International Trade in Services,” and “Table 1.3 U.S.
International Transactions,” expanded detail by area and country, June 28,
2019.
a
Services imports from the EU for 2016–18 are overstated because the data
include government goods and services not included elsewhere (n.i.e.).
Table
B.8
U.S. private cross-border services trade with major
trading partners and the world, 2018
Major trading partner
U.S. exports (billion $)
U.S. imports (billion $)
Share of total exports (%)
Share of total imports (%)
European Union
251,824
(
a
)198,621
31.3
36.5
Canada
63,648
35,635
7.9
6.5
China
56,710
18,261
7.0
3.4
Japan
44,422
30,397
5.5
5.6
Mexico
33,374
25,664
4.1
4.7
Brazil
26,709
6,239
3.3
1.1
South Korea
21,902
9,871
2.7
1.8
India
24,769
29,530
3.1
5.4
Australia
21,610
7,779
2.7
1.4
All others
260,777
182,350
32.4
33.5
World
805,745
544,347
100.0
100.0
Source: USDOC BEA, Interactive data,
International Transactions, Services, & IIP, International Transactions,
“Table 1.2 U.S. International Trade in Services,” and “Table 1.3 U.S.
International Transactions,“ June 28, 2019.
Note: Because of rounding, figures
may not add up to 100 percent. Data are preliminary. Corresponds to figures
1.8
,
1.9
.
a
Services imports from the EU for 2016–2018 are overstated because the data
include government goods and services not included elsewhere (n.i.e.).
Table
B.9
Products at issue in active section 337 investigation
proceedings, 2018
[1]
The eight major U.S. trading partners discussed in this report are the European
Union, China, Canada, Mexico, Japan, the Republic of Korea (South Korea), India,
and Taiwan.
[2]
These merchandise sectors are defined by the U.S. International Trade Commission
(USITC) in the
Harmonized
Tariff Schedule
of the United States
(HTS), which classifies tradable goods. Each USITC digest sector encompasses a
number of 8-digit subheadings.
The sectors are listed and defined in
USITC, “
Frequently
Asked Questions
,”
Shifts
in U.S. Merchandise Trade, 2016
, September 2017. “Special provisions”
is not considered a merchandise sector; it represents trade under HTS chapters
98 and 99.
[3]
Exec. Order No. 11846 of March 27, 1975, Administration of the Trade Agreements
Program, 40 Fed. Reg. 14291, 3 C.F.R., 1971–1975 Comp., 971.
[4]
Section 163(a)(2) of the Trade Act of 1974 states that the President’s report
is to cover the following: “(A) new trade negotiations; (B) changes made in
duties and nontariff barriers and other distortions of trade of the United
States; (C) reciprocal concessions obtained; (D) changes in trade agreements (including
the incorporation therein of actions taken for import relief and compensation
provided therefor); (E) the extension or withdrawal of nondiscriminatory
treatment by the United States with respect to the products of foreign
countries; (F) the extension, modification, withdrawal, suspension, or
limitation of preferential treatment to exports of developing countries; (G)
the results of actions to obtain the removal of foreign trade restrictions
(including discriminatory restrictions) against United States exports and the
removal of foreign practices which discriminate against United States service
industries (including transportation and tourism) and investment; (H) the
measures being taken to seek the removal of other significant foreign import
restrictions; (I) each of the referrals made under section 2171(d)(1)(B) of
this title and any action taken with respect to such referral; and (J) other
information relating to the trade agreements program and to the agreements
entered into thereunder.”
[5]
“Total exports” measures the total physical movement of goods out of the United
States to foreign countries, whether such goods are exported from the U.S.
customs territory or from a U.S. Customs bonded warehouse or a U.S. foreign
trade zone. Total exports is the sum of domestic exports and “foreign exports”
(also known as re-exports). “General imports” measures the total physical
arrivals of merchandise from foreign countries, whether such merchandise enters
the U.S. customs territory immediately or is entered into bonded warehouses or
foreign trade zones under U.S. Customs custody. These two measures—total
exports and general imports—are the broadest measures of U.S. merchandise trade
reported by the U.S. Census Bureau and they are used by the Bureau of Economic
Analysis with adjustments to report on U.S. trade flows in official government
balance of payment statistics. These are also the measures most commonly used
internationally.
[6]
For more information about measures of U.S. merchandise exports and imports,
see the “Trade Measure Definitions” section of USITC,
Shifts
in U.S. Merchandise Trade, 2015
, September 2016.
[7]
Due to annual data revisions, data
obtained from DataWeb may not always match the data presented in this report,
even when these data are queried in the same year that the report is published.
[9]
Real GDP is a measure of the value of the goods and services produced by the
nation’s economy less the value of the goods and services used up in
production, adjusted for price changes.
[16]
IMF,
World
Economic Outlook
, January 2019, 157. Two events in September
2018—Typhoon Jebi, the strongest typhoon to hit Japan in 25 years, and a severe
earthquake in Hokkaido—noticeably affected Japanese economic activity. The
infrastructure damage and power outages that resulted from these events
affected nuclear energy production, production and trade in several key
industrial sectors, and tourism.
BBC News
,
“
Japan’s Strongest
Typhoon in 25 Years
,” September 5, 2018;
BBC
News
, “
Fears
Grow for Japan Quake Survivors
,” September 7, 2018; EIU, “
Country
Report, Japan
,” October 2018, 28; EIU, “
Country
Report, Japan
,” November 2018, 33.
[20]
The IMF divides the world into two groups: advanced and emerging economies.
There are 39 advanced economies and 154 emerging economies. Both groups are
listed in IMF,
World
Economic Outlook
, April 2019, 136–37.
[22]
The broad dollar index is a weighted average of the foreign exchange values of
the U.S. dollar against the currencies of a large group of major U.S. trading
partners. In this study, dollar appreciation is measured as the increase in the
broad dollar index from January 2, 2018, to December 31, 2018. Federal Reserve
System, “
Real Trade
Weighted U.S. Dollar Index: Broad
” (accessed June 7, 2019).
[27]
USITC DataWeb/USDOC (accessed April 22, 2019).
[28]
USITC DataWeb/USDOC (accessed April 22, 2019).
[29]
These merchandise sectors are defined by the Commission. Each USITC digest
sector encompasses a number of 8-digit subheadings in the
Harmonized Tariff Schedule of
the United States
(HTS),
which
classifies tradable goods.
The sectors are listed and defined in
USITC, “
Frequently
Asked Questions
,”
Shifts
in U.S. Merchandise Trade, 2016
, September 2017. “Special provisions”
is not considered a merchandise sector; it represents trade under HTS chapters
98 and 99. Exports in this category primarily represent goods that have been
returned with no value added abroad and articles that have been repaired. Imports
in this category primarily represent goods that have been returned with no
value added abroad, goods that have been repaired, and low-value imports.
[30]
Crude petroleum is classified under HTS 2709.00.
[32]
EIA, “
Short-Term
Energy Outlook
- June 2019
” (accessed July
8, 2019). The United States surpassed Russia as the world’s leading crude
petroleum producer in August 2018, maintaining this position for the rest of
the year. Also, increased production has drawn more investment in U.S. energy
infrastructure, improving U.S. capacity to export both crude petroleum and
natural gas. EIA, “
U.S. Monthly Crude
Oil Production
,” November 1, 2018; EIA,
Short-Term
Energy Outlook—July 2019
, July 9, 2019, 9.
[35]
The Brent benchmark (a reference price for buyers and sellers of crude oil
worldwide based on Brent Crude, a major trading classification of sweet light
crude oil) increased from an average of $54.12 to $71.34 per barrel (31.8
percent) from 2017 to 2018. EIA, “
Spot Prices
”
(accessed May 29, 2019).
[36]
Crude petroleum exports have been rapidly rising from a relatively low base.
The low base is a result of a 40-year U.S. government ban on most exports of
crude petroleum to countries other than Canada. This ban was lifted in December
2015.
[37]
These merchandise sectors are defined by the Commission. Each USITC digest
sector encompasses a number of 8-digit subheadings in the
Harmonized Tariff Schedule
of the United State
s
(HTS
),
which classifies tradable goods.
The sectors are listed and defined
in USITC, “
Frequently
Asked Questions
,”
Shifts
in U.S. Merchandise Trade, 2016
, September 2017. “Special provisions”
is not considered a merchandise sector; it represents trade under HTS chapters
98 and 99. Exports in this category primarily represent low-value goods and
articles that have been repaired.
[38]
USITC DataWeb/USDOC (accessed April 22, 2019). “Passenger motor vehicles”
includes the following 15 HTS 6-digit lines: 8703.21, 8703.22, 8703.23,
8703.24, 8703.31, 8703.32, 8703.33, 8703.40, 8703.50, 8703.60, 8703.70,
8703.80. 8703.90, 8704.21, and 8704.31.
[39]
USITC DataWeb/USDOC (accessed April 22, 2019). “Passenger motor vehicles”
includes the following 15 HTS 6-digit lines: 8703.21, 8703.22, 8703.23,
8703.24, 8703.31, 8703.32, 8703.33, 8703.40, 8703.50, 8703.60, 8703.70,
8703.80. 8703.90, 8704.21, and 8704.31.
[40]
The category “Special Provisions” represents trade under HTS chapters 98 and
99. Imports in this category primarily represent goods that have been returned
with no value added abroad, goods that have been repaired, and low-value
imports.
[41]
Crude petroleum is classified under HTS 2709.00.
[42]
For U.S. trade with the top 15 single-country U.S. trading partners, including
the EU member states listed separately, see appendix tables A.5–A.7.
[43]
U.S. trade with its FTA partners is discussed in chapter 5.
[44]
Imports for consumption (sometimes called “special imports”) are merchandise
that has physically cleared through Customs, either entering consumption
channels immediately or entering for consumption after withdrawal from bonded
warehouses or FTZs under Customs custody. For more information about measures
of U.S. merchandise exports and imports, see the “Trade Measure Definitions”
section of USITC,
Shifts
in U.S. Merchandise Trade, 2015
, September 2016.
[45]
U.S. imports under preferential trade programs are discussed in chapter 2.
[46]
USDOC, BEA, International Transactions data, “Table 3.1. U.S. International
Trade in Services,” June 20, 2019. These data represent U.S. cross-border trade
in private services, which exclude data on imports and exports of government
goods and services and which roughly correspond to modes 1, 2, and 4
(cross-border trade, consumption abroad, and the presence of natural persons)
in the “modes of supply” framework for services trade set out by the General
Agreement on Trade in Services (GATS). BEA data on foreign affiliate
transactions, which roughly correspond to mode 3 (commercial presence). Data on
mode 3 transactions are published with a two-year lag, and are not covered in
this report. For more information on the four modes of supply under GATS, see
WTO, “
Basic
Purpose and Concepts
” (accessed May 10, 2019). See also the Commission’s
annual
Recent Trends in U.S. Services Trade
report series, which covers
all four modes of supply for U.S. cross-border services trade.
[48]
Appendix tables A.8 and A.9 provide additional data on U.S. cross-border trade
in private services, broken down by product category.
[49]
Travel services comprise purchases of goods and services by U.S. residents
traveling abroad (U.S. imports of travel services) and by foreign travelers in
the United States (U.S. exports of travel services). These goods and services
include food, lodging, recreation, gifts, entertainment, local transportation
in the country of travel, and other items incidental to business or personal
travel by a foreign visitor USDOC, BEA, “
U.S.
International Trade in Goods and Services, March 2019: Additional Information,
Explanatory Notes
,”
May 9, 2019.
[53]
According to BEA, research and development includes “work aimed at discovering
new knowledge or developing new or significantly improved goods and services.”
This category includes both commercial and noncommercial product development,
as well as several types of fees: fees associated with the development of
intellectual property protected by patents, trademarks, or copyrights; fees for
the development of general-use software; and fees for testing related to
product development. These services are traded by providing research services
to foreign clients. USDOC, BEA, “
Quarterly
Survey of Transactions
,” October 2018, 24.
[55]
This reduction in imports was in large part driven by the reinsurance sector,
and likely can be attributed to a change in how firms operate in response to
the Tax Cuts and Jobs Act of 2017, which increased the cost of offshore
affiliated reinsurance arrangements. Hough et al.,
Impact
of US Tax Reform on Insurance Companies
, February 20, 2018.
[57]
Data on U.S. services imports from the EU include government goods and services
not included elsewhere. According to BEA, trade data from EU-based government
services providers are “suppressed to avoid the disclosure of data of
individual companies.” USDOC, BEA, International Services Data, “Table 2.3,
U.S. Trade in Services, by Country or Affiliation and by Type of Service,
European Union,” September 12, 2019. Exports and imports of government services
primarily consist of services supplied in support of operations by the U.S.
military and embassies abroad. USITC,
Recent
Trends in U.S. Services Trade, 2018 Annual Report
, June 2018, 12.
[58]
The United States also registers a services trade deficit with Italy, which is
a member state of the EU. Among single-country trading partners, Italy ranked
as the United States’ 15th-largest services trading partner in 2018. This
deficit with Italy is driven by U.S. tourist travel to Italy. USDOC, BEA,
International Services Data, “Table 2.3, U.S. Trade in Services, by Country or
Affiliation and by Type of Service, Italy,” October 18, 2018.
[59]
USDOC, BEA, International Services Data, “Table 2.3, U.S. Trade in Services, by
Country or Affiliation and by Type of Service, India,” October 18, 2018.
[60]
The President’s authority to provide preferential treatment under the Andean
Trade Preference Act, as amended by the Andean Trade Promotion and Drug
Eradication Act, expired in 2013 and had not been renewed as of July 2019.
[61]
19 U.S.C. §§ 2251–2254.
Under the section 201 of the Trade Act
of 1974, if the Commission determines that an article is being imported into
the United States in such increased quantities as to be a substantial cause of
serious injury or threat of serious injury to a domestic industry producing a
like or directly competitive product, it recommends to the President relief
that would remedy the injury and facilitate industry adjustment to import
competition. The President makes the final decision concerning whether to
provide relief and the type and duration of relief. Relief is temporary and for
the purpose of providing time for the industry to adjust to import competition.
Relief may take the form of increased tariffs, tariff-rate quotas, quotas,
adjustment measures (including trade adjustment assistance), and negotiation of
agreements with foreign countries. In making its determination, the Commission
is not required to find an unfair trade practice. USITC, “
Global
and Special Safeguard Investigations
” (accessed August 14, 2019).
[63]
USITC,
Large
Residential Washers
, December 2017. For more information, including a
detailed description of the imported article, see the Commission’s notice of
investigation and hearing published in the
Federal Register
of June
13, 2017 (82 Fed. Reg. 27075).
[64]
Proclamation 9693, published in the
Federal Register
of January 25,
2018 (83 Fed. Reg. 3541).
[65]
Proclamation 9694, published in the
Federal Register
of January 25,
2018 (83 Fed. Reg. 3553). On February 15, 2019, the Commission issued a notice
announcing that it had initiated an investigation to prepare the midterm report
to the President and the Congress required by section 204(a)(2) of the Trade
Act of 1974 on its monitoring of developments in the domestic industry
following the President’s action on washers and washer parts. Notice of the
investigation—Investigation No. TA-204-013,
Large Residential Washers:
Monitoring Developments in the Domestic Industry
—was published in the
Federal
Register
of February 22, 2019 (84 Fed. Reg. 5715).
[66]
The petition in
CSPV Cells
was filed by Suniva Inc., and the firm
SolarWorld later joined Suniva as co-petitioner. The petition in
Large
Residential Washers
was filed by Whirlpool Corporation.
[67]
Section 301 refers to sections 301–310 of the Trade Act of 1974, as amended (19
U.S.C. §§ 2411–2420).
[68]
Section 301(a) of the Trade Act of 1974, as amended (19 U.S.C. § 2411(a)).
[69]
Section 301(b) of the Trade Act of 1974, as amended (19 U.S.C. § 2411(b)).
[70]
Ad valorem duties or tariffs are taxes that are levied as a percentage of the
value of the imported goods.
[72]
Memorandum of Understanding between the United States of America and the
European Commission Regarding the Importation of Beef from Animals Not Treated
with Certain Growth-Promoting Hormones and Increased Duties Applied by the
United States to Certain Products of the European Communities,
May 13,
2009.
[73]
A tariff-rate quota (TRQ) is a trade restriction that typically imposes a
relatively low “in-quota” tariff on imports until the quota level (sometimes an
annual allocation) is met. Any imports beyond the quota level are subject to a
higher over-quota tariff.
[74]
Article VI of the U.S.-EU Beef MOU defines “high-quality beef.” All beef sold
in the EU, including high-quality beef imports, must be produced without the
use of growth-promoting hormones. U.S.-EU Beef MOU, Art. II(1).
[95]
83 Fed. Reg. 47974 (September 21, 2018) and 83 Fed. Reg. 65198 (December 19,
2018), as cited in USTR,
2019
Trade Policy Agenda and 2018 Annual Report
, March 2019, 43–44.
Imposition of this additional duty was subsequently deferred several times, and
as of early July 2019 it had not been imposed.
[97]
The Special 301 law is set forth in section 182 of the Trade Act of 1974, as
amended (19 U.S.C. § 2242).
[98]
“Persons who rely on IPR protection” means persons involved in “(A) the
creation, production or licensing of works of authorship . . . that are
copyrighted, or (B) the manufacture of products that are patented or for which
there are process patents.” Section 182(d)(1) of the Trade Act of 1974, as
amended (19 U.S.C. § 2242(d)(1)).
[99]
A “mask work” is a “series of related images, however fixed or encoded—(A)
having or representing the predetermined, three-dimensional pattern of
metallic, insulating, or semiconductor material present or removed from the
layers of a semiconductor chip product; and (B) in which series the relation of
the images to one another is that each image has the pattern of the surface of
one form of the semiconductor chip product.” Section 182(d)(2) of the Trade Act
of 1974, as amended (19 U.S.C. § 2242(d)(2)). Section 901(a)(2) of the
Semiconductor Chip Protection Act (17 U.S.C. § 901(a)(2)) defines “mask work.”
[100]
Section 182(d)(3) of the Trade Act of 1974, as amended (19 U.S.C. §
2242(d)(3)).
[101]
Section 182(d)(4) of the Trade Act of 1974, as amended (19 U.S.C. §
2242(d)(4)).
[102]
Section 182(a)(2) of the Trade Act of 1974, as amended (19 U.S.C. §
2242(a)(2)).
[103]
Section 182(b)(1) of the Trade Act of 1974, as amended (19 U.S.C. §
2242(b)(1)).
[104]
Section 302(b)(2)(A) of the Trade Act of 1974, as amended (19 U.S.C. §
2412(b)(2)(A)).
[105]
Section 302(b)(2)(B) of the Trade Act of 1974, as amended (19 U.S.C. §
2412(b)(2)(B)).
[111]
The countries on the 2018 watch list are Barbados, Bolivia, Brazil, Costa Rica,
the Dominican Republic, Ecuador, Egypt, Greece, Guatemala, Jamaica, Lebanon,
Mexico, Pakistan, Peru, Romania, Saudi Arabia, Switzerland, Tajikistan,
Thailand, Turkey, Turkmenistan, the United Arab Emirates, Uzbekistan, and
Vietnam. USTR,
2018
Special 301 Report
, April 2019, 9.
[112]
Section 306 of the Trade Act of 1974 requires USTR to monitor a trading
partner’s compliance with measures that are the basis for resolving an
investigation under Section 301. USTR may apply sanctions if a country fails to
implement such measures satisfactorily. USTR,
2018
Special 301 Report
, April 2019, 82.
[122]
19 U.S.C. § 1677b(c). Some examples of factors of production include hours of
labor required, quantity of raw materials employed, amount of energy and other
utilities consumed, and representative capital cost, including depreciation. 19
U.S.C. § 1677b(c)(3).
[126]
Data reported here and in the following two sections (“Countervailing Duty
Investigations” and “Reviews of Outstanding Antidumping and Countervailing Duty
Orders/Suspension Agreements”) reflect the total number of investigations. In
other Commission reports, these data are grouped by product because the same
investigative team and all of the parties participate in a single grouped
proceeding, and the Commission generally produces one report and issues one
opinion containing its separate determinations for each investigation.
[127]
An antidumping investigation may be suspended if exporters accounting for
substantially all of the imports of the merchandise under investigation agree
either to eliminate the dumping or to cease exports of the merchandise to the
United States within six months. In extraordinary circumstances, an
investigation may be suspended if exporters agree to revise prices to
completely eliminate the injurious effect of exports of the merchandise in
question to the United States. A suspended investigation is resumed, assuming
it was not continued after the suspension agreement was issued, if USDOC
determines that the suspension agreement has been violated. See 19 U.S.C. §
1673c.
[128]
A subsidy is defined as a financial benefit given by an authority (a government
of a country or any public entity within the territory of the country) to a
person, in which the authority either (1) provides a financial contribution,
(2) provides any form of income or price support within the meaning of Article
XVI of the General Agreement on Tariffs and Trade 1994, or (3) makes a payment
to a funding mechanism to provide a financial contribution, or entrusts or
directs a private entity to make a financial contribution, if providing the
contribution would normally be vested in the government and the practice does
not differ in substance from practices normally followed by governments. See 19
U.S.C. § 1677(5)(B).
[129]
A countervailing duty investigation may be suspended if the government of the
subsidizing country or exporters accounting for substantially all of the
imports of the merchandise under investigation agree to eliminate the subsidy,
to completely offset the net subsidy, or to cease exports of the merchandise to
the United States within six months. In extraordinary circumstances, an
investigation may be suspended if the government of the subsidizing country or
exporters agrees to completely eliminate the injurious effect of exports of the
merchandise in question to the United States. A suspended investigation is
resumed, assuming it had not previously been continued after issuance of the
suspension agreement, if USDOC determines that the suspension agreement has
been violated. See 19 U.S.C. § 1671c.
[133]
Two of these instituted reviews (Ammonium Nitrate from Ukraine and Low Enriched
Uranium from France) were subsequently terminated and the outstanding
antidumping duty orders revoked because the domestic industries did not request
that they be continued.
[134]
For detailed information on reviews instituted, as well as Commission action in
all reviews, see the Commission’s website section “Sunset Review Database” at
https://pubapps2.usitc.gov/sunset/
.
[135]
19 U.S.C. § 3538;
see also
the Statement of Administrative Action
submitted to Congress in connection with the Uruguay Round Agreements Act, 353.
[139]
Specifically, in the original dispute, the DSB found 19 U.S.C. §
1677(7)(G)(i)(III) to be WTO-inconsistent insofar as this provision requires
cross-cumulation of subsidized and non-subsidized imports when USDOC
self-initiates an antidumping (or countervailing duty) investigation on the
same day a petitioner files a countervailing duty (or antidumping) petition.
[140]
India submitted written arguments to the WTO panel in July 2018 and October
2018, while the United States submitted responding arguments in September 2018
and December 2018, respectively. The panel held substantive meetings with
India, the United States, and third parties on January 30 and 31, 2019.
[146]
Section 337 also applies to articles that are made, produced, processed, or
mined under, or by means of, a process covered by the claims of a valid and
enforceable United States patent. 19 U.S.C. § 1337(a)(1)(B)(ii).
[147]
Other unfair methods of competition and unfair acts have included common-law
trademark infringement, trademark dilution, trade dress infringement, false
advertising, false designation of origin, and antitrust violations. Unfair
practices that involve the importation of dumped or subsidized merchandise must
be pursued under antidumping or countervailing duty provisions, not under
section 337.
[149]
19 U.S.C. § 1337(j). Although the statute reserves the review for the
President, since 2005 this function has been officially delegated to the USTR.
70 Fed. Reg. 43251 (July 26, 2005).
[150]
Section 337 investigations at the Commission are conducted before an
administrative law judge (ALJ) in accordance with the Administrative Procedure
Act, 5 U.S.C. §§ 551 et seq. The ALJ conducts an evidentiary hearing and makes
an initial determination, which is transmitted to the Commission for review. If
the Commission finds a violation, it must determine the appropriate remedy, the
amount of any bond to be collected while its determination is under review by
USTR, and whether public-interest considerations preclude issuing a remedy.
[151]
A rescission proceeding is a proceeding to determine whether or not to rescind
a previously issued remedial order. A remand is a situation in which the U.S.
Court of Appeals for the Federal Circuit has directed the Commission to conduct
additional proceedings with respect to a previously concluded investigation.
[153]
USDOC, “Notice of Request for Public Comments and Public Hearing on Section 232
National Security Investigation of Imports of Automobiles, Including Cars,
SUVs, Vans and Light Trucks, and Automotive Parts,” 83 Fed. Reg. 24735 (May 30,
2018).
[154]
The Secretary transmitted his report to the President on February 17, 2019. On
May 17, 2019, the President issued Proclamation 9888 (84 Fed. Reg. 23433 (May
21, 2019)). The proclamation noted that the Secretary found that “automobiles
and certain automobile parts are being imported into the United States in such
quantities and under such circumstances as to threaten to impair the national
security of the United States.” It also noted that the Secretary found that
“these imports are ‘weakening our internal economy’ and that ‘[t]the
contraction of the American-owned automotive industry, if continued, will
significantly impede the United States’ ability to develop technologically
advanced products that are essential to our ability to maintain technological
superiority to meet defense requirements and cost effective global power
protection.’” The President concurred with the Secretary’s finding and
proclaimed the following:
(1) The Trade Representative,
in consultation with the Secretary, the Secretary of the Treasury, and any
other senior executive branch officials the Trade Representative deems
appropriate, shall pursue negotiation of agreements contemplated in 19 U.S.C.
1862(c)(3)(A)(i) to address the threatened impairment of the national security
with respect to imported automobiles and certain automobile parts from the
European Union, Japan, and any other country the Trade Representative deems
appropriate.
(2) The Trade Representative,
within 180 days, shall update [the President] on the outcome of the
negotiations directed under clause (1).
(3) The Secretary shall
continue to monitor imports of automobiles and certain automobile parts and
shall, from time to time, in consultation with any senior executive branch
officials the Secretary deems appropriate, review the status of such imports
with respect to the national security. The Secretary shall inform the President
of any further actions that . . . might indicate the need for further action
by the President under section 232.
(4) Any provision of previous
proclamations and Executive Orders that is inconsistent with the actions taken
in this proclamation is superseded to the extent of such inconsistency.
[155]
USDOC, Notice of Request for Public Comments on Section 232 National Security
Investigation on Imports of Uranium, 83 Fed. Reg. 35204 (July 25, 2018).
[156]
USDOC, Change in Comment Deadline for Section 232 National Security
Investigation on Imports of Uranium, 83 Fed. Reg. 45595 (Sept. 10, 2018).
[157]
On July 12, 2019, the President issued a memorandum stating that the Secretary
had transmitted his report to the President on April 14, 2019, and that the
Secretary had found and advised that uranium is being imported into the United
States in such quantities and under such circumstances as to threaten to impair
the nation security of the United States as defined under section 232 of the
Act. However, the President stated that he did not concur with the Secretary’s
finding that uranium imports threaten to impair the national security, and the
President found that “a fuller analysis of national security considerations
with respect to the entire nuclear fuel supply chain is necessary at this time.”
White House, “
Memorandum
on the Effect of Uranium
,” July 12, 2019.
[172]
Trade adjustment assistance (TAA) was first established by the Trade Expansion
Act of 1962 (Pub. L. 87-793) and subsequently expanded and reauthorized
numerous times. For more background on its history, see Guth and Lee, “
A
Brief History
,” January 2017. For recent history, see previous annual Year
in Trade reports, found at
https://www.usitc.gov/research_and_analysis/year_in_trade.htm
.
[173]
Pub. L. 114-27, sect. 403. TAARA of 2015 contains sunset provisions similar to
those in the Trade Adjustment Assistance Extension Act (TAAEA) of 2011, which
took effect in 2014. Beginning July 1, 2021, the TAA program is scheduled to
revert to a more limited set of eligibility and benefit provisions that are
similar to the Reversion 2014 provisions (e.g., services firms will no longer
be eligible for the program). These provisions are scheduled to remain in place
for one year; the authorization is set to expire after June 30, 2022, on which
date the program is scheduled to begin to be phased out. CRS,
Trade Adjustment Assistance
for Workers and the TAA Reauthorization Act of 2015
, August 14, 2018,
13.
[174]
The Trade Preferences Extension Act (TPEA) of 2015 reauthorized the TAA for
Farmers Program for FY 2015 through FY 2021.
[179]
Trade Readjustment Allowances (TRAs) provide income support to eligible workers
who participate in training. Reemployment TAA provides a wage supplement to
eligible workers age 50 or older when they accept new employment at a lower
wage. USDOL, ETA, “
TAA
Program Benefits and Services under the 2015 Amendments
” (accessed May 28,
2019).
[202]
CNLs do not apply to least-developed beneficiary developing countries (LDBDCs)
or to developing countries that are beneficiaries of the African Growth and
Opportunity Act.
[209]
In March 2019, USTR announced that the President decided to fully remove GSP
benefits for India based on its failure to provide equitable and reasonable
market access in numerous sectors. USTR, “
United
States Will Terminate GSP Designation of India and Turkey
,” March 4, 2019.
See also Presidential Proclamation 9902 of May 31, 2019.
[211]
83 Fed Reg. 40839 (August 16, 2018). On May 16, 2019, the President issued a
proclamation removing Turkey from the GSP program based on its level of
economic development. See Presidential Proclamation 9887 of May 16, 2019.
[212]
As defined by the GSP statute, a waiver may be given when total U.S. imports
from all countries of a given product are “de minimis” (a threshold value
beneath which an import is entered with no duty). Like the dollar-value CNLs,
the de minimis level is adjusted each year, in increments of $500,000. The de
minimis level in 2018 was $24 million.
[215]
President Trump added 23 luggage and travel goods to the list of products for
eligible for duty-free treatment under GSP for all beneficiary countries
following the 2016/17 GSP Annual Review. 82 Fed. Reg. 31793 (July 10, 2017).
President Obama designated certain luggage and travel goods as eligible for
duty-free treatment for LDBDCs and AGOA beneficiary countries on June 30, 2016.
81 Fed. Reg. 58547 (August 25, 2016).
[223]
USTR,
2019
Trade Policy Agenda and 2018 Annual Report
, March 2019, 37; 81 Fed.
Reg. 92499 (December 20, 2016). Nepal is an LDBDC under GSP. In 2018, it
imported products under 140 of the over 5,000 HTS 8-digit tariff lines under
which it is eligible to receive duty-free treatment under GSP.
[224]
The cost or value of the materials produced in either Nepal or the United
States, plus the direct cost of processing performed in Nepal or the United
States, must total at least 35 percent of the appraised customs value of the
product at the time of entry.
[226]
AGOA eligibility criteria are set forth in section 104 of AGOA (19 U.S.C. §
3703) and section 502 of the Trade Act of 1974 (19 U.S.C. § 2463). Countries
must be GSP eligible as well as AGOA eligible in order to receive AGOA’s trade
benefits.
[227]
The (non-apparel) rules of origin under GSP (and AGOA) are set forth in section
503 of the Trade Act of 1974 (19 U.S.C. § 2463 (a)(2)) and are reflected in HTS
general notes 4 and 16.
[228]
Section 111 (b) of AGOA (19 U.S.C. § 2463 (c)(2)(D)). The GSP program imposes
quantitative ceilings called competitive need limitations (CNLs) on GSP
benefits for all tariff items and beneficiary developing countries. Under
certain circumstances, these ceilings may be waived. U.S. Customs, “
Generalized
System of Preferences (GSP)
” (accessed May 20, 2019).
[229]
Section 113 of AGOA (19 U.S.C. § 3722). See HTS chapter 98, subchapter XIX, for
applicable provisions.
[230]
The Trade Preferences Extension Act of 2015 extended the expiration date of
AGOA from September 30, 2015, to September 30, 2025.
[231]
USTR,
2019
Trade Policy Agenda and 2018 Annual Report
, March 2019, 58–59. In 2018,
the following 40 sub-Saharan African (SSA) countries were designated as
beneficiary AGOA countries: Angola, Benin, Botswana, Burkina Faso, Cabo Verde,
Cameroon, Central African Republic, Chad, Comoros, Côte d’Ivoire, Djibouti,
Ethiopia, Eswatini (formerly Swaziland), Gabon, Gambia, Ghana, Guinea,
Guinea-Bissau, Kenya, Lesotho, Liberia, Madagascar, Malawi, Mali, Mauritania,
Mauritius, Mozambique, Namibia, Niger, Nigeria, Republic of the Congo, Rwanda,
São Tomé and Príncipe, Senegal, Sierra Leone, South Africa, Tanzania, Togo,
Uganda, and Zambia.
[232]
Twenty-eight SSA countries were eligible for AGOA textile and apparel benefits
for all or part of 2018. They included Benin, Botswana, Burkina Faso, Cameroon,
Cabo Verde, Chad, Côte d’Ivoire, Eswatini (formerly Swaziland), Ethiopia,
Ghana, Guinea, Kenya, Lesotho, Liberia, Madagascar, Malawi, Mauritius,
Mozambique, Namibia, Nigeria, Rwanda, Senegal, Sierra Leone, South Africa,
Tanzania, Togo, Uganda, and Zambia. AGOA benefits for Niger, Mali, and The
Gambia were reinstated in 2011, 2014, and 2018, respectively. However, textile
and apparel benefits will not be reinstated for any of these countries until
the country reapplies for its visa arrangement. Meanwhile, Eswatini’s apparel
benefits were reinstated on July 3, 2018, and Rwanda’s AGOA apparel benefits
were terminated on July 31, 2018. USDOC, OTEXA, “
Preferences:
Country Eligibility, Apparel Eligibility, and Textile Eligibility (Category 0
and Category 9)
” (accessed May 20, 2019).
[242]
Crude petroleum refers to products classified under HTS 2709.00. Passenger
motor vehicles here refers to products classified under HTS 8703.23.
[243]
USITC DataWeb/USDOC (accessed May 21, 2019).
[244]
USITC DataWeb/USDOC (accessed May 21, 2019).
[245]
The drop in exports from Angola under AGOA was driven by a drop in exports of
crude petroleum (HTS 2709.00) under AGOA. However, U.S. crude petroleum imports
for consumption from Angola increased overall between 2017 and 2018, as the
volume of U.S. crude petroleum imports entering under GSP for LDBDCs and under
no trade preference program grew over this time period.
[246]
USITC DataWeb/USDOC (accessed May 24, 3019). Apparel products refers to
products classified under HTS chapters 61 and 62; passenger motor vehicles here
refer to products classified under HTS 8703.23.
[253]
Textiles and apparel that were not subject to textile agreements in 1983 are
eligible for duty-free entry under the original CBERA provisions, which do not
have an expiration date. This category includes only textiles and apparel of
silk or non-cotton vegetable fibers, mainly linen and ramie. Textile and
apparel goods of cotton, wool, or manmade fibers (“original MFA goods”) are not
eligible under the original CBERA. “MFA” stands for the now-expired Multi-Fibre
Arrangement.
[254]
Normal trade relations (NTR) rates of duty, also known as most-favored-nation
rates (MFN), are accorded to countries having NTR status in the United States
and do not allow discrimination between trading partners.
[255]
Certain preferential treatment provisions have been extended to September 30,
2020. These provisions relate to import-sensitive textile and apparel articles
from CBERA countries and to textile and apparel articles imported under special
rules for Haiti (see section on Haiti below). The extension occurred on May 24,
2010, when the President signed the Haiti Economic Lift Program Act of 2010,
Pub. L. 111-171, § 3.
[256]
Antigua and Barbuda, Aruba, The Bahamas, Barbados, Belize, Curaçao, Dominica,
Grenada, Guyana, Haiti, Jamaica, Montserrat, Saint Kitts and Nevis, Saint
Lucia, Saint Vincent and the Grenadines, Trinidad and Tobago, and the British
Virgin Islands.
[257]
Barbados, Belize, Curaçao, Guyana, Haiti, Jamaica, Saint Lucia, and Trinidad
and Tobago.
[259]
77 Fed. Reg. 61816 (October 11, 2012); 75 Fed. Reg. 17198 (April 5, 2010).
Until 2010, Curaçao and Sint Maarten were members of the now-dissolved
Netherlands Antilles.
[261]
Pub. L. 109-432,
§
5001 et seq., the Haitian Hemispheric
Opportunity through Partnership Encouragement Act of 2006, 19 U.S.C.
§
2703a.
[262]
Pub. L. 110-234,
§
15401 et seq., the Haitian Hemispheric
Opportunity through Partnership Encouragement Act of 2008.
[263]
There were no U.S. imports of wiring harness automotive components (HTS 8544.30
and 9820.85.44) from Haiti during 2007–18.
[264]
Pub. L. 111-171,
§
2, Haiti Economic Lift Program Act of 2010.
For more information on this program, see USITC,
The Year in Trade
2011
, July 2012, 2-22 to 2-23, and
The Year in
Trade 2010
, July 2011, 2-21 to 2-22.
[265]
Pub. L. 114-27,
§
301, Extension of Preferential Duty
Treatment Program for Haiti.
[266]
Industry representative, telephone interview by USITC staff, May 22, 2019.
[267]
According to a representative of the Haitian industrial association,
preferences granted under the CBTPA and HOPE Acts complement each other and
function in an integrated way to support Haiti’s garment industry, its most
important source of employment. ADIH, written submission to USITC, May 24,
2019.
[269]
Ports and airports located in the Dominican Republic are widely used to export
qualifying Haitian apparel to the United States under HOPE/HELP. ADOZONA,
written submission to USITC, May 14, 2019.
[270]
For Haiti alone, duty-free apparel may undergo production in either Haiti or
the Dominican Republic as long as some production specifically occurs in Haiti.
The practices of co-production between the Dominican Republic and Haiti
developed during the years that both were CBTPA beneficiaries. CBTPA allows for
co-production among beneficiary countries as long as the finished good is
exported from a CBTPA country. When the United States and the Dominican
Republic implemented the U.S.-Central America-Dominican Republic Free Trade
Agreement (CAFTA-DR) on March 1, 2007, a clause was added to the CBTPA allowing
goods produced in Haiti, or co-produced in Haiti and the Dominican Republic, to
be exported from the Dominican Republic, even though it is no longer a CBTPA
beneficiary country. Pub. L. 109-53
§
402(d).
[271]
Co-production arrangements with the Dominican Republic are advantageous to both
countries. Lower assembly costs in Haiti means Haiti gains more jobs, while the
Dominican Republic gains foreign direct investment in spinning, knitting, or
dyeing facilities. On average, it takes $17 million to establish an assembly
facility in which 100,000 square feet of space may translate to 11,000 or more
sewing jobs. A comparably sized fabric-cutting facility would require a $400
million investment, but create only 100–150 jobs. Industry representative,
telephone interview by USITC staff, May 22, 2019.
[272]
The Dominican Republic and Haiti have built a robust textile co-production
system that currently supports more than 14,000 direct jobs in the Dominican
Republic and more than 40,000 direct jobs in Haiti. In 2019, there were 49
companies based in the Dominican Republic engaged in co-production of apparel
with Haiti. ADOZONA, written submission to by USITC, May 14, 2019.
[273]
Industry representative, email to USITC staff, June 3, 2019.
[274]
USITC, hearing transcript, May 14, 2019, 43, 61, 77 (testimony of Chuck Ward,
Gildan Activewear), 58–59, 73–74 (Gail Strickler, Brookfield Associates, LLC),
70 (Ron Sorini, Sorini, Samet); Industry representative, telephone interview by
USITC staff, May 22, 2019.
[275]
The WTO is based on a “multilateral” agreement whose rules and commitments
apply to all its members. WTO members may also negotiate smaller “plurilateral”
agreements whose rules and commitments apply only to the members that have
signed it.
[290]
According to the WTO, compulsory licensing is permission given by a government
to a non-patent owner to produce a patented product or process without the
consent of the patent owner. Compulsory licensing is traditionally used by
developing countries for producing necessary goods, like pharmaceuticals,
strictly for domestic consumption. WTO, “
Compulsory
Licensing of Pharmaceuticals and TRIPS
” (accessed July 2, 2019).
[294]
WTO, General Council,
General
Council––Annual Report (2018)
, January 15, 2019, 8. The Harmonized
Commodity Description and Coding System, or Harmonized System (HS), is an
international product nomenclature (classification system) used by over 200
countries as a basis for their customs tariffs and the collection of
international trade statistics. See World Customs Organization, “
What
Is the Harmonized System (HS)?
” (accessed July 19, 2019).
[305]
The Trade Facilitation Agreement Facility was created to help ensure that
developing and least-developed WTO members receive the full benefits of the
Trade Facilitation Agreement. The Facility helps developing and LDC members to
assess and fulfill specific needs in implementing the Trade Facilitation
Agreement. WTO, “
Trade
Facilitation Agreement Facility—About the Facility
” (accessed July 2,
2019).
[308]
WTO members are allowed to benefit from special and differential treatment by
implementing the agreement at their own pace. The A, B, and C notifications
indicate when the member will carry out each trade facilitation
measure—immediate implementation, implementation after a transitional period,
or implementation with assistance and support for capacity building. WTO,
General Council, "
Agenda
Item 2: Implementation of the Bali, Nairobi and Buenos Aires
Outcomes––Statement by the Chairman––Thursday, 18 October 2018
,"
October 19, 2018, par. 1.13.
[310]
The WTO is based on a “multilateral” agreement whose rules and commitments
apply to all its members. WTO members may also negotiate smaller “plurilateral”
agreements whose rules and commitments apply only to the members that have
signed it.
[323]
For a list of the participants, see WTO, Committee of Participants on the
Expansion of Trade in Information Technology Products,
“Status
of Implementation—Note by the Secretariat—Revision
,” October 10, 2018. The
difference between the number of participants and the number of WTO members is
that the 28 member states of the EU as well as Liechtenstein are included in
the list of WTO members. In the list of participants, only the European Union
(on behalf of all of the EU member states) and Switzerland (on behalf of the
customs union of Switzerland and Liechtenstein) are included.
[336]
The standstill section contains guidance on proposed subsidies outside those
explicitly prohibited under the agreement. The proposal from New Zealand,
Iceland and Pakistan under this section states that no Member of the Agreement
shall introduce new or enhance existing subsidies that would contribute to
overfishing or overcapacity.
[352]
Government of New Zealand, Ministry of Foreign Affairs and Trade, "
WTO
E-commerce Proactive Release
," February 18, 2019. In 2019, ministers
representing 76 WTO countries met at the World Economic Forum and announced
their intention to begin WTO negotiations on trade-related aspects of
e-commerce. The Joint Statement on Electronic Commerce indicated that the
agreement would build on existing WTO agreements, with the participation of as
many WTO members as possible. WTO, “
Joint
Statement on Electronic Commerce
,” January 25, 2019; U.S. Mission in
Geneva, "
U.S.
Statement at the Meeting of the WTO Joint Statement Initiative on E-Commerce
,"
March 6, 2019.
[353]
For example, this section includes a description of the circumstances that led
to the termination in May 2019 of four disputes filed in 2018 relating to U.S.
tariffs on steel and aluminum and retaliatory measures by Canada and Mexico
after the parties reached a mutually agreed solution.
[356]
WTO, “
Dispute
Settlement: DS381; United States—Measures Concerning the Importation, Marketing
and Sale of Tuna and Tuna Products
” (accessed July 2, 2019). The dispute
concerned U.S. dolphin-safe labeling provisions for tuna and tuna products and
whether they were inconsistent with U.S. obligations under GATT 1994 and the
Agreement on Technical Barriers to Trade (TBT Agreement). Mexico requested
dispute settlement consultations in October 2008. Mexico then requested
establishment of a panel, and a panel was established. The panel circulated its
report in September 2011. The United States and Mexico appealed certain issues
of law and legal interpretation in the panel report to the Appellate Body, and
in May 2012 the Appellate Body found aspects of the U.S. provisions
inconsistent with the TBT Agreement. In June 2012 the DSB adopted the Appellate
Body report and panel report (as modified). In July 2013, the United States
informed the DSB of a change in its dolphin-safe labeling requirements and
stated that it had brought its requirements into conformity with the DSB’s
recommendations and rulings. A series of compliance proceedings began in 2013
and led to panel and Appellate Body reports that were adopted in December 2015.
In March 2016, the U.S. National Oceanic and Atmospheric Administration issued
a new rule modifying the dolphin-safe labeling measure, and in April 2016 the
United States requested the establishment of a compliance panel to determine if
the new rule is consistent with U.S. WTO obligations. In June 2016, Mexico
requested the establishment of a second compliance panel because it considered
that the United States’ new rule had not brought the dolphin-safe labeling
provisions into WTO compliance. The panels issued their reports on October 26,
2017, and found that the new U.S. measure is not inconsistent with the relevant
U.S. WTO obligations. Mexico appealed aspects of the compliance panels’ reports
on December 1, 2017. The Appellate Body circulated its report on December 14,
2018, upholding all aspects of the panels’ legal and factual analysis that
Mexico appealed, in particular the panels’ findings that the dolphin-safe
labeling measure is not inconsistent with Article 2.1 of the TBT Agreement, and
that while it is inconsistent with Articles I:I and III:4 of GATT 1994, it is justified
under Article XX of GATT 1994, bringing the dispute to an end. USTR, “
U.S.
Announces Compliance
,” July 12, 2013; USTR,
2019
Trade Policy Agenda and 2018 Annual Report
, March 2019, 180–81.
[365]
WTO, “
Dispute
Settlement Gateway
” (accessed July 2, 2019). The Director-General composed
five of the panels on January 25, 2019, and composed the sixth panel (DS561,
Turkey) on February 28, 2019.
[367]
WTO, “
Dispute
Settlement: DS557; Canada—Additional Duties on Certain Products from the United
States
” (accessed July 2, 2019) (notification to the DSB on May 23, 2019,
that Canada had agreed to eliminate surtaxes on certain imports from the United
States). See also WTO, “
Dispute
Settlement: DS560; Mexico—Additional Duties on Certain Products from the United
States
” (accessed July 2, 2019) (notification to the DSB that Mexico had
eliminated certain duties on products originating in the United States). As
part of the agreement, the President issued Proclamation 9894 of May 19, 2019,
which amended Proclamations 9704 and 9705 to exclude Canada and Mexico from the
tariff proclaimed in those proclamations. The President did so after
determining under the framework of the agreement that imports of certain
aluminum and steel from Canada and Mexico no longer threaten to impair the
national security. Proclamation 9894 of May 19, 2019 (84 Fed. Reg. 23987, May
23, 2019).
[369]
WTO, “
Dispute
Settlement Gateway
” (accessed July 2, 2019). The Director-General composed
a separate panel in all nine of the disputes on January 25, 2019.
[380]
In DS531, on January 18, 2017, the United States requested consultations with
Canada with respect to measures maintained by the Canadian province of British
Columbia governing the sale of wine in grocery stores. The United States
claimed that the measure appeared to be inconsistent with Article III:4 of GATT
1994. At the request of the United States, the DSB established a panel on July
20, 2018. WTO, “
Dispute
Settlement: DS531; Canada—Measures Governing the Sale of Wine in Grocery Stores
(Second Complaint) (United States)
” (accessed July 2, 2019).
[382]
In DS534, on November 28, 2017, Canada requested consultations with the United
States relating to the final determination issued by USDOC following an
antidumping duty investigation regarding softwood lumber from Canada. Canada
claimed that USDOC’s determination is inconsistent with Articles 1, 2.1, and
2.4.2 of the Antidumping Agreement and Articles VI:1 and VI:2 of GATT 1994.
When consultations failed to resolve the dispute, Canada requested
establishment of a panel. The DSB established a panel on April 9, 2018, and the
Director-General composed the panel on May 22, 2018. USTR,
2019
Trade Policy Agenda and 2018 Annual Report
, March 2019, 197; WTO, “
Dispute
Settlement: DS534; United States—Anti-Dumping Measures Applying Differential
Pricing Methodology to Softwood Lumber from Canada
” (accessed July 2,
2019).
[384]
In a press release issued on July 6, 2018, USTR stated:
In this case, the United
States discovered Canadian subsidies which the Canadian firms failed to
disclose during the U.S. investigation. After the Department of Commerce
implemented tariffs to account for these market distortions, the Canadian
government sued the United States at the WTO.
Among other things, the panel
report upheld Canada’s claims with respect to U.S. Department of Commerce
treatment of subsidies that exporters refused to disclose in response to
Commerce questionnaires, but which Commerce subsequently discovered during the
course of the countervailing duty investigation.
[392]
USTR,
2019
Trade Policy Agenda and 2018 Annual Report
, March 2019, 148–49. The
report further stated that the United States expects the DSB, “[i]n 2019, to
continue to focus on the administration of the dispute settlement process in
the context of individual disputes.” The 2019 report also said that the United
States “will continue to raise its systemic concerns with Appellate Body
overreaching and press for WTO Members to take responsibility to ensure the WTO
dispute settlement system operates as intended and agreed in the DSU.”
[397]
OECD, "
Statement
of the Chair of MCM 2018
" (accessed July 1, 2019).
In March 2017, the G20 finance ministers tasked
the OECD with writing an interim report on the implications of digitalization
for taxation. OECD released the report—“Tax Challenges Arising from
Digitalization”—on March 16, 2018. The report provides a detailed analysis of
the different digitalized business models, including common characteristics of
highly digitalized models, how they create value, and potential implications
for the existing international tax framework. The report also describes the
wide-ranging positions of different countries on long-term solutions and on the
need for interim measures. OECD members are working towards a consensus-based
solution by 2020. OECD, “
Brief
on the Tax Challenges Arising from Digitalisation
,” 2018; USTR,
2019
Trade Policy Agenda and 2018 Annual Report
, March 2019, IV-97.
[399]
OECD, TAD, TC, “Summary Record of the 172nd Session of the Trade
Committee––Confidential Session––March 23, 2018,” April 9, 2018; OECD, TAD, TC,
“Summary Record of the 173rd Session of the Trade Committee––Plenary
Session––24–25 April 2018,” July 18, 2018; OECD, TAD, TC, “Summary Record of
the 173rd Session of the Trade Committee––Confidential Session––April 25,
2018,” July 18, 2018; OECD, TAD, TC, “Summary Record of the 174th Session of
the Trade Committee––Confidential Session––October 23, 2018,” November 20,
2018; OECD, TAD, TC, “Summary Record of the 174th Session of the Trade
Committee––Session with the Participation of G20 and Invited Partner
Countries––October 23, 2018,” November 20, 2018.
[401]
Government of Canada, “
Prime
Minister Concludes Successful G7 Summit
,” June 10, 2018. The Group of Seven
(G7) was formed in 1976 and was made up of the UK, Canada, France, Germany,
Italy, Japan, and the United States. G7 ministers called for broadening
economic and financial policy dialogue with other governments to promote more
stable world economic growth, which led to the formation of the G20. G7
Research Group, “
What Is
the G7/G8?
” (accessed August 13, 2019).
[402]
G20 Argentina 2018, “
G20
Leaders’ Declaration
,” November 30–December 1, 2018. By 1999, the G7 had
added other members to expand the group to 20 members to better address
challenges to the global economy following a financial crisis in 1997–1999 that
was spreading
from Asia to other emerging economies. The G20 included 19
countries––Argentina, Australia, Brazil, Canada, China, France, Germany, India,
Indonesia, Italy, Japan, South Korea, Mexico, Russia, Saudi Arabia, South
Africa, Turkey, the UK, and the United States—with the European Union becoming
the 20th member in the group. G20 Research Group,
The Group of Twenty: A
History
, 2008; G20 Information Centre website,
http://www.g20.utoronto.ca
(accessed May
29, 2019). In addition, leaders and representatives of other countries and
international organizations may be invited to participate in the annual summit
meeting along with leaders from the G20 members. Government of Japan, Ministry
of Foreign Affairs, “
G20 2019
Japan––What Is the G20 Summit?
” (accessed May 29, 2019).
[403]
OECD, TAD, TC, “Summary Record of the 172nd Session of the Trade
Committee––Confidential Session––March 23, 2018,” April 9, 2018; OECD, TAD, TC,
“Summary Record of the 173rd Session of the Trade Committee––Confidential
Session––April 25, 2018,” July 18, 2018; OECD, TAD, TC, “Summary Record of the
174th Session of the Trade Committee––Confidential Session––October 23, 2018,”
November 20, 2018.
[404]
OECD, TAD, TC, WPTC, “Draft Summary Record: Working Party of the Trade
Committee––15–16 March 2018––Paris, France,” April 6, 2018; OECD, TAD, TC,
WPTC, “Draft Summary Record: June 2018 WPTC––18–19 June 2018—Paris, France,”
July 16, 2018; OECD, TAD, TC, WPTC, “Summary Record: Working Party of the Trade
Committee––17–18 October 2018––Paris, France,” November 5, 2018; OECD, TAD, TC,
WPTC, “Summary Record: December 2018 WPTC––11–12 (a.m.) December 2018––Paris,
France,” February 22, 2019.
[405]
OECD, TAD, TC, WPTC,
Using the STRI to Map Restrictiveness in Digital Trade
,
May 24, 2018.
[406]
OECD, TAD, TC, WPTC,
Fostering Participation in Digital Trade for ASEAN
MSMEs
, September 24, 2018.
[407]
OECD, TAD, TC, WPTC,
Report: Expert Meeting on Services Trade Policy,
Structural Transformation and Labour Market Adjustments,
March 2, 2018.
[408]
OECD, TAD, TC, WPTC, “
Services Exported Together with Goods,”
February
28, 2018.
[409]
OECD, TAD, TC, WPTC, “Summary Record: Working Party of the Trade
Committee––17–18 October 2018––Paris, France,” November 5, 2018; OECD, TAD, TC,
WPTC, “Summary Record: December 2018 WPTC––11–12 (a.m.) December 2018––Paris,
France,” February 22, 2019.
[413]
OECD, “Role of the OECD in Support and Facilitation of the Global Forum on
Steel Excess Capacity (GFSEC),” January 25, 2017.
[414]
The 33 members are Argentina, Australia, Austria, Belgium, Brazil, Canada,
China, the European Union, Finland, France, Germany, Greece, Hungary, India,
Indonesia, Italy, Japan, South Korea, Luxembourg, Mexico, the Netherlands,
Norway, Poland, Russia, Saudi Arabia, Slovakia, South Africa, Spain, Sweden,
Switzerland, Turkey, the UK, and the United States. OECD, “Role of the OECD in
Support and Facilitation of the Global Forum on Steel Excess Capacity (GFSEC),”
January 25, 2017, 6.
[418]
In 2018, the 21 APEC member economies were Australia; Brunei Darussalam
(Brunei); Canada; Chile; China; Hong Kong, China; Indonesia; Japan; South
Korea; Malaysia; Mexico; New Zealand; Papua New Guinea; Peru; the Philippines;
Russia; Singapore; Taiwan; Thailand; the United States; and Vietnam. For
further details, see APEC, “
About
APEC
” (accessed May 20, 2019).
[424]
The United States co-leads Global Value Chain (GVC) Work Stream 2 with China.
The objective of this work stream is to develop an APEC TiVA database by 2018.
Upon USTR’s request, in the capacity of technical support, on the U.S. side
USITC staff have been co-leading this project with participants from the U.S.
Department of Commerce’s Bureau of Economic Analysis since 2014. For more
information on APEC GVC development and cooperation, see USITC,
The Year in Trade
in 2015
, July 2016, 120–21, and
The Year in
Trade in 2016
, July 2017, 111–12.
[425]
For more information on APEC work concerning digital trade, the internet
economy, and e-commerce, see USITC,
The Year in
Trade in 2017,
August 2018, 116–17.
[450]
The term free trade agreements includes free trade agreements (FTAs) and trade
promotion agreements (TPAs).
[451]
As described in chapter 1, U.S. total merchandise trade with FTA partners is
based on total exports and general imports. Only imports entering under trade
preference programs and FTAs are based on imports for consumption.
[452]
Not all products imported from FTA partners are eligible for FTA treatment or
take advantage of their eligibility.
[453]
The value of imports of food preparations not elsewhere specified (HTS 2106.90)
increased by $2.6 billion, or 78,293.3 percent. The majority of the value of
imports within this category were from tariff lines for beverage sweeteners at
the HTS 10-digit level. USITC DataWeb/USDOC (accessed July 3, 2019).
[454]
The value of imports of motor cars and other motor vehicles designed to
transport people (HTS 8703) increased by $4.6 billion, or 15.1 percent. USITC
DataWeb/USDOC (accessed May 9, 2019).
[455]
USITC DataWeb/USDOC (accessed July 3, 2019).
[470]
The deadline for submission of public comments was January 15, 2019. USTR also
held a public hearing on January 29, 2019. 83 Fed. Reg. 57790 (November 16,
2018).
[472]
The UK voted by referendum to withdraw from the EU on June 23, 2016. As of this
writing, the effective date and terms of the withdrawal have yet to be
determined.
[525]
U.S. bilateral trade relations with Canada and Mexico are described in chapter
6 of this report.
[526]
The section on Mexico in chapter 6 updates recent developments in NAFTA’s
cross-border trucking provisions; more information appears in USITC,
The Year in
Trade 2008
, July 2009, 5–16. All product categories offer duty-free
entry to originating goods from Mexico, and all shipments of goods from Canada
are likewise eligible except those exceeding a tariff-rate quota.
[527]
The FTC is composed of the U.S. Trade Representative, the Canadian Minister of
Foreign Affairs, and the Mexican Secretary of Economy. The most recent official
meeting of the commission was held in Washington, DC, on April 3, 2012. USTR,
2019
Trade Policy Agenda and 2018 Annual Report
, March 2019, 3.
[541]
The four groups of North American species featured in the CEC cooperative
projects on sustainable trade of species are sharks, turtles/tortoises,
tarantulas, and timber. All four species are listed in Appendix II of the
Convention on International Trade in Endangered Species of Wild Fauna and Flora
(CITES). CEC,
Operational
Plan for the Commission for Environmental Cooperation
, June 28, 2017,
3–4.
[545]
Internationally recognized arbitral mechanisms include the International Centre
for the Settlement of Investment Disputes (ICSID) at the World Bank, ICSID’s
Additional Facility Rules, and the rules of the United Nations Commission on
International Trade Law (UNCITRAL). NAFTA Secretariat, “
Overview
of the Dispute Settlement Provisions
” (accessed June 14, 2019). See also
NAFTA, Article 1130.
[549]
For a dispute arising under Chapter 19, a binational panel is made up of five
representatives selected from the rosters lists of the parties involved in the
dispute. (Rosters are composed of individuals from which panelists are
appointed to settle disputes. Members of these rosters are of good character,
high standing, and good repute and have been chosen strictly on the basis of their
objectivity, reliability, sound judgment, and general familiarity with
international trade law.) From their roster list, each party appoints two
members, with the fifth selected from one of the two countries involved in the
dispute. NAFTA Secretariat, “
Overview
of the Dispute Settlement Provisions
” (accessed June 14, 2019).
[551]
In the case of USITC Injury Determination in the matter of Softwood Lumber from
Canada (USA-CDA-2018-1904-03), the NAFTA dispute settlement panel convened a
hearing in Washington D.C. on May 7, 2019. The panel issued its interim
decision and panel order to remand the findings of the Commission on September
4, 2019. NAFTA Secretariat, Article 1904 Binational Panel Review, “
Interim
Decision and Order of the Panel—Softwood Lumber from Canada: Determinations
(Final Injury Determination)
,” September 4, 2019.
[552]
The presentation of developments on labor and environment issues under separate
subsections is patterned after the coverage of FTAs under the USTR annual reports.
See, for example, USTR,
2019
Trade Policy Agenda and 2018 Annual Report
, March 1, 2019. When no 2018
developments of note occurred under an FTA on a particular issue, the
subsection is not presented.
[554]
This supplemental agreement to NAFTA is the NAALC. USDOL, ILAB, “
North American Agreement
on Labor Cooperation
” (accessed June 13, 2019). All U.S. FTAs include labor
provisions except the U.S.-Israel FTA—the United States’ first FTA, which
entered into force in 1985. See earlier in this chapter for developments
concerning the NAFTA and its successor agreement. USDOL, “
Trade Negotiation and
Enforcement
” (accessed May 8, 2019).
[556]
This supplemental agreement is the
NAAEC. CEC, “
North American Agreement on
Environmental Cooperation
” (accessed June 14, 2019). The U.S.-Israel FTA also does not contain
environment provisions. EPA, “
International Cooperation—U.S. Trade
and Investment Agreements
” (accessed May 8, 2019). The NAFTA contains the North American Agreement
on Environmental Cooperation (NAAEC), which operates through the Commission for
Environmental Cooperation (CEC) in Montreal, Canada. See earlier in this
chapter for developments concerning NAFTA and USMCA.
[557]
The U.S.-Australia FTA and the U.S.-Israel FTA do not contain the investment
provisions mentioned above.
[560]
The U.S.-Australia Joint Committee
is the central body under the agreement. It met last in December 2017, holding
its sixth meeting to review the operation of the agreement. The Joint Committee
received a report from the agreement’s Committee on Sanitary and Phytosanitary
Measures about its efforts to address SPS issues affecting agricultural trade
between the two countries. The two sides agreed to aim to hold the Joint
Committee’s seventh meeting by the end of 2018 to review the FTA’s
implementation. USTR, “
United States and Australia Meet to
Review Implementation of Bilateral Free Trade Agreement
,” December 8, 2017; Government of
Australia, DFAT, “
Australia-United States FTA––AUSFTA
Joint Committee Meeting
,” December 7, 2017.
[609]
If a subject product is not commercially available in the FTA region, USTR may
engage with the FTA partner government to begin consultations on a proposed
modification of the rule of origin. On September 24, 2018, the United States
received a request from the South Korean government to initiate consultations
under KORUS on the appropriateness of modifying product-specific rules of
origin based on the commercial availability of a particular fiber, yarn, or
fabric within the U.S. and South Korean territories. USDOC’s Committee for the
Implementation of Textile Agreements issued a request for public comment on
October 17, 2018, concerning whether the U.S. domestic industry could supply
these products in commercial quantities in a timely way. Public comments closed
on November 16, 2018. 83 Fed. Reg. 52418 (October 17, 2018); USDOC, OTEXA, “
Frequently
Asked Questions About the Commercial Availability Process
” (accessed July
5, 2019). On February 22, 2019, USTR requested an investigation by USITC to
provide advice on these modifications under section 104(1) of KORUS. Written
public comments for USITC investigation were due on June 24, 2019. 84 Fed. Reg.
9380 (March 14, 2019).
[646]
Services trade is based on data for cross-border trade in private services,
which exclude government sales and purchases of goods and services not included
elsewhere (n.i.e.). The sole exception is the EU: U.S. services imports from
the EU include government goods and services n.i.e. According to BEA, trade
data from EU-based government services providers are “suppressed to avoid the
disclosure of data of individual companies.” USDOC, BEA, International Services
Data, “Table 2.3, U.S. Trade in Services, by Country or Affiliation and by Type
of Service, European Union,” September 12, 2019.
Exports and imports of government services primarily consist of services
supplied in support of operations by the U.S. military and embassies abroad.
USITC,
Recent
Trends in U.S. Services Trade, 2018 Annual Report
, June 2018, 12.
[647]
Other business services includes research and development services;
professional and management consulting services; and technical, trade-related,
and other business services, which include architectural and engineering,
construction, audiovisual, waste treatment, operational leasing, trade-related,
and other business services. USDOC, BEA, “
Additional
Information, Explanatory Notes
,”
May 9, 2019.
[648]
Charges for the use of intellectual property “not included elsewhere” (n.i.e.)
include “charges for the use of proprietary rights, such as patents, trademarks,
and copyrights, and charges for licenses to use, reproduce, distribute, and
sell or purchase intellectual property.” USDOC, BEA,
U.S.
International Economic Accounts: Concepts and Methods
,
September
2014, 10–22.
[653]
USTR, “
Section
232 National Security Investigation of Imports of Automobiles and Automotive
Parts Hearing Panel
,”
hearing transcript, July 19, 2018, 187–90.
Following receipt of the Secretary of Commerce’s confidential report on the
investigation, the President issued a proclamation on May 17, 2019, directing the
USTR to pursue negotiations on agreements addressing threatened impairment of
national security from EU, Japan, and other trading partners.
These negotiations are ongoing as of this
writing, with the USTR due to provide an update to the President on their outcome
in November 2019. 84 Fed. Reg. 23433 (May 21, 2019).
[665]
Proclamation 9740, 83 Fed. Reg. 20683 (May 7, 2018); Proclamation 9739, 83 Fed.
Reg. 20677 (May 7, 2018). This exemption for Canada and Mexico expired on June
1, 2018, however, and on that date, the 25 percent tariff on steel imports and
the 10 percent tariff on aluminum imports for both countries went into effect. Proclamation
9758, 83 Fed. Reg. 25849 (June 5, 2018).
[671]
USITC DataWeb/USDOC (accessed June 27, 2019). “Steel products” here are defined
as imports for consumption under the following HTS 4- and 6-digit tariff lines
listed in U.S. note 16 in chapter 99, subchapter III (provisions 9903.80.XX):
HTS 7206, 7207, 7208, 7209, 7210, 7211, 7212, 7213, 7214, 7215, 7216.10.00,
7216.21.00, 7216.22.00, 7216.31.00, 7216.32.00, 7216.33.00, 7216.40.00,
7216.50.00, 7216.99.00, 7217, 7218, 7219, 7220, 7221, 7222, 7223, 7224, 7225,
7226, 7227, 7228, 7229, 7301.10.00, 7302.10, 7302.40.00, 7302.90.00, 7304,
7305, and 7306. Ranking is based on U.S. imports for consumption of steel
products.
[672]
USITC DataWeb/USDOC (accessed June 27, 2019). “Aluminum” here is defined as
imports for consumption under the following HTS 4- and 6-digit tariff lines
listed in U.S. note 19 for aluminum (provisions 9903.85.XX): HTS 7601, 7604,
7605, 7606, 7607, 7608, 7609, and 7616.99.51. Ranking is based on U.S. imports
for consumption of aluminum.
[685]
An EU
data subject is anyone whose personal data are located in
the EU, regardless of the residence, citizenship, or physical location of the
data subject.
[693]
Passenger motor vehicles are classified under the following 15 6-digit lines in
the Harmonized Tariff Schedule of the United States (HTS): 8703.21, 8703.22,
8703.23, 8703.24, 8703.31, 8703.32, 8703.33, 8703.40, 8703.50, 8703.60,
8703.70, 8703.80. 8703.90, 8704.21, and 8704.31.
[706]
The American Chamber of Commerce in China reported early in 2018 that 60
percent of U.S. member companies who are operating in China listed regulatory
barriers as a top challenge to doing business in China; this percentage was up
39 percent since 2014. AmCham-China,
2018
China Business Climate Survey Report
, January 2018, 40; USCC,
2018 Report To
Congress
, November 201, 43.
[708]
Proclamation 9705, 83 Fed. Reg. 11625 (March 15, 2018); Proclamation 9704, 83 Fed.
Reg. 11619 (March 15, 2018). This exemption for Canada and Mexico expired on
June 1, 2018, however, and on that date, the 25 percent tariff on steel imports
and the 10 percent tariff on aluminum imports for both countries went into
effect. Proclamation 9758, 83 Fed. Reg. 25849 (June 5, 2018).
[713]
USITC DataWeb/USDOC (accessed June 27, 2019). “Steel products” here are defined
as imports for consumption under the following HTS 4- and 6-digit tariff lines
listed in U.S. note 16 in chapter 99, subchapter III (provisions 9903.80.XX):
HTS 7206, 7207, 7208, 7209, 7210, 7211, 7212, 7213, 7214, 7215, 7216.10.00,
7216.21.00, 7216.22.00, 7216.31.00, 7216.32.00, 7216.33.00, 7216.40.00,
7216.50.00, 7216.99.00, 7217, 7218, 7219, 7220, 7221, 7222, 7223, 7224, 7225,
7226, 7227, 7228, 7229, 7301.10.00, 7302.10, 7302.40.00, 7302.90.00, 7304,
7305, and 7306. Ranking is based on U.S. imports for consumption of steel
products.
[714]
USITC DataWeb/USDOC (accessed June 27, 2019). “Aluminum products” here are
defined as imports for consumption under the following HTS 4- and 6-digit
tariff lines listed in U.S. note 19 for aluminum (provisions 9903.85.XX): HTS
7601, 7604, 7605, 7606, 7607, 7608, 7609, and 7616.99.51. Ranking is based on
U.S. imports for consumption of aluminum.
[716]
For information about the estimated effect of China’s IPR infringement on the
U.S. economy, see USITC,
China: Intellectual
Property Infringement
,
November 2010, and USITC,
China: Effects of
Intellectual Property Infringement
, May 2011. The first bilateral IPR
agreement with China was negotiated in 1995. Signed into law on March 11, 2995,
the agreement terminated the Special 301 investigation against China that was
ongoing at the time, lifted sanctions, and revoked China’s status as a priority
foreign country. In exchange, China agreed to establish mechanisms to ensure
the enforcement of IPRs, to publish all of its laws and regulations concerning
intellectual property protection, and to provide U.S. rights holders greater
access to the Chinese market. USTR,
1995 Trade Policy Agenda and 1994 Annual
Report
, March 1994; 60 Fed. Reg. 12583 (March 7, 1995).
[736]
In a modification issued by USTR on December 19, 2018, the date of the
scheduled tariff increase to 25 percent was postponed from January 1, 2019, until
March 2, 2019. This March 2 increase was postponed until further notice by USTR
in a modification issued on March 5, 2019. 84 Fed. Reg. 20459 (May 9, 2019); 83
Fed. Reg. 47974 (September 21, 2018).
[743]
CFIUS is an interagency U.S. government body, composed of nine Cabinet members,
two ex officio members, and other members as appointed by the President, that
assists the President in reviewing the national security aspects of foreign
direct investment in the U.S. economy. See CRS, “
The Committee on Foreign
Investment in the United States (CFIUS)
,” updated May 15, 2019.
[749]
USTR, “
Section
232 National Security Investigation of Imports of Automobiles and Automotive
Parts Hearing Panel
,”
hearing transcript, July 19, 2018, 196–201.
Following receipt of the Secretary of Commerce’s confidential report on the
investigation, the President issued a proclamation on May 17, 2019, directing
USTR to pursue negotiations on agreements addressing threatened impairment of
national security from EU, Japan, and other trading partners.
These negotiations are ongoing as of this
writing, with the USTR due to provide an update to the President on their
outcome in November 2019. 84 Fed. Reg. 23433 (May 21, 2019). At the signing of
USMCA on November 30, 2018, the USTR issued a side letter agreement with Canada
on the section 232 investigation on passenger vehicles, trucks, or automotive
parts. The side letter confirmed that should the United States apply tariffs
under this section 232 investigation, Canadian exports to the United States of
2.6 million passenger vehicles, all light trucks, and $32.4 billion of auto
parts would be excluded from the measure and subject to tariff treatment under
USMCA. USTR,
Agreement
between the United States of America, the United Mexican States, and Canada
,
November 30, 2018, Side Letter Text on 232
CA-US Response.
[758]
USITC DataWeb/USDOC (accessed June 27, 2019). “Steel products” here are defined
as imports for consumption under the following HTS 4- and 6-digit tariff lines
listed in U.S. note 16 in chapter 99, subchapter III (provisions 9903.80.XX):
HTS 7206, 7207, 7208, 7209, 7210, 7211, 7212, 7213, 7214, 7215, 7216.10.00,
7216.21.00, 7216.22.00, 7216.31.00, 7216.32.00, 7216.33.00, 7216.40.00,
7216.50.00, 7216.99.00, 7217, 7218, 7219, 7220, 7221, 7222, 7223, 7224, 7225,
7226, 7227, 7228, 7229, 7301.10.00, 7302.10, 7302.40.00, 7302.90.00, 7304,
7305, and 7306. Ranking is based on U.S. imports for consumption of steel
products.
[759]
USITC DataWeb/USDOC (accessed June 27, 2019). “Aluminum” here is defined as
imports for consumption under the following HTS 4- and 6-digit tariff lines
listed in U.S. note 19 for aluminum (provisions 9903.85.XX): HTS 7601, 7604,
7605, 7606, 7607, 7608, 7609, and 7616.99.51. Ranking is based on U.S. imports
for consumption of aluminum.
[762]
83 Fed. Reg. 347 (January 3, 2018); 83 Fed. Reg. 350 (January 3, 2018). For
more information on the antidumping duty and countervailing duty orders, see
chapter 2.
[763]
NAFTA Secretariat, “
Dispute
Settlement: Status Report of Panel Proceedings
” (accessed July 1, 2019). In
the case of USITC Injury Determination in the matter of Softwood Lumber from
Canada (USA-CDA-2018-1904-03), the NAFTA dispute settlement panel convened a
hearing in Washington D.C. on May 7, 2019. The panel issued its interim
decision and panel order to remand the findings of the Commission on September
4, 2019. See the “NAFTA Dispute Settlement” section in chapter 5 of this report
for further details on this process. NAFTA Secretariat. Article 1904 Binational
Panel Review, “
Interim
Decision and Order of the Panel—Softwood Lumber from Canada: Determinations
(Final Injury Determination)
,” September 4, 2019.
[775]
USTR, “
Section
232 National Security Investigation of Imports of Automobiles and Automotive
Parts Hearing Panel
,”
hearing transcript, July 19, 2018, 191–96.
Following receipt of the Secretary of Commerce’s confidential report on the
investigation, the President issued a proclamation on May 17, 2019 directing the
USTR to pursue negotiations on agreements addressing threatened impairment of
national security from EU, Japan, and other trading partners.
These negotiations are ongoing as of this
writing, with the USTR due to provide an update to the President on their
outcome in November 2019. 84 Fed. Reg. 23433 (May 21, 2019).
At the signing of USMCA on November 30, 2018,
USTR issued a side letter agreement with Mexico on the section 232 on passenger
vehicles, trucks, or automotive parts. The side letter confirmed that should
the United States apply tariffs under this section 232 investigation, Mexican
exports to the United States of 2.6 million passenger vehicles, all light
trucks, and $108 billion of auto parts would be excluded for at least 60 days
after the imposition of the measure, and subject to tariff treatment under
USMCA. USTR,
Agreement
between the United States of America, the United Mexican States, and Canada
,
November 30, 2018, MX-US Side Letter Text on
232.
[785]
USITC DataWeb/USDOC (accessed June 27, 2019). “Steel products” here are defined
as imports for consumption under the following HTS 4- and 6-digit tariff lines
listed in U.S. note 16 in chapter 99, subchapter III (provisions 9903.80.XX):
HTS 7206, 7207, 7208, 7209, 7210, 7211, 7212, 7213, 7214, 7215, 7216.10.00, 7216.21.00,
7216.22.00, 7216.31.00, 7216.32.00, 7216.33.00, 7216.40.00, 7216.50.00,
7216.99.00, 7217, 7218, 7219, 7220, 7221, 7222, 7223, 7224, 7225, 7226, 7227,
7228, 7229, 7301.10.00, 7302.10, 7302.40.00, 7302.90.00, 7304, 7305, and 7306.
Ranking is based on U.S. imports for consumption of steel products.
[786]
USITC DataWeb/USDOC (accessed June 27, 2019). “Aluminum” here is defined as
imports for consumption under the following HTS 4- and 6-digit tariff lines
listed in U.S. note 19 for aluminum (provisions 9903.85.XX): HTS 7601, 7604,
7605, 7606, 7607, 7608, 7609, and 7616.99.51. Ranking is based on U.S. imports
for consumption of aluminum.
[796]
80
Fed. Reg.
2179 (January 10, 2015). “U.S. commercial zones” refers
to the commercial zones that extend up to 25 miles north of the U.S. border
with Mexico.
[797]
“Material harm” in the context of this provision means a “significant loss in
the share of the U.S. market for long-haul truck services held by persons of
the United States caused by or attributable to persons of Mexico.” According to
the agreement, the parties shall meet no later than five years after the agreement
enters into force to “exchange views” on the operation of this provision. USTR,
Agreement
between the United States of America, the United Mexican States, and Canada
,
May 30, 2019, “Annex II Investment and Services Non-Conforming Measures–United
States.”
[798]
After the U.S. withdrawal, the other 11 Asian/Pacific countries participating
in the Trans-Pacific Partnership agreed to form the Comprehensive and
Progressive Agreement for Trans-Pacific Partnership, which entered into force
for the first six signatories on December 30, 2018.
[800]
USTR, “
Section
232 National Security Investigation of Imports of Automobiles and Automotive
Parts Hearing Panel
,”
hearing transcript, July 19, 2018, 215–20.
Following receipt of the Secretary of
Commerce’s confidential report on the investigation, the President issued a
proclamation on May 17, 2019 directing the USTR to pursue negotiation on agreements
addressing threatened impairment of national security from EU, Japan, and other
trading partners.
These negotiations are
ongoing as of this writing, with the USTR due to provide an update to the
President on their outcome in November 2019. 84 Fed. Reg. 23433 (May 21, 2019).
[809]
Proclamation 9705, 83 Fed. Reg. 11625 (March 15, 2018); Proclamation 9704, 83 Fed.
Reg. 11619 (March 15, 2018). This exemption for Canada and Mexico expired on
June 1, 2018, however, and on that date, the 25 percent tariff on steel imports
and the 10 percent tariff on aluminum imports for both countries went into
effect. Proclamation 9758, 83 Fed. Reg. 25849 (June 5, 2018). For more
information, see the chapter 2 section on national security investigations.
[811]
USITC DataWeb/USDOC (accessed June 27, 2019). “Steel products” here are defined
as imports for consumption under the following HTS 4- and 6-digit tariff lines
listed in U.S. note 16 in chapter 99, subchapter III (provisions 9903.80.XX):
HTS 7206, 7207, 7208, 7209, 7210, 7211, 7212, 7213, 7214, 7215, 7216.10.00,
7216.21.00, 7216.22.00, 7216.31.00, 7216.32.00, 7216.33.00, 7216.40.00,
7216.50.00, 7216.99.00, 7217, 7218, 7219, 7220, 7221, 7222, 7223, 7224, 7225,
7226, 7227, 7228, 7229, 7301.10.00, 7302.10, 7302.40.00, 7302.90.00, 7304,
7305, and 7306. Ranking is based on U.S. imports for consumption of steel
products.
[812]
USITC DataWeb/USDOC (accessed June 27, 2019). “Aluminum” here is defined as
imports for consumption under the following HTS 4- and 6-digit tariff lines
listed in U.S. note 19 for aluminum (provisions 9903.85.XX): HTS 7601, 7604,
7605, 7606, 7607, 7608, 7609, and 7616.99.51. Ranking is based on U.S. imports
for consumption of aluminum.
[830]
USDOC, BEA, Interactive data International Transactions, Services & IIP,
International Transactions, Table 1.3, June 28, 2019.
[831]
See USITC,
Year
in Trade 2017
, August 2018, 179, for an explanation of the factors
motivating this increase in crude petroleum exports. See also appendix table
A.59 in this report.
[832]
USITC DataWeb/USDOC (accessed May 9, 2019). Total beef exports consist of
fresh, frozen, and prepared beef and beef products and are classified in the
following HTS 6-digit lines: 0201.10, 0201.20, 0201.30, 0202.10, 0202.20,
0202.30, 0206.10, 0206.21, 0206.22, 0206.29, 0210.20, and 1602.50.
[833]
USITC DataWeb/USDOC (accessed May 9, 2019). Passenger motor vehicles are classified
in the following 15 HTS 6-digit lines: 8703.21, 8703.22, 8703.23, 8703.24,
8703.31, 8703.32, 8703.33, 8703.40, 8703.50, 8703.60, 8703.70, 8703.80.
8703.90, 8704.21, and 8704.31.
[837]
Following the submission of the Commerce Secretary’s report on February 17,
2019, the President issued Proclamation 9888 on May 17, 2019, noting that the
circumstances and volume of U.S. imports of automobiles and certain automobile
parts “threaten[s] to impair the national security of the United States.” The
President proclaimed that USTR, in consultation with other executive branches,
should continue to monitor these imports and pursue trade agreements to address
this threat, updating the President by November 13, 2019. 84 Fed. Reg. 23433
(May 21, 2019).
[838]
For more information on the President’s safeguard actions, see chapter 2.
[842]
Proclamation 9705, 83 Fed. Reg. 11625 (March 15, 2018); Proclamation 9704, 83 Fed.
Reg. 11619 (March 15, 2018). This exemption for Canada and Mexico expired on
June 1, 2018, however, and on that date, the 25 percent tariff on steel imports
and the 10 percent tariff on aluminum imports for both countries went into
effect. Proclamation 9758, 83 Fed. Reg. 25849 (June 5, 2018).
[846]
USITC DataWeb/USDOC (accessed June 27, 2019). “Steel products” here are defined
as imports for consumption under the following HTS 4- and 6-digit tariff lines
listed in U.S. note 16 in chapter 99, subchapter III (provisions 9903.80.XX):
HTS 7206, 7207, 7208, 7209, 7210, 7211, 7212, 7213, 7214, 7215, 7216.10.00,
7216.21.00, 7216.22.00, 7216.31.00, 7216.32.00, 7216.33.00, 7216.40.00,
7216.50.00, 7216.99.00, 7217, 7218, 7219, 7220, 7221, 7222, 7223, 7224, 7225,
7226, 7227, 7228, 7229, 7301.10.00, 7302.10, 7302.40.00, 7302.90.00, 7304,
7305, and 7306. Ranking is based on U.S. imports for consumption of steel
products.
[847]
USITC DataWeb/USDOC (accessed June 27, 2019). “Aluminum” here is defined as
imports for consumption under the following HTS 4- and 6-digit tariff lines
listed in U.S. note 19 for aluminum (provisions 9903.85.XX): HTS 7601, 7604,
7605, 7606, 7607, 7608, 7609, and 7616.99.51. Ranking is based on U.S. imports
for consumption of aluminum.
[856]
For example, East Coast refineries, which are better configured to process
light sweet crude, do not have pipeline access to U.S. Gulf Coast crude
production. It is sometimes more cost effective for these refineries to import
foreign light sweet crude rather than using rail transport to buy domestic
crude from Texas. EIA, “
The U.S. Exported
2 Million Barrels per Day
,” April 15, 2019.
[861]
Because the United States and India are both major centers for the global trade
of cut or faceted diamonds, diamonds lead U.S.-India trade for both U.S. imports
and exports.
[862]
International Trade Daily
, “India Seeks Exemption from U.S. Tariffs on
Metal Exports,” April 12, 2018.
[866]
All WTO members are required to report (notify) the WTO on the activities of
state trade enterprises (STEs), which can include market price support for
agricultural products. If another WTO member believes the reported information
is incorrect, it can “counter” the notification. Following the
counternotification, a working party may be set up to evaluate the notification
and counternotification. See WTO, “
Understanding on
the Interpretation of the Article XVII of the General Agreement on Tariffs and
Trade 1994
” (accessed May 30, 2019).
[869]
Proclamation 9705, 83 Fed. Reg. 11625 (March 15, 2018); Proclamation 9704, 83 Fed.
Reg. 11619 (March 15, 2018). This exemption for Canada and Mexico expired on
June 1, 2018, however, and on that date, the 25 percent tariff on steel imports
and the 10 percent tariff on aluminum imports for both countries went into
effect. Proclamation 9758, 83 Fed. Reg. 25849 (June 5, 2018).
[870]
WTO, “
Dispute
Settlement: DS547; United States—Certain Measures on Steel and Aluminum
Products
” (accessed May 29, 2019).
On
June 20, 2018, India announced a list of U.S. export products on which it would
impose retaliatory tariffs in response to the United States’ 232 actions. The
imposition of the tariffs was initially postponed and eventually enacted on
June 16, 2019. The tariffs range from 10 to 50 percentage points in addition to
existing tariff rates, and cover various products, including agricultural
goods, chemicals, and some iron and steel products. Government of India,
Ministry of Finance, Department of Revenue, “
Notification
No. 17/2019 Customs
,” June 15, 2019; Government of India, Ministry of
Finance, Department of Revenue, “
Notification
No. 49/2018 Customs
,” June 20, 2018; USTR,
2019
National Trade Estimate
, March 2019, 236.
[871]
USITC DataWeb/USDOC (accessed June 27, 2019). “Steel products” here are defined
as imports for consumption under the following HTS 4- and 6-digit tariff lines
listed in U.S. note 16 in chapter 99, subchapter III (provisions 9903.80.XX):
HTS 7206, 7207, 7208, 7209, 7210, 7211, 7212, 7213, 7214, 7215, 7216.10.00,
7216.21.00, 7216.22.00, 7216.31.00, 7216.32.00, 7216.33.00, 7216.40.00,
7216.50.00, 7216.99.00, 7217, 7218, 7219, 7220, 7221, 7222, 7223, 7224, 7225,
7226, 7227, 7228, 7229, 7301.10.00, 7302.10, 7302.40.00, 7302.90.00, 7304,
7305, and 7306. Ranking is based on U.S. imports for consumption of steel
products.
[872]
USITC DataWeb/USDOC (accessed June 27, 2019). “Aluminum” here is defined as
imports for consumption under the following HTS 4- and 6-digit tariff lines
listed in U.S. note 19 for aluminum (provisions 9903.85.XX): HTS 7601, 7604,
7605, 7606, 7607, 7608, 7609, and 7616.99.51. Ranking is based on U.S. imports
for consumption of aluminum.
[883]
Proclamation 9705, 83 Fed. Reg. 11625 (March 15, 2018); Proclamation 9704, 83 Fed.
Reg. 11619 (March 15, 2018). This exemption for Canada and Mexico expired on
June 1, 2018, however, and on that date, the 25 percent tariff on steel imports
and the 10 percent tariff on aluminum imports for both countries went into
effect. Proclamation 9758, 83 Fed. Reg. 25849 (June 5, 2018).
[884]
USITC DataWeb/USDOC (accessed June 27, 2019). “Steel products” here are defined
as imports for consumption under the following HTS 4- and 6-digit tariff lines
listed in U.S. note 16 in chapter 99, subchapter III (provisions 9903.80.XX):
HTS 7206, 7207, 7208, 7209, 7210, 7211, 7212, 7213, 7214, 7215, 7216.10.00,
7216.21.00, 7216.22.00, 7216.31.00, 7216.32.00, 7216.33.00, 7216.40.00,
7216.50.00, 7216.99.00, 7217, 7218, 7219, 7220, 7221, 7222, 7223, 7224, 7225,
7226, 7227, 7228, 7229, 7301.10.00, 7302.10, 7302.40.00, 7302.90.00, 7304,
7305, and 7306. Ranking is based on U.S. imports for consumption of steel
products.
[885]
USITC DataWeb/USDOC (accessed June 27, 2019). “Aluminum” here is defined as imports
for consumption under the following HTS 4- and 6-digit tariff lines listed in
U.S. note 19 for aluminum (provisions 9903.85.XX): HTS 7601, 7604, 7605, 7606,
7607, 7608, 7609, and 7616.99.51. Ranking is based on U.S. imports for
consumption of aluminum.
[886]
The Executive Yuan is the executive branch, led by the premier, and the
Legislative Yuan is the legislature. See Republic of China (Taiwan), “
Executive Yuan
” (accessed June 7, 2019).