United States International Trade Commission
The Year in Trade 2017
Operation of the Trade Agreements Program
69th Report
August 2018
Publication Number: 4817
United States International Trade Commission
Commissioners
David S. Johanson, Chairman
Irving A. Williamson
Meredith M. Broadbent
Rhonda K. Schmidtlein
Jason E. Kearns
Catherine DeFilippo
Director, Office of Operations
William Powers
Director, Office of Economics
Address all communications to
Secretary to the Commission
United States International Trade Commission
Washington, DC 20436
This report was prepared principally by:
Project Leader
Joanne Guth, Office of Economics
Deputy Project Leader
Tamara Gurevich, Office of Economics
Office of Economics
Justino De La Cruz, Pamela Davis, Stephanie Fortune-Taylor, Alexander Hammer, Lin Jones, Grace Kenneally,
Alissa Tafti, Edward Wilson, and Heather Wickramarachi
Office of General Counsel
William W. Gearhart
Office of Industries
Arthur Chambers, Natalie Hanson, Tamar Khachaturian,
Sarah Oliver, and Laura Rodriguez
Office of Investigations
Brenna Cole, Mary Messer, and Salvatore Mineo
Office of Tariff Affairs and Trade Agreements
Donnette Rimmer and Daniel Shepherdson
Office of Unfair Import Investigations
David Lloyd
Office of Analysis and Research Services
Maureen Letostak, David Lundy, and Laura Thayn
Editorial Review
Judy Edelhoff and Peg Hausman
Statistical Review
Russell Duncan
Content Reviewer
Janis Summers
Administrative Support
Nabil Abbyad and Meryem Demirkaya
Help Desk and Customer Service Division (CIO)
Under the direction of
Arona Butcher, Chief
Country and Regional Analysis Division
Office of Economics
Preface
This report is the 69th in a series of annual reports
submitted to the U.S. Congress under section 163(c) of the Trade Act of 1974
(19 U.S.C. 2213(c)) and its predecessor legislation. Section 163(c) states that
“the International Trade Commission shall submit to the Congress at least once
a year, a factual report on the operation of the trade agreements program.”
This report is one of the principal means by which the U.S.
International Trade Commission provides Congress with factual information on
trade policy and its administration for 2017. The trade agreements program
includes “all activities consisting of, or related to, the administration of
international agreements which primarily concern trade and which are concluded
pursuant to the authority vested in the President by the Constitution” and by
congressional legislation.
+
-
Figure ES.1 U.S. trade balance in goods and services, 2003–17
Figure ES.2 U.S. goods and services trade with major bilateral trading partners, 2017
Figure 1.1 U.S. real gross domestic product, percentage change, 2013–17
Figure 1.2 Economic growth trends in the world, the United States, and major trading partners, 2015–17
Figure 1.3 Indexes of U.S. dollar exchange rates for selected major foreign currencies, daily, 2017
Figure 1.4 U.S. merchandise trade with the world, 2015–17
Figure 1.5 Leading U.S. export markets, by share, 2017
Figure 1.6 Leading U.S. import sources, by share, 2017
Figure 1.7 U.S. cross-border trade in private services with the world, 2015–17
Figure 1.8 Leading U.S. export markets for private services, by share, 2017
Figure 1.9 Leading U.S. import sources for private services, by share, 2017
Figure 2.1 Share of TAA petitions certified by industry sector in FY 2017
Figure 3.1 Timeline for the WTO Dispute Settlement Process
Figure 6.1 U.S. merchandise trade with the EU, 2013–17
Figure 6.2 U.S. cross-border trade in private services with the EU, 2013–17
Figure 6.3 U.S. merchandise trade with China, 2013–17
Figure 6.4 U.S. cross-border trade in private services with China, 2013–17
Figure 6.5 U.S. merchandise trade with Canada, 2013–17
Figure 6.6 U.S. cross-border trade in private services with Canada, 2013–17
Figure 6.7 U.S. merchandise trade with Mexico, 2013–17
Figure 6.8 U.S. cross-border trade in private services with Mexico, 2013–17
Figure 6.9 U.S. merchandise trade with Japan, 2013–17
Figure 6.10 U.S. cross-border trade in private services with Japan, 2013–17
Figure 6.11 U.S. merchandise trade with South Korea, 2013–17
Figure 6.12 U.S. cross-border trade in private services with South Korea, 2013–17
Figure 6.13 U.S. merchandise trade with India, 2013–17
Figure 6.14 U.S. cross-border trade in private services with India, 2013–17
Figure 6.15 U.S. merchandise trade with Taiwan, 2013–17
Figure 6.16 U.S. cross-border trade in private services with Taiwan, 2013–17
+
-
Table 1.1 U.S. merchandise trade with the world, by USITC digest sector, 2016–17 (million dollars)
Table 1.2 U.S. merchandise trade with major trading partners and the world, 2017 (million dollars)
Table 1.3 U.S. merchandise trade with major trading partners and the world, 2016–17 (million dollars)
Table 1.4 U.S. cross-border trade in private services with major trading partners and the world, 2017 (million dollars)
Table 2.1 Antidumping duty orders that became effective during 2017
Table 2.2 Countervailing duty orders that became effective during 2017
Table 2.3 TAA certifications, by region, FY 2017
Table 2.4 U.S. imports for consumption from Generalized System of Preferences (GSP) beneficiaries, 2015–17
Table 2.5 U.S. imports for consumption from Nepal, 2015–17
Table 2.6 U.S. imports for consumption from AGOA beneficiaries, 2015–17
Table 2.7 U.S. general imports of apparel under AGOA, by country, 2015–17
Table 2.8 U.S. imports for consumption from CBERA/CBTPA beneficiaries, 2015–17
Table 2.9 U.S. imports of apparel from Haiti, 2015–17
Table 3.1 WTO dispute settlement panels established during 2017 in which the United States was a party
Table 3.2 WTO dispute settlement panel and Appellate Body (AB) reports circulated and/or adopted in 2017 in which the United States was a party
Table 4.1 U.S. trade and investment framework agreements in 2017
Table 5.1 Total U.S. exports to FTA partners, by FTA partner, 2015–17
Table 5.2 Total U.S. imports from FTA partners, by FTA partner, 2015–17
Table 5.3 U.S. merchandise trade balance with FTA partners, by FTA partner, 2015–17
Table 5.4 U.S. imports for consumption that entered under FTA provisions, by FTA partner, 2015–17
Table 5.5 Ratio of U.S. imports for consumption under FTAs to U.S. general imports, by partner, 2015–17
Table 5.6 Timetable of major NAFTA negotiations, 2017–18
Table 5.7 Active files as of yearend 2017 under Articles 14 and 15 of the North American Agreement on Environmental Cooperation
Table 5.8 NAFTA Chapter 19 binational panels, active reviews through 2017
Table A.1 U.S. total exports to the world, by USITC digest sector, 2015–17
Table A.2 U.S. general imports from the world, by USITC digest sector, 2015–17
Table A.3 Leading U.S. total exports to the world, by HTS 6-digit subheading, 2015–17
Table A.4 Leading U.S. general imports from the world, by HTS subheading, 2015–17
Table A.5 U.S. merchandise trade with top 15 single-country trading partners, 2017
Table A.6 Top 15 U.S. single-country merchandise export markets, 2017
Table A.7 Top 15 U.S. single-country merchandise import sources, 2017
Table A.8 U.S. private services exports to the world, by category, 2015–17
Table A.9 U.S. private services imports from the world, by category, 2015–17
Table A.10 Antidumping cases active in 2017, by USITC investigation number
Table A.11 Antidumping duty orders and suspension agreements in effect as of December 31, 2017
Table A.12 Countervailing duty cases active in 2017, by USITC investigation number
Table A.13 Countervailing duty orders and suspension agreements in effect as of December 31, 2017
Table A.14 Reviews of existing antidumping and countervailing duty orders and suspended investigations completed in 2017, by date of completion
Table A.15 Section 337 investigations and related proceedings completed by the Commission during 2017 and those pending on December 31, 2017
Table A.16 Outstanding section 337 exclusion orders as of December 31, 2017
Table A.17 U.S. imports for consumption under GSP, by source, 2015–17
Table A.18 Value of U.S. imports for consumption under GSP, by USITC digest sector, 2015–17
Table A.19 Share of U.S. imports for consumption under GSP, by USITC digest sector, 2015–17
Table A.20 Leading U.S. imports for consumption under GSP, by HTS 6-digit subheading, 2015–17
Table A.21 Leading U.S. imports for consumption under AGOA (excluding GSP), by HTS 6-digit subheading, 2015–17
Table A.22 Leading U.S. imports for consumption under AGOA (excluding GSP), by source, 2015–17
Table A.23 Leading U.S. imports for consumption under CBERA, by HTS 6-digit subheading, 2015–17
Table A.24 U.S. imports for consumption under CBERA, by source, 2015–17
Table A.25 WTO dispute settlement cases to which the United States was a party, developments in 2017
Table A.26 NAFTA Chapter 19 substantive challenges to original and five-year review determinations of USITC and USDOC, developments in 2017
Table A.27 U.S. total exports to the EU, by USITC digest sector, 2015–17
Table A.28 U.S. general imports from the EU, by USITC digest sector, 2015–17
Table A.29 Leading U.S. total exports to the EU, by HTS 6-digit subheading, 2015–17
Table A.30 Leading U.S. total imports from the EU, by HTS 6-digit subheading, 2015–17
Table A.31 U.S. total exports to China, by USITC digest sector, 2015–17
Table A.32 U.S. general imports from China, by USITC digest sector, 2015–17
Table A.33 Leading U.S. total exports to China, by HTS 6-digit subheading, 2015–17
Table A.34 Leading U.S. general imports from China, by HTS 6-digit subheading, 2015–17
Table A.35 U.S. total exports to Canada, by USITC digest sector, 2015–17
Table A.36 U.S. general imports from Canada, by USITC digest sector, 2015–17
Table A.37 Leading U.S. total exports to Canada, by HTS 6-digit subheading, 2015–17
Table A.38 Leading U.S. general imports from Canada, by HTS 6-digit subheading, 2015–17
Table A.39 U.S. total exports to Mexico, by USITC digest sector, 2015–17
Table A.40 U.S. general imports from Mexico, by USITC digest sector, 2015–17
Table A.41 Leading U.S. total exports to Mexico, by HTS 6-digit subheading, 2015–17
Table A.42 Leading U.S. general imports from Mexico, by HTS 6-digit subheading, 2015–17
Table A.43 U.S. total exports to Japan, by USITC digest sector, 2015–17
Table A.44 U.S. general imports from Japan, by USITC digest sector, 2015–17
Table A.45 Leading U.S. total exports to Japan, by HTS 6-digit subheading, 2015–17
Table A.46 Leading U.S. total imports from Japan, by HTS 6-digit subheading, 2015–17
Table A.47 U.S. total exports to South Korea, by USITC digest sector, 2015–17
Table A.48 U.S general imports from South Korea, by USITC digest sector, 2015–17/a>
Table A.49 Leading U.S. total exports to South Korea, by HTS 6-digit subheading, 2015–17
Table A.50 Leading U.S. general imports from South Korea, by HTS 6-digit subheading, 2015–17
Table A.51 U.S. total exports to India, by USITC digest sector, 2015–17
Table A.52 U.S. general imports from India, by USITC digest sector, 2015–17
Table A.53 Leading U.S. total exports to India, by HTS 6-digit subheading, 2015–17
Table A.54 Leading U.S. general imports from India, by HTS 6-digit subheading, 2015–17
Table A.55 U.S. total exports to Taiwan, by USITC digest sector, 2015–17
Table A.56 U.S. general imports from Taiwan, by USITC digest sector, 2015–17
Table A.57 Leading U.S. total exports to Taiwan, by HTS 6-digit subheading, 2015–17
Table A.58 Leading U.S. general imports from Taiwan, by HTS 6-digit subheading, 2015–17
Table B.1 U.S. trade balance in goods and services, 2003–17 (million dollars)
Table B.2 U.S. goods and services trade with major bilateral trade partners, 2017 (million dollars)
Table B.3 U.S. real gross domestic product, percentage change, 2013–17
Table B.3 U.S. real gross domestic product, percentage change, 2013–17
Table B.4 Economic (GDP) growth trends in the world, the United States, and major trading partners 2015–17 (percent)
Table B.5 U.S. merchandise trade with major trading partners and the world, 2013–17
Table B.6 U.S. merchandise trade with major trading partners and the world, 2017
Table B.7 U.S. private cross-border services trade with selected major trading partners and the world
Table B.8 U.S. private cross-border services trade with major trading partners and the world, 2017
Table B.9 TAA petitions certified, by industry sector, FY 2017
Abbreviations and Acronyms
|
Acronyms
|
Term
|
|
AGOA
|
African Growth and Opportunity Act
|
|
AIT
|
American Institute in Taiwan
|
|
APEC
|
Asia-Pacific Economic Cooperation forum
|
|
ASEAN
|
Association of Southeast Asian Nations
|
|
ATAP
|
U.S.-Israel Agreement on Trade in Agricultural Products
|
|
BDCs
|
beneficiary developing countries
|
|
BEA
|
Bureau of Economic Analysis (USDOC)
|
|
Brexit
|
Britain’s vote to leave the European Union
|
|
CAFTA-DR
|
Dominican Republic-Central America-United States Free Trade Agreement
|
|
CARICOM
|
Caribbean Community and Common Market
|
|
CBERA
|
Caribbean Basin Economic Recovery Act
|
|
CBP
|
Customs and Border Protection (CBP)
|
|
CBTPA
|
Caribbean Basin Trade Partnership Act
|
|
CEC
|
Commission for Environmental Cooperation (NAFTA)
|
|
CED
|
Comprehensive Economic Dialogue (U.S.-China)
|
|
CITES
|
Convention on International Trade in Endangered Species of Wild Fauna and Flora
|
|
CLC
|
Commission for Labor Cooperation (NAFTA)
|
|
CNL
|
competitive need limitation
|
|
COMESA
|
Common Market for Eastern and Southern Africa
|
|
CRS
|
Congressional Research Service
|
|
CSPV
|
crystalline silicon photovoltaic (cells)
|
|
CTI
|
Committee on Trade and Investment (APEC)
|
|
CTPA
|
U.S.-Colombia Trade Promotion Agreement
|
|
CVD
|
countervailing duty
|
|
DFAT
|
Department of Foreign Affairs and Trade (Australia)
|
|
DSB
|
Dispute Settlement Body (WTO)
|
|
ECOWAS
|
Economic Community of West African States
|
|
EDA
|
Economic Development Administration (USDOC)
|
|
EGA
|
Environmental Goods Agreement
|
|
EIA
|
U.S. Energy Information Administration
|
|
EIAP
|
Earned Import Allowance Program
|
|
EIU
|
Economist Intelligence Unit
|
|
ETA
|
Employment and Training Administration (USDOL)
|
|
EU
|
European Union
|
|
FAS
|
Foreign Agricultural Service (USDA)
|
|
FDA
|
Food and Drug Administration
|
|
FDI
|
foreign direct investment
|
|
Fed. Reg.
|
Federal Register
|
|
FMCSA
|
Federal Motor Carrier Safety Administration
|
|
FTA
|
free trade agreement
|
|
FTAAP
|
Free Trade Area of the Asia-Pacific
|
|
FTC
|
Free Trade Commission (under U.S. FTAs)
|
|
FY
|
fiscal year
|
|
GATS
|
General Agreement on Trade in Services
|
|
GATT
|
General Agreement on Tariffs and Trade
|
|
GCC
|
Cooperation Council for the Arab States of the Gulf (Gulf Cooperation Council)
|
|
GDP
|
gross domestic product
|
|
GMP
|
good manufacturing practice
|
|
GPA
|
Agreement on Government Procurement (WTO)
|
|
GSP
|
Generalized System of Preferences
|
|
GVC
|
global value chain
|
|
HELP
|
Haiti Economic Lift Program
|
|
HOPE
|
Haitian Hemispheric Opportunity through Partnership Encouragement Act
|
|
HTS
|
Harmonized Tariff Schedule of the United States
|
|
ICSID
|
International Centre for Settlement of Investment Disputes
|
|
ICT
|
information and communications technology
|
|
ILAB
|
Bureau of International Labor Affairs (USDOL)
|
|
IMF
|
International Monetary Fund
|
|
IP
|
intellectual property
|
|
IPR
|
intellectual property rights
|
|
ITA
|
Information Technology Agreement (WTO)
|
|
JCCT
|
Joint Commission on Commerce and Trade
|
|
KORUS
|
U.S.-Korea Free Trade Agreement
|
|
LDBDC
|
least-developed beneficiary developing country
|
|
LDCs
|
lesser-developed countries
|
|
LTFV
|
less than fair value
|
|
MAFF
|
Ministry of Agriculture, Forestry, and Fisheries (Japan)
|
|
MOU
|
memorandum of understanding
|
|
MSMEs
|
micro, small, and medium-sized enterprises
|
|
MRA
|
mutual recognition agreement
|
|
MRL
|
maximum residue limit
|
|
mt
|
metric tons
|
|
n.d.
|
not dated
|
|
NAALC
|
North American Agreement on Labor Cooperation (NAFTA)
|
|
NAFTA
|
North American Free Trade Agreement
|
|
NAO
|
National Administrative Office (NAFTA)
|
|
n.e.s.o.i.
|
not elsewhere specified or included
|
|
n.i.e.
|
not included elsewhere
|
|
NTPA
|
Nepal Trade Preference Act
|
|
NTPP
|
Nepal Trade Preference Program
|
|
NTR
|
normal trade relations (U.S. equivalent to most-favored-nation treatment)
|
|
OECD
|
Organisation for Economic Co-operation and Development
|
|
OIE
|
World Organisation for Animal Health (Office International des Epizooties)
|
|
OPEC
|
Organization of the Petroleum Exporting Countries
|
|
OTEXA
|
Office of Textiles and Apparel (USDOC)
|
|
PSU
|
Policy Support Unit (APEC)
|
|
PTPA
|
U.S.-Peru Trade Promotion Agreement
|
|
Pub. L.
|
Public Law
|
|
RTA
|
regional trade agreement
|
|
ED
|
Strategic
and Economic Dialogue (U.S.-China)
|
|
SACU
|
Southern Africa Customs Union
|
|
SAT
|
Tax
Administration Service (Mexico)
|
|
SMEs
|
small and medium-sized enterprises
|
|
SPS
|
sanitary
and phytosanitary (standards)
|
|
SSA
|
sub-Saharan Africa
|
|
TAA
|
Trade
Adjustment Assistance
|
|
TAAEA
|
Trade Adjustment Assistance Extension Act
|
|
TAARA
|
Trade
Adjustment Assistance Reauthorization Act of 2015
|
|
TEC
|
Transatlantic Economic Council
|
|
TECRO
|
Taipei
Economic and Cultural Representative Office in the United States
|
|
TICFA
|
Trade and Investment Cooperation Forum Agreement
|
|
TIFA
|
Trade
and Investment Framework Agreement
|
|
TiSA
|
Trade in Services Agreement
|
|
TiVA
|
Trade
in Value Added (OECD–WTO initiative)
|
|
TPA
|
trade promotion agreement
|
|
TPEA
|
Trade
Preferences Extension Act
|
|
TPF
|
U.S.-India Trade Policy Forum
|
|
TPP
|
Trans-Pacific
Partnership
|
|
TPLs
|
tariff preference levels
|
|
TRAs
|
Trade
Readjustment Allowances
|
|
TRIPS
|
Trade-Related Aspects of Intellectual Property
Rights agreement (WTO)
|
|
TRQ
|
tariff-rate
quota
|
|
TTIP
|
Transatlantic Trade and Investment Partnership
(U.S.-EU)
|
|
UN
|
United
Nations
|
|
U.S.C.
|
U.S. Code
|
|
USCC
|
U.S.-China
Economic and Security Review Commission
|
|
USDA
|
U.S. Department of Agriculture
|
|
USDHS
|
U.S.
Department of Homeland Security
|
|
USDOC
|
U.S. Department of Commerce
|
|
USDOL
|
U.S.
Department of Labor
|
|
USDOS
|
U.S. Department of State
|
|
USDOT
|
U.S.
Department of Transportation
|
|
USITC
|
U.S. International Trade Commission
|
|
USTR
|
U.S.
Trade Representative
|
|
WAEMU
|
West African Economic and Monetary Union
|
|
WTO
|
World
Trade Organization
|
Executive Summary
The level of U.S. imports and U.S. exports of goods and
services depends on many factors, including the strength of the U.S. and global
economies. Growth in these economies contributes to growth in cross-border
trade. The rate of global economic growth increased in 2017, rising from 2.5
percent in 2016 to 3.3 percent in 2017. Economic growth in the United States
also increased in 2017: U.S. real gross domestic product (GDP) grew 2.3 percent
in 2017, compared to an increase of 1.5 percent in 2016. Overall global
economic growth was fueled by growth of advanced economies such as the United
States and top trading partners including the European Union (EU), Canada, and
Japan. Some emerging and developing economies—e.g., China, South Korea, and
Taiwan—also contributed to global economic growth. India and Mexico, however,
grew at a slower rate in 2017 than in 2016.
Both U.S. exports and U.S. imports of goods increased in
value in 2017. The value of U.S. merchandise exports totaled $1,546.7 billion
in 2017, up 6.6 percent ($95.7 billion) from $1,451.0 billion in 2016. The
value of U.S. merchandise imports totaled $2,342.9 billion in 2017, up 7.1
percent ($155.1 billion) from $2,187.8 billion in 2016. The largest increase in
both U.S. imports and U.S. exports was in energy-related products. In
particular, the increase in the value of U.S. imports of crude petroleum was
due to the increase in the price of U.S. crude, whereas the increase in the
value of U.S. exports of crude was driven by increases in both the price and
volume of U.S. crude exports, resulting in a decline in the sector’s deficit to
$4.5 billion. The agricultural sector was the only goods sector to experience a
trade surplus in 2017, with $5.7 billion more in exports than imports. The trade
deficit in the other sectors of the U.S. economy increased. Overall, U.S.
imports increased more than U.S. exports in terms of value, resulting in an
increase in the U.S. merchandise trade deficit from $752.5 billion in 2016 to
$811.2 billion in 2017 (figure ES.1).
U.S. two-way cross-border trade in private services, which
excludes exports and imports of government goods and services n.i.e., increased
5.0 percent to $1,277.7 billion in 2017. U.S. exports of private services grew
3.8 percent to $761.7 billion in 2017, while U.S. imports of private services
grew 6.8 percent to reach $516.0 billion in 2017. As a result, the U.S. surplus
in private services fell from $250.4 billion in 2016 to $245.7 billion in 2017.
Figure
ES.1
U.S. trade balance in
goods and services, 2003–17
Source:
USDOC, BEA, U.S. International Transactions, Services, & IIP, “
Table 1.2: U.S.
International Transactions, Expanded Detail
,” March 21, 2018.
Note:
Underlying data can be found in appendix table
B.1
.
In 2017, the U.S. dollar depreciated 6.3 percent against a
broad trade-weighted index of major foreign currencies, including against some
major emerging-market currencies, such as the Mexican peso and the Chinese
yuan. Between January 1 and December 31, 2017, the U.S. dollar depreciated by
12.0 percent against the euro, 9.4 percent against the United Kingdom (UK)
pound, 6.5 percent against the Chinese yuan, and 6.1 percent against the
Mexican peso.
Key Trade Developments in 2017
Administration of U.S. Trade Laws and Regulations
Safeguard actions:
The U.S. International
Trade Commission (the Commission) conducted two new safeguard investigations
during 2017, both under the global safeguard provisions in sections 201–204 of
the Trade Act of 1974. The first investigation concerned imports of crystalline
silicon photovoltaic cells (CSPV cells); the second, imports of large
residential washers (washers). Both investigations were conducted following
receipt of a petition from a domestic producer of each article. The Commission
made affirmative injury determinations in each investigation and, to address
the serious injury, recommended remedy measures to the President.
Section 301:
There were two ongoing
investigations in 2017 under section 301 of the Trade Act of 1974. The first
investigation was instituted in 1987 and concerned various EU meat hormone
directives, which prohibit the use of certain hormones that promote growth in farm
animals. Following a successful challenge at the World Trade Organization
(WTO), the United States imposed additional duties on certain imports from the
EU in 1999. In 2012, the United States and the EU signed a provisional
settlement, and the United States lifted the additional duties. In December
2016, representatives of the U.S. beef industry filed a request with the Office
of the U.S. Trade Representative (USTR) asking that the additional duties be
reinstated, and USTR initiated a process to consider whether to reinstate the
additional duties.
The second investigation was self-initiated by the USTR in
August 2017. The investigation is considering whether a wide variety of acts,
policies, and practices by the government of China related to technology transfer,
intellectual property, and innovation are actionable under section 301 of the
1974 Trade Act. Under the statute, USTR generally has up to 12 months from the
date of initiation to determine whether the statutory requirements under
section 301 have been met and, if so, what action to take. The China technology
transfer 301 investigation was ongoing at the end of 2017.
Special 301:
In the
2017 Special 301
Report
, USTR examined the adequacy and effectiveness of intellectual
property rights (IPR) protection in more than 100 countries. The
2017
Special 301 Report
listed 11 countries on the priority watch list
(Algeria, Argentina, Chile, China, India, Indonesia, Kuwait, Russia, Thailand,
Ukraine, and Venezuela) and 23 countries on the watch list. In December 2017,
USTR issued the
2016 Out-of-Cycle Review of Notorious Markets
report
, which highlighted over 25 internet-based
markets and 12 countries with physical marketplaces (e.g., shops) that
reportedly engage in or facilitate substantial copyright piracy and trademark
counterfeiting.
Antidumping duty investigations:
The
Commission instituted 58 new antidumping investigations and made 54 preliminary
determinations and 36 final determinations during 2017. Antidumping duty orders
were issued by the U.S. Department of Commerce (USDOC) in 33 of the final
investigations on 15 products from 16 countries.
Countervailing duty investigations:
The
Commission instituted 26 new countervailing duty investigations, and made 17
preliminary determinations and 16 final determinations during 2017.
Countervailing duty orders were issued by the USDOC in 11 of the final
investigations on 9 products from 5 countries.
Sunset reviews:
During 2017, the Commission
instituted 32 sunset reviews of existing antidumping duty and countervailing
duty orders and suspension agreements that had been in effect for five years,
as required by law. The Commission completed 46 reviews, resulting in the
continuation of 45 antidumping duty and countervailing duty orders for up to
five additional years.
Section 129 investigations:
Section 129 of
the U.S. Uruguay Round Agreements Act established a procedure by which the
Administration may respond to certain adverse WTO panel or Appellate Body
reports. On December 18, 2017, USDOC initiated a section 129 proceeding in
connection with the recommendations and rulings of the WTO Dispute Settlement
Body (DSB) in
United States—Anti-Dumping and Countervailing Measures on
Large Residential Washers from Korea
(DS464). The section 129 proceeding
is expected to be completed in 2018.
Section 337 investigations:
During calendar
year 2017, there were 130 active section 337 investigations and ancillary
proceedings alleging unfair import practices, such as patent infringement.
Seventy-four of these active investigations were instituted in 2017. Of the 74
new proceedings, 59 were new section 337 investigations and 15 were new
ancillary (secondary) proceedings relating to previously concluded
investigations. The Commission completed a total of 64 investigations and
ancillary proceedings under section 337 in 2017, and issued 5 general exclusion
orders, 12 limited exclusion orders, and 30 cease and desist orders.
Commission proceedings in 2017 involved a wide variety of
products. As in prior years, technology products were the single largest
category, with about 38 percent of the active proceedings involving computer
and telecommunications equipment and another 6 percent involving consumer
electronics. In addition, pharmaceuticals and medical devices were at issue in
about 13 percent of the active proceedings and automotive, transportation, and
manufacturing products were at issue in about 10 percent of the active
proceedings.
National Security Investigations:
In April
2017, the U.S. Secretary of Commerce initiated two new investigations under the
national security provisions of section 232 of the Trade Expansion Act of 1962,
the first such investigations since 2001. The first investigation concerned
imports of steel and the second concerned imports of aluminum. Both
investigations were in progress at the end of 2017.
Trade Adjustment Assistance (TAA):
In
fiscal year (FY) 2017, the U.S. Department of Labor (USDOL) received 1,037
petitions for TAA, down 30.8 percent from the 1,498 petitions received in FY
2016. The USDOL certified 844 petitions covering 94,017 workers as eligible for
TAA, and denied 234 petitions covering 32,038 workers. In FY 2016, the latest
data available, USDOC certified 68 petitions as eligible for assistance under
the TAA for Firms program, and approved 75 adjustment proposals.
Trade Preference Programs
Generalized System of Preferences (GSP):
U.S. imports under GSP increased 11.9 percent, reaching $21.2 billion in 2017.
These imports accounted for 9.9 percent of total U.S. imports from GSP
beneficiary countries and 0.9 percent of total U.S. imports. The top five
beneficiary countries (India, Thailand, Brazil, Indonesia, and Turkey)
accounted for 74.5 percent of GSP imports.
Based on the 2016/2017 GSP Annual Review directed by USTR,
new duty-free status under the GSP program was extended to all GSP
beneficiaries for 23 categories of travel goods (including luggage, backpacks,
handbags, and wallets) that had become eligible for duty-free treatment when
exported by least-developed beneficiary developing countries and African Growth
and Opportunity Act (AGOA) countries in 2016. On December 22, 2017, Argentina’s
GSP eligibility was reinstated after a nearly six-year suspension. Ukraine’s
GSP eligibility was partially removed on December 22, 2017, due to failure to
adequately protect IPRs. Also, in June 2017, USTR self-initiated a country
practice review of Bolivia’s eligibility for GSP benefits because of worker
rights issues.
Nepal Trade Preference Act (NTPA):
The NTPA
was implemented in December 2016 to improve Nepal’s export competitiveness and
help Nepal’s economic recovery following a 2015 earthquake. In 2017, the first
full year that the NTPA was in effect, U.S. imports from Nepal under NTPA were
$2.3 million, accounting for 2.5 percent of total U.S. imports from Nepal.
African Growth and Opportunity Act (AGOA):
In 2017, 38 sub-Saharan African (SSA) countries were eligible for AGOA
benefits. An additional two countries—The Gambia and Swaziland—were
re-designated as eligible for AGOA benefits effective December 22, 2017,
bringing the total as of yearend 2017 to 40 SSA countries. Of these countries,
27 were also eligible for AGOA textile and apparel benefits for all or part of
2017. Togo, the host of the 16th annual AGOA Forum held on August 8–10, 2017,
became eligible for apparel benefits on August 22, 2017. Also, USTR initiated
an out-of-cycle review of AGOA eligibility for Rwanda, Tanzania, and Uganda on
June 20, 2017.
In 2017, imports entering the United States exclusively
under AGOA (excluding GSP) were valued at $12.5 billion, a 32.4 percent
increase from 2016. The increase in U.S. imports under AGOA in 2017 can be
attributed to an increase in the value and quantity of imports of crude
petroleum. An additional $1.3 billion from AGOA beneficiary countries entered the
United States duty-free under GSP. In total, AGOA and GSP preference programs
accounted for 55.4 percent of total imports from AGOA beneficiary countries in
2017.
Caribbean Basin Economic Recovery Act (CBERA):
At yearend 2017, 17 countries and dependent territories were eligible for CBERA
preferences, and 8 of those countries were designated eligible for Caribbean
Basin Trade Partnership Act (CBTPA) preferences. In 2017, the value of U.S.
imports under CBERA (including CBTPA) increased by 10.3 percent to $961
million, mainly reflecting an increase in U.S. imports of methanol and
polystyrene from Trinidad and Tobago and The Bahamas, respectively, which are
both major imports under CBERA. U.S. imports under CBERA of crude petroleum
continued to decline as U.S. production increased. Trinidad and Tobago was the
leading supplier of U.S. imports under CBERA in 2017, followed by Haiti.
Haiti initiatives:
While
the
value of U.S. imports of apparel from Haiti increased 2.1 percent to $866.7
million in 2017, the value of such imports entering under the Haitian Hemisphere
Opportunity through Partnership Encouragement Act of 2006 and 2008 (HOPE Acts)
increased 7.9 percent to $577.0 million. The latter accounted for just over
two-thirds of total U.S. apparel imports that entered from Haiti duty-free,
with the remainder entering under CBERA. Garments of manmade fibers accounted
for a growing share of U.S. apparel imports from Haiti, in contrast to the
declining share accounted for by cotton apparel. The main factors in the
overall level of U.S. apparel imports from Haiti are trade preferences under
the HOPE Acts, proximity to the U.S. market, low labor costs, and a recent
infusion of foreign investment in Haiti.
World Trade Organization (WTO)
WTO developments:
The 11th Ministerial Conference of the World Trade Organization was held
December 10–13, 2017, in Buenos Aires, Argentina. As a result of this
conference, the ministers decided to open negotiations on possible disciplines
on fisheries subsidies; WTO members agreed to continue their moratorium on
collecting customs duties on electronic commerce transactions; and members
agreed to continue their moratorium on certain forms of dispute settlement
cases—so-called nonviolation and situation complaints—involving IPRs. While
members agreed at the Ministerial Conference to consider establishing a formal
working group to discuss micro, small, and medium-size enterprises, they were
unable to reach agreement on the issue of public stockholding of foodstuffs for
food security purposes, as well as a number of issues involving ongoing
negotiations in the Doha Development Agenda.
In other WTO developments, WTO membership remained at 164 in
2017, with South Sudan requesting WTO observer status in November 2017. Roberto
Azevêdo was reappointed as WTO Director-General for a second term of four
years, which began in September 2017. On February 22, 2017, the WTO Agreement
on Trade Facilitation entered into force, after ratification by a two-thirds
majority of WTO members. WTO members that participated in the 2012–15
negotiations to expand the so-called WTO Information Technology Agreement
implemented their second set of tariff reductions for over 200 information
technology products on July 1, 2017. Negotiation for an agreement on trade in
environmental goods remained at an impasse in 2017.
WTO dispute settlement:
During 2017, WTO
members filed 17 requests for WTO dispute settlement consultations in new
disputes, which was about the average for the five preceding years. The United
States was the complainant in 3 of the 17 requests filed during 2017, and the
named respondent in 4. Two of the 3 new requests filed by the United States
during 2017 concerned measures maintained by the Canadian province of British
Columbia governing the sale of wine in grocery stores. The third request was related
to subsides paid by China to producers of primary aluminum. The United States
was the named respondent in 4 new disputes—3 filed by Canada on U.S.
countervailing duty and antidumping measures, and 1 filed by Turkey on U.S.
countervailing duty measures.
Four new dispute settlement panels were established during
2017 in which the United States was either the complainant or the respondent.
The United States was the complaining party in two disputes involving China,
and the responding party in two disputes filed by India and Turkey,
respectively.
In the President’s
2018
Trade Policy Agenda and 2017 Annual Report
, the United States summarized
its concerns about the WTO dispute settlement process. In particular, the
report described longstanding concerns that WTO dispute settlement panels and
the Appellate Body have been adding to or diminishing the rights and
obligations of WTO members under the WTO Agreement by not applying the WTO
Agreement as written. The report also described a number of other concerns,
including concerns raised at 2017 WTO Dispute Settlement Body meetings about
service on the Appellate Body by persons who are no longer Appellate Body
members. Since the summer of 2017, U.S. officials have had the view that this
issue must be resolved before the United States will consider supporting new
appointments to the Appellate Body.
OECD, APEC, TiSA, and TIFAs
Organisation for Economic Co-operation and
Development (OECD):
The OECD ministerial council meeting was held in
Paris, France, on June 7–8, 2017. Discussions centered on how to share the
gains from globalization more broadly. In 2017, the OECD Trade Committee
focused its work on broad areas involving trade and the digital economy, as
well as on trade and investment matters. At the September 2016 G20 Summit, the
OECD was tasked by G20 ministers with actively facilitating the work of the
Global Forum on Steel Excess Capacity. November 2017 marked the Global Forum’s
first ministerial meeting
.
Asia-Pacific Economic Cooperation (APEC)
:
Under Vietnam’s leadership in 2017, cooperation among APEC member economies
focused on “Creating New Dynamism, Fostering a Shared Future.” According to
APEC, this cooperation pursued the following four priorities: “promoting
sustainable, innovative and inclusive growth; deepening regional economic
integration; strengthening micro, small and medium enterprises’ (MSMEs)
competitiveness and innovation in the digital age; and enhancing food security
and sustainable agriculture in response to climate change.”
APEC highlights in 2017 included the completion of three
major reports: two on digital trade and electronic commerce (e-commerce), and
one on the investment climate for global value chains (GVCs). Other important
highlights included (1) projects and a workshop on facilitating MSMEs’ use of
IPRs and promoting MSMEs’ participation in the global economy through GVCs and
e-commerce; (2) case studies on environmental services; and (3) efforts to
advance the realization of the Free Trade Area of the Asia Pacific through
capacity building and an information-sharing mechanism.
Trade in Services Agreement (TiSA):
In
2017, the 23 participants conducted no new rounds of trade negotiations, and as
of the end of 2017, none were scheduled for 2018.
Trade and Investment Framework Agreements (TIFAs)
:
TIFAs provide a framework to expand trade and investment and a forum to resolve
trade and investment issues between the United States and various trading
partners. By yearend 2017, the United States had entered into 57 TIFAs,
including a new TIFA with Paraguay on January 13, 2017. A number of TIFA
Council meetings took place in 2017, including those with Central Asia,
Afghanistan, Cambodia, Indonesia, Laos, Malaysia, Nepal, the Philippines,
Thailand, and Vietnam.
U.S. Free Trade Agreements
U.S. free trade agreements (FTAs) in force in 2017:
The United States was party to 14 FTAs involving a total of 20 countries as of
December 31, 2017. Starting with the most recent agreement, the FTAs in force
during 2017 were Panama (which entered into force in 2012); Colombia (2012);
South Korea (2012); Oman (2009); Peru (2009); several countries of Central
America and the Dominican Republic (CAFTA-DR), which includes the Dominican
Republic, El Salvador, Guatemala, Honduras, and Nicaragua (2006–07) and Costa
Rica (2009); Bahrain (2006); Morocco (2006); Australia (2005); Chile (2004);
Singapore (2004); Jordan (2001); Canada and Mexico (1994); and Israel (1985).
FTA merchandise trade flows with FTA partners:
In 2017, total two-way (exports and imports) merchandise trade between the
United States and its 20 FTA partners was $1.5 trillion, which accounted for
39.0 percent of total U.S. merchandise trade with the world. U.S. trade with
the NAFTA countries (Canada and Mexico) continued to contribute the most to all
U.S. trade with FTA partners, accounting for $1.1 trillion, or 75.1 percent.
U.S. exports to the NAFTA countries rose 5.8 percent to $525.4 billion. U.S.
imports from the NAFTA countries rose 7.4 percent to $614.0 billion from 2016
to 2017. As a result, the U.S. merchandise trade deficit with its NAFTA
partners increased by 17.6 percent to $88.6 billion.
U.S. trade with non-NAFTA FTA partners was valued at $378.0
billion in 2017, which was a 3.7 percent increase from 2016. U.S. exports to
these FTA partners increased 8.8 percent to $195.0 billion, while U.S. imports
from these partners increased 3.7 percent to $183.0 billion from 2016 to 2017.
As result, the U.S. merchandise trade surplus with these countries recovered to
its 2015 level, rising 333.9 percent to $12.0 billion in 2017.
The value of imports that entered into the United States
under FTAs and subject to FTA duty reductions and eliminations totaled $385.1
billion in 2017, a rise of 2.8 percent from 2016. Imports subject to FTA duty
reductions and eliminations accounted for nearly half (48.3 percent) of total
imports from FTA partners in 2017 and 16.5 percent of total U.S. imports from
the world. (The majority of U.S. imports from FTA partners that do not enter
under an FTA generally enter free of duty under normal trade relations rates,
although some also face duties.) Imports under the FTA with Chile, which grew
$1.3 billion (26.6 percent), represented the largest percentage increase, while
imports from Mexico accounted for the greatest change in value, rising by $11.9
billion (7.0 percent). Imports under FTAs with Peru and Bahrain also increased
significantly, by 24.5 percent ($651 million) and 16.5 percent ($82 million),
respectively.
FTA negotiations:
In January 2017, the
United States formally withdrew from the recently signed Trans-Pacific
Partnership agreement with 11 Pacific Rim partners. Also in January 2017, U.S.
and EU officials issued a joint report on the status of negotiations towards a
Transatlantic Trade and Investment Partnership (TTIP). The report highlighted
areas that still needed “significant work.” No TTIP negotiations were held in
2017.
Developments with FTAs already in force:
U.S. officials met with a number of partners representing member states of the
14 U.S. FTAs in force during 2017. Discussions with U.S. partners focused
largely on the topics of labor issues and environmental provisions included in
most of these agreements. Under the U.S.-Korea FTA, two special sessions of the
Joint Committee were held in 2017 to discuss possible amendments and
modifications to the agreement.
NAFTA developments:
On May 18, 2017, USTR
notified Congress that the President intended to initiate negotiations with
Canada and Mexico to modernize NAFTA. The negotiations began on August 16,
2017, in Washington, DC, with two primary goals: (1) to update NAFTA with
modern provisions on digital trade, intellectual property, cybersecurity, good
regulatory practices, and treatment of state-owned enterprises; and (2) to
rebalance NAFTA and reduce the U.S. trade deficit with Canada and Mexico. By
the end of 2017, five negotiating rounds had been completed.
At the end of 2017, two complaint files remained active
under Articles 14 and 15 of the North American Agreement on Environmental
Cooperation. One, which was submitted in 2016, involved Mexico, and another,
submitted in 2017, involved Canada. In 2017, there were three submissions under
review at the North American Agreement on Labor Cooperation, two involving
Mexico, and one involving the United States.
NAFTA dispute settlement:
In 2017, there
were 5 active Chapter 11 cases (investor-state disputes) filed against the
United States, 4 of them filed by Canadian investors and 1 filed by Mexican
investors; 11 filed by U.S. investors against Canada; and 4 filed against Mexico—3
by U.S. investors and 1 by Canadian investors. At the end of 2017, the NAFTA
Secretariat listed six binational panels active under Chapter 19 (Review and
Dispute Settlement in Anti-dumping and Countervailing Duty Matters); these are
reviews of final determinations made by national authorities in antidumping and
countervailing duty cases. Two of the reviews concern cases filed by the United
States contesting Mexico’s determinations; three concern cases filed by Canada
contesting U.S. determinations; and the sixth concerns a case filed by Mexico
contesting U.S. determinations.
Trade Activities with Major Trading Partners
This report reviews U.S. bilateral trade relations with its
largest trading partners each year. This year, the report covers the following
eight trading partners: the EU, China, Mexico, Canada, Japan, South Korea,
India, and Taiwan (ordered by the value of their two-way merchandise trade).
For each trading partner, the chapter summarizes U.S. bilateral trade,
including two-way merchandise and private services trade (figure ES.2). Each
partner description is followed by summaries of the major bilateral
trade-related developments during 2017.
Figure ES.2
U.S. goods and services
trade with major bilateral trading partners, 2017
Source:
USITC DataWeb/USDOC (accessed April 26, 2018); USDOC, BEA, Interactive data,
International Transactions, Services, & IIP, International Transactions,
Tables 1.2 and 1.3, March 21, 2018 (accessed April 26, 2018).
Note:
Underlying data can be found in appendix table
B.2
.
European Union
The EU as a single entity continued to be the United States’
largest merchandise trading partner in 2017. U.S. two-way (exports plus
imports) merchandise trade with the EU increased 4.7 percent to $718.5 billion
in 2017, accounting for 18.5 percent of total U.S. merchandise trade. U.S.
exports to the EU were $283.5 billion, which ranked the EU as the top U.S.
export market for the second year in a row, surpassing Canada. U.S. merchandise
imports from the EU were $434.9 billion, second to those from China. Both U.S.
exports and U.S. imports with the EU increased in 2017, but U.S. imports grew
more, widening the U.S. merchandise trade deficit with the EU from $146.8
billion in 2016 to $151.4 billion in 2017. Leading U.S. exports to the EU
included civilian aircraft, engines, and parts; medicaments (medicines);
refined petroleum products; crude petroleum; and certain immunological
products. Leading U.S. imports were passenger motor vehicles, medicaments,
parts of turbojets and turbopropellers, light oils, and airplanes and other
aircraft.
The EU was also the United States’ largest trading partner
in terms of private services in 2017, accounting for 33.4 percent of total U.S.
trade in private services. U.S. services imports increased more than U.S.
services exports, shrinking the U.S. trade surplus in services with the EU from
$61.7 billion in 2016 to $49.9 billion in 2017.
Among the important U.S.-EU trade developments in 2017 were
a bilateral agreement on insurance and reinsurance measures, the first annual
review of the functioning of the U.S.-EU Privacy Shield, and an updated mutual
recognition agreement on good manufacturing practices in pharmaceutical
products. Under the framework of the Transatlantic Economic Council, the eighth
workshop for small- and medium-sized enterprises was held. As noted earlier,
TTIP negotiations remained dormant in 2017.
China
In 2017, China remained the United States’ largest single-country
trading partner based on two-way merchandise trade, accounting for 16.4 percent
of total U.S. merchandise trade. U.S. two-way merchandise trade with China
amounted to $635.9 billion in 2017, an increase of 10.0 percent from the $578.2
billion recorded in 2016. The U.S. merchandise trade deficit with China
remained higher than the U.S. trade deficit with any other trading partner in
2017, amounting to $375.2 billion. Its $28.2 billion increase (8.1 percent)
relative to the year before reflected a $42.3 billion increase in U.S.
merchandise imports from China that outpaced a $14.8 billion increase in U.S.
merchandise exports to China in 2017. Leading U.S. exports to China in 2017
were civilian aircraft, engines, and parts; soybeans; small passenger motor
vehicles; petroleum; and semiconductors. Leading U.S. imports from China were
cellphones; portable computers and tablets; telecommunications equipment;
computer parts and accessories; and tricycles, scooters, and related toys.
In 2017, China continued to be the United States’
fourth-largest single-country trading partner based on two-way services trade
of $73.0 billion. U.S. services trade with China amounted to 5.7 percent of
total U.S. cross-border services trade in 2017. The U.S. cross-border trade surplus
in services with China increased $600 million in 2016 to $38.2 billion.
However, the rate of growth in the United States’ services imports from China
outpaced that of the United States’ services exports to China. From 2016 to 2017,
U.S. services exports to China grew by $1.9 billion, or 3.6 percent, while U.S.
services imports from China grew by $1.4 billion, or 8.6 percent.
In 2017, the most prominent bilateral trade issues were
discussed in the context of a newly formed U.S.-China Comprehensive Economic
Dialogue (CED). Major topics addressed by U.S. and Chinese officials in the CED
in 2017 included China’s protection and enforcement of IPRs; Chinese technology
transfer policies and practices; and the implementation of China’s new
Cybersecurity Law and China’s new
Standardization
Law
.
Canada
In 2017, Canada was the United States’ second-largest
single-country trading partner after China for the third consecutive year. The
value of U.S. merchandise trade with Canada rose 7.0 percent to $582.4 billion
in 2017, accounting for 15.0 percent of total U.S. merchandise trade with the
world. Both U.S. merchandise exports and imports with Canada increased in 2017
from the previous year, but imports outpaced exports, resulting in a $6.5
billion increase in the U.S. merchandise trade deficit with Canada to $17.5
billion. Leading U.S. exports to Canada in 2017 included passenger motor
vehicles; motor vehicles for goods transport; civilian aircraft, engines, and
parts; crude petroleum; and light petroleum oils. Top U.S. imports from Canada
included crude petroleum, passenger motor vehicles, natural gas, and coniferous
sawn wood.
Canada remained the second-largest single-country U.S.
trading partner for services in 2017, after the United Kingdom. Two-way
services trade with Canada grew in 2017 to $90.8 billion, while the U.S.
surplus in services increased to $25.8 billion, up from $23.8 billion the year
before.
In 2017, a major focus of U.S.-Canada trade relations was
the renegotiation of NAFTA, which began on August 16, 2017. In addition,
lacking a successor agreement to replace the U.S.-Canada Agreement on Softwood
Lumber—which expired in October 2015—the United States initiated antidumping
and countervailing duty investigations on certain U.S. imports of softwood
lumber from Canada in 2017. In response, Canada initiated dispute settlement
proceedings against the United States in the WTO and NAFTA. In other
developments, the Canada-United States Regulatory Cooperation Council continued
to meet in 2017 to address regulatory issues that hinder cross-border trade and
investment.
Mexico
In 2017, Mexico was the United States’ third-largest
single-country two-way merchandise trading partner. Total two-way merchandise
trade increased 6.4 percent to $557.0 billion in 2017, which accounted for 14.3
percent of U.S. trade with the world. U.S. merchandise exports to Mexico
totaled $243.0 billion in 2017, and U.S. merchandise imports from Mexico
totaled $314.0 billion. The resulting merchandise trade deficit of $71.0
billion was up $6.7 billion from 2016. In 2017, leading U.S. exports to Mexico
were light oils; computer parts and accessories; refined petroleum products;
processors and controllers; and internal combustion diesel engines. Leading
U.S. imports from Mexico included passenger motor vehicles; computers; motor
vehicles for goods transport; crude petroleum; telecommunications equipment;
and color TV reception apparatus.
Mexico was the United States’ sixth-largest trading partner
in services after Germany. U.S. services exports to Mexico increased 3.9
percent ($1.2 billion) and imports from Mexico increased 7.0 percent ($1.7
billion) in 2017, resulting in a narrowing of the U.S. services trade surplus
with Mexico to $6.6 billion in 2017.
A major focus of U.S.-Mexico trade relations in 2017 was the
renegotiation of NAFTA. Joint efforts to modernize border procedures and
facilities also continued in 2017. After the successful conclusion of a pilot
program to address cross-border trucking between the United States and Mexico
under NAFTA, the Federal Motor Carrier Safety Administration (FMCSA) started
accepting applications from Mexico-domiciled motor carriers interested in
conducting long-haul operations beyond the U.S. commercial zones. In 2017,
reports from the FMCSA showed that the safety records of Mexican-owned or
Mexico-domiciled motor carriers surpassed those of U.S. carriers.
Japan
In 2017, Japan remained the United States’ fourth-largest
single-country trading partner in terms of two-way trade, accounting for 5.3
percent of total U.S. merchandise trade. The value of U.S. merchandise trade
with Japan grew 4.6 percent, from $195.3 billion in 2016 to $204.2 billion in
2017. At the same time, the U.S. merchandise trade deficit with Japan was fairly
stable, rising by $38 million in 2017 to $68.8 billion, as U.S. imports
increased more than U.S. exports. Leading U.S. exports to Japan were civilian
aircraft, engines, and parts; liquefied propane; corn; semiconductor
manufacturing machines; and medicaments. Leading U.S. imports from Japan were
passenger motor vehicles, parts for airplanes or helicopters, motor vehicle
gearboxes, and parts for printers.
In 2017, Japan was once again the United States’
third-largest single-country trading partner based on two-way services trade.
U.S. services exports to Japan rose by $1.9 billion, or 4.2 percent, to $45.4
billion in 2017, while U.S. services imports from Japan rose by $1.2 billion,
or 3.0 percent, to $27.5 billion. As a result, the U.S. surplus in services
trade with Japan grew to $17.1 billion from $16.0 billion the year before.
Economic dialogue between the United States and Japan in
2017 focused on a variety of trade issues, including agricultural trade
developments and the efficiency of the Japanese regulatory review process for
medical devices and pharmaceuticals. According to USTR, one of the
Administration’s top trade policy goals was to resolve Japanese import barriers
for U.S. lamb, beef, horticultural products, and processed foods.
Republic of Korea
The Republic of Korea (South Korea) continued to be the
United States’ sixth-largest single-country merchandise trading partner in
2017, accounting for 3.1 percent of U.S. trade with the world. Two-way
merchandise trade was valued at $119.4 billion, up from $112.2 billion in 2016.
U.S. merchandise exports to South Korea were valued at $48.3 billion in 2017,
while U.S. merchandise imports from South Korea totaled $71.2 billion. This resulted
in a trade deficit with South Korea of $22.9 billion in 2017, down 17.0 percent
from 2016. Leading U.S. exports to South Korea included machines for
semiconductor or integrated circuit manufacturing; civilian aircraft, engines,
and parts; processors or controllers; passenger motor vehicles; and crude
petroleum. Leading U.S. imports from South Korea included passenger motor
vehicles, cellphones, computer parts and accessories, refined petroleum
products, and microchips.
In 2017, South Korea became the United States’ 9th-largest
single-country services trading partner based on two-way trade, up from 10th-largest
in 2016. U.S. services exports to South Korea increased 10.0 percent in 2017 to
reach a new high of $22.8 billion. U.S. services imports from South Korea also
increased in 2017, by 7.2 percent, to reach $9.4 billion. Because U.S. services
exports grew more than U.S. services imports, the U.S. services trade surplus
with South Korea increased by 12.0 percent, from $12.0 billion in 2016 to $13.4
billion in 2017.
In 2017, U.S. trade relations with South Korea occurred
within the framework of the U.S.-Korea FTA, which entered into force on March
15, 2012. The United States and South Korea held two special sessions of the
Joint Committee in 2017 to discuss possible amendments or modifications to the
agreement, and in December 2017, it was announced that negotiations would begin
in January 2018.
India
In 2017, India was the United States’ ninth-largest
single-country trading partner based on two-way merchandise trade, maintaining
this position since 2016. U.S. two-way merchandise trade with India increased
by 9.8 percent to $74.3 billion in 2017, accounting for 1.9 percent of U.S.
merchandise trade with the world, the same as in 2016. U.S. merchandise exports
to India were $25.7 billion in 2017 and U.S. merchandise imports from India
were $48.6 billion, resulting in a U.S. merchandise trade deficit with India of
$22.9 billion in 2017, down from $24.3 billion in 2016. Leading U.S. exports to
India in 2017 were nonindustrial diamonds; nonmonetary gold; civilian aircraft,
engines, and parts; bituminous coal; and almonds. Leading U.S. imports from
India in 2017 were nonindustrial diamonds, certain medicaments, frozen shrimp,
light oils, and gold jewelry.
India was the United States’ seventh-largest single-country trading
partner for services and was the only country among the top ten services trading
partners with which the United States had a services trade deficit in 2017. The
services trade deficit with India increased 5.3 percent to $5.8 billion in
2017.
In 2017, the U.S. Trade Representative and the Minister of
Commerce and Industry of India met for the 11th meeting of the India and the
United States Trade Policy Forum, where a wide variety of topics were
addressed. IPR protection remained one of the top bilateral trade issues
between the two countries in 2017.
Taiwan
In 2017, Taiwan became the United States’ 11th-largest
single-country trading partner, dropping from the 10th position in 2016. U.S.
two-way merchandise trade with Taiwan increased 4.5 percent to $68.2 billion
from $65.2 billion in 2016, continuing to account for 1.8 percent of the United
States’ total merchandise trade with the world. The U.S. merchandise trade
deficit with Taiwan in 2017 was $16.7 billion, a 26.7 percent increase from its
2016 trade deficit of $13.2 billion. The top U.S. exports to Taiwan in 2017
were civilian aircraft, engines, and parts; machines for semiconductor or
integrated circuit manufacturing; processors or controllers; computer memories;
and machines for semiconductor boules or wafer manufacturing. The top U.S.
imports from Taiwan were microchips; telecommunications equipment; processors
or controllers; computer parts and accessories; and portable computers and
tablets.
U.S.-Taiwan two-way services trade fell 8.8 percent to $17.2
billion in 2017, accounting for 1.4 percent of all U.S. services trade. U.S.
services exports to Taiwan fell by 18.4 percent to $9.2 billion, while imports
rose 5.5 percent to $8.1 billion, resulting in a 68.6 percent decline in the
U.S. services trade surplus with Taiwan to $1.1 billion in 2017. The drop in
U.S. services exports to Taiwan was due to a reduction in charges for the use
of intellectual property and maintenance and repair services.
The primary forum for bilateral discussions on trade and
investment issues is the U.S.-Taiwan Trade and Investment Framework Agreement
(TIFA). While there was no TIFA Council meeting in 2017, U.S. and Taiwan
officials followed up on issues raised in the 2016 TIFA Council meeting. The
main issues under discussion remained IPRs, agriculture, medical devices, and
pharmaceuticals.
Top of the page
This report provides factual information on the operation of
the U.S. trade agreements program and its administration for calendar year
2017. Section 163(c) of the Trade Act of 1974 (19 U.S.C. 2213(c)) states that
“the International Trade Commission shall submit to the Congress at least once
a year, a factual report on the operation of the trade agreements program.”
Section 1 of Executive Order 11846 defines the trade agreements program to include
“all activities consisting of, or related to, the negotiation or administration
of international agreements which primarily concern trade,”
and section 163(a) of the Trade Act of 1974 sets out the types of information
that the President is to include in his annual report to the Congress on the
operation of the trade agreements program.
This report seeks to provide information on the activities defined in the
Executive Order and, to the extent appropriate and to the extent that there
were developments to report and information was publicly available, the
elements set out in section 163(a).
This first chapter gives an overview of the international
economic and trade environment within which U.S. trade policy was conducted in
2017. It also provides a timeline of selected key trade activities. Chapter 2
covers the administration of U.S. trade laws and regulations in 2017, including
tariff preference programs such as the Generalized System of Preferences (GSP).
Chapter 3 focuses on U.S. participation in the World Trade Organization (WTO),
including developments in major WTO dispute settlement cases during 2017.
Chapter 4 covers 2017 developments at the Organisation for Economic
Co-operation and Development (OECD) and Asian-Pacific Economic Cooperation
(APEC), as well as negotiations on an agreement on trade in services and
developments with trade and investment framework agreements. Chapter 5
describes U.S. negotiation of and participation in free trade agreements (FTAs)
in 2017, and chapter 6 covers trade data and trade relations in 2017 with
selected U.S. trading partners.
This report is based on primary-source materials about U.S.
trade programs and administrative actions pertaining to them. These materials
chiefly encompass U.S. government reports,
Federal Register
notices,
and news releases, including publications and news releases by the U.S.
International Trade Commission (USITC or the Commission) and the Office of the
United States Trade Representative (USTR). Other primary sources of information
include publications of international institutions, such as the International
Monetary Fund, World Bank, OECD, WTO, United Nations, and foreign governments.
When primary-source information is unavailable, the report draws on
professional journals, trade publications, and news reports for supplemental
factual information.
Like past reports,
The Year in Trade 2017
relies on
data from the U.S. Census Bureau (U.S. Census) of the U.S. Department of
Commerce (USDOC) for the U.S. merchandise trade statistics presented throughout
the report. Most tables in the report present U.S. merchandise trade statistics
using “total exports” and “general imports” as measures,
except for data on imports that have entered the United States with a claim of
eligibility under trade preference programs and FTAs. Such data require an
analysis of U.S. “imports for consumption”—goods that have been cleared by U.S.
Customs and Border Protection to enter the customs territory of the United
States with required duties paid.
Also, much of the trade data used in the report, including U.S. services and
merchandise trade data, are revised over time, so earlier years’ trade
statistics in this report may not always match the data presented in previous
reports. Most of the merchandise trade data used in this report can be accessed
using the USITC’s DataWeb database (
https://dataweb.usitc.gov
).
Chapters 1 and 6 also offer data on services trade. The
information on services trade is based on data for cross-border trade in
private services, which exclude government sales and purchases of goods and services
not included elsewhere. The source of these data is the Bureau of Economic
Analysis (BEA) of the USDOC.
The level of U.S. imports and
exports of goods and services depends on many factors, including the strength
of the U.S. and global economies. The United States had a $19.4 trillion
economy in 2017.
The U.S. economy grew faster in 2017 than in 2016: U.S. real gross domestic
product (GDP) increased 2.3 percent in 2017, compared to the growth rate of 1.5
percent in 2016 (figure 1.1).
The largest factors behind the higher growth rate were the following four
industries: professional and business services; finance, insurance, real
estate, rental, and leasing; manufacturing; and retail trade.
Figure
1.1
U.S. real gross domestic product, percentage
change, 2013–17
Source:
USDOC, BEA,
“
Real Gross Domestic
Product
,” March 26, 2018.
Note:
Underlying data can be found in appendix table
B.3
.
The global economic growth rate rose from 2.5 percent in
2016 to 3.3 percent in 2017 (figure 1.2).
The advanced economies grew faster in 2017 than in 2016. The change in the
growth rate of emerging and developing economies was small—0.1 percentage point
from 2016 to 2017—and was primarily due to the relatively unchanged high rate
of growth of the Chinese economy. Among the United States’ top eight trading
partners, only India and Mexico showed slower growth rates in 2017 than in 2016
(figure 1.2).
Figure
1.2
Economic growth trends in the world, the
United States, and major trading partners, 2015–17
Source:
IMF,
World Economic Outlook
, October
2017 (accessed March 26, 2018).
Note:
Underlying data can be found in appendix table
B.4
.
Worldwide growth can be attributed to the strengthening of
domestic demand in advanced economies and in China. Canada showed one of the
larger improvements in terms of growth, doubling its real GDP growth rate from
1.5 percent in 2016 to 3.0 percent in 2017 due to increased domestic demand.
On the other hand, India’s growth rate slowed down, decreasing from 7.1 percent
in 2016 to 6.7 percent in 2017. This was attributed to changes in government
policies, such as the introduction of a goods and services tax, as well as a
currency exchange initiative.
South Korea’s economy continued to grow modestly, increasing its growth rate
from 2.8 percent in 2016 to 3.0 percent in 2017. Despite this increase, South
Korea’s rate of growth was below the world average in 2017.
Overall world trade volume for goods and services increased
by 4.2 percent in 2017, compared to a 2.4 percent increase in 2016.
Both advanced and emerging economies showed increased growth rates in imports
and exports in 2017, but emerging economies’ trade flows grew at a higher rate.
In 2017, exports from emerging economies grew 4.8 percent, up from 2.5 percent
in 2016. This is compared to 3.8 percent for advanced economies, up from 2.2
percent in 2016. Imports grew by 4.4 percent, up from 2.0 percent, in emerging
economies, and by 4.0 percent, up from 2.7 percent, in advanced economies over
the same period.
The U.S. dollar depreciated relative to the broad dollar
index, falling 6.3 percent between January and December of 2017.
[16]
This trend was driven by the depreciation of the U.S. dollar against major
world currencies (figure 1.3). Between January 1 and December 31, 2017, the
U.S. dollar depreciated by 12.0 percent against the euro; 9.4 percent against
the United Kingdom (UK) pound; 6.8 percent against the Canadian dollar; 6.6
percent against the Indian rupee; 6.5 percent against the Chinese yuan; 6.1
percent against the Mexican peso; and 4.2 percent against the Japanese yen.
[17]
Figure
1.3
Indexes of U.S. dollar exchange rates for
selected major foreign currencies, daily, 2017
Source:
Federal Reserve System, “
Foreign Exchange Rates
” (accessed March 26, 2018).
Note:
This figure shows the units of the foreign currency per unit of the U.S.
dollar. A decrease in the index represents a depreciation of the U.S. dollar
relative to the foreign currency, and an increase in the index represents an
appreciation of the U.S. dollar relative to the foreign currency.
The depreciation of the dollar was partly driven by changes
in the economic performance of major U.S. trading partners. As reported by some
major U.S. investment banks, during 2017 the euro and pound were recovering
from an earlier drop caused by uncertainty over the Brexit vote. At the same
time, the German and French economies were experiencing increased growth. These
factors boosted demand for the euro among global investors. On the other hand,
2017 was a year of uncertainty over the current monetary and trade policy of
the United States. This uncertainty led to a reduction in demand for the U.S.
dollar, causing depreciation of the U.S. dollar relative to other major foreign
currencies.
[18]
The broad fall of the U.S. dollar in 2017 contrasts with its mixed performance
against major currencies in 2016.
[19]
The value of U.S. merchandise exports was $1,546.7 billion
in 2017, a 6.6 percent increase from the 2016 level (figure 1.4 and appendix
table A.1). U.S. merchandise imports totaled $2,342.9 billion over the same period,
a 7.1 percent increase from the 2016 level (figure 1.4 and appendix table A.2).
U.S. imports increased more than U.S. exports, leading to a $59.4 billion
increase in the U.S. merchandise trade deficit to $796.2 million in 2017.
The agricultural sector was the only sector that experienced a trade surplus in
2017, exporting $5.7 billion in agricultural products in excess of imports.
Figure
1.4
U.S. merchandise trade with the world,
2015–17
Source:
USITC DataWeb/USDOC (accessed March 14, 2018).
Note:
Underlying data can be found in appendix table
B.5
.
Energy-related products had the largest absolute and
relative (percentage) increase in imports and exports: exports rose 45.5
percent in 2017, and imports increased by 25.5 percent over the same period
(table 1.1). A number of factors contributed to the rise in exports and
imports. First, both U.S. production of and demand for crude petroleum
increased in 2017. However, the increase in production exceeded the increase in
demand, lowering demand for U.S. imports and increasing U.S. exports in volume
terms. Domestic production of petroleum products increased from 8.7 million
barrels per day in 2016 to 9.3 million barrels per day in 2017.
Over the same period, domestic consumption of petroleum products increased from
19.7 million barrels per day to 19.9 million barrels per day.
Second, another factor contributing to the increase in the value of exports of
U.S. crude was the removal of the U.S. government ban on most exports of U.S.
crude to countries other than Canada in December 2015, which increased the
volume of U.S. exports.
Third, an increase in the price of crude petroleum
contributed to the increase in both exports and imports. Indeed, the increase
in the value of U.S. imports of crude was primarily driven by the increase in
the price of U.S. crude. International price benchmarks for crude petroleum
that declined in 2016 recovered slightly in 2017.
While the volume of U.S. imports of crude petroleum increased by 1.0 percent,
export volumes increased by 88.6 percent, nearly doubling from 2.16 billion
barrels in 2016 to 4.08 billion barrels in 2017.
Exports
Transportation equipment continued to be the largest U.S.
export sector in 2017, accounting for 21.0 percent of all U.S. exports. It was
followed by electronic products (17.3 percent of exports) and chemical and
related products (14.7 percent of exports) (table 1.1 and appendix table A.1).
The top export products were civilian aircraft, engines, and parts; refined
petroleum products; light oils; crude petroleum; soybeans; and nonmonetary gold
(appendix table A.3).
Table
1.1
U.S. merchandise trade with the world, by
USITC digest sector, 2016–17 (million dollars)
|
Sector
|
2016
|
2017
|
change 2016–17
|
% change 2016–17
|
2016
|
2017
|
change 2016–17
|
% change 2016–17
|
|
|
Exports
|
Imports
|
|
Agricultural
products
|
148,683
|
153,116
|
4,433
|
3.0
|
139,153
|
147,406
|
8,253
|
5.9
|
|
Forest products
|
37,707
|
39,698
|
1,991
|
5.3
|
43,118
|
44,856
|
1,738
|
4.0
|
|
Chemicals
and related products
|
218,089
|
227,270
|
9,181
|
4.2
|
259,846
|
268,112
|
8,266
|
3.2
|
|
Energy-related products
|
98,418
|
143,236
|
44,818
|
45.5
|
157,826
|
198,096
|
40,270
|
25.5
|
|
Textiles
and apparel
|
21,656
|
22,082
|
426
|
2.0
|
120,265
|
121,423
|
1,158
|
1.0
|
|
Footwear
|
1,368
|
1,430
|
62
|
4.5
|
25,634
|
25,654
|
20
|
0.1
|
|
Minerals
and metals
|
128,684
|
136,452
|
7,769
|
6.0
|
183,522
|
200,714
|
17,192
|
9.4
|
|
Machinery
|
128,097
|
135,945
|
7,848
|
6.1
|
179,537
|
196,414
|
16,878
|
9.4
|
|
Transportation
equipment
|
320,022
|
325,434
|
5,412
|
1.7
|
418,286
|
434,894
|
16,608
|
4.0
|
|
Electronic products
|
260,407
|
268,278
|
7,870
|
3.0
|
449,951
|
484,271
|
34,321
|
7.6
|
|
Miscellaneous
manufactures
|
47,754
|
49,138
|
1,383
|
2.9
|
124,973
|
130,453
|
5,481
|
4.4
|
|
Special provisions
|
40,125
|
44,655
|
4,530
|
11.3
|
85,695
|
90,610
|
4,915
|
5.7 |
|
Total
|
1,451,011
|
1,546,733
|
95,722
|
6.6
|
2,187,805
|
2,342,905
|
155,100
|
7.1
|
Source:
USITC DataWeb/USDOC (accessed March 14, 2018).
Note:
Because of rounding, figures may not add to totals shown.
Exports in all merchandise sectors increased in 2017.
The largest increase in both value and percentage terms occurred in the
energy-related products sector (up $44.9 billion to $143.2 billion). It was
followed by chemicals and related products (up $9.2 billion to $227.3 billion)
and electronic products (up $7.9 billion to $268.3 billion). At the product
level, there were both increases and decreases in top exports. The largest
increases at the product level were all in the energy-related products sector,
including exports of crude petroleum (up $12.4 billion to $21.8 billion),
refined petroleum products (up $10.4 billion to $48.0 billion), light oils (up
$5.5 billion to $29.8 billion), bituminous coal (up $5.3 billion to $9.5
billion), and liquefied propane products (up $4.7 billion to $12.2 billion).
The largest declines were in passenger motor vehicles, where exports declined
by $4.0 billion to $59.3 billion.
It was followed by medicaments in measured doses, exports of which declined by
$2.1 billion to $17.1 billion (appendix table A.3).
Imports
Electronic products and transportation equipment continued
to be the two top import sectors in 2017, accounting for 20.7 percent and 18.6
percent of total 2017 U.S. imports, respectively (table 1.1 and appendix table
A.2). Passenger motor vehicles were the largest U.S. import product, valued at
$186.4 billion in 2017.
They were followed by crude petroleum ($132.9 billion), cellphones ($55.9
billion), medicaments ($50.3 billion), and telecommunications equipment ($47.4
billion) (appendix table A.4).
The value of U.S. imports in all 11 sectors increased in
2017 (table 1.1 and appendix table A.2).
The largest increase in both value and percent terms occurred in the
energy-related products sector. Imports of energy-related products grew by
$40.3 billion (25.5 percent) from $157.8 billion in 2016 to $198.1 billion in
2017; U.S. crude petroleum imports alone grew by $31.1 billion to $132.9
billion. Growth in these products was followed by a $34.3 billion increase in
imports of electronic products, from $450.0 billion in 2016 to $484.3 billion
in 2017; a $17.2 billion (9.4 percent) increase in imports of minerals and
metals to $200.7 billion in 2017; and a $16.9 billion (9.4 percent) increase in
imports of machinery to $196.4 billion in 2017. The smallest increase in
imports between 2016 and 2017, both in value ($20 million) and percentage terms
(0.1 percent), was in the footwear sector (table 1.1 and appendix table A.2).
Table 1.2 shows U.S. trade with major trading partners,
ranked by total trade (exports plus imports) in 2017. In 2017, the European
Union (EU) remained the United States’ top trading partner in terms of two-way
merchandise trade, followed by China, Canada, and Mexico. Ranked by exports,
the EU was the leading market for U.S. exports at $283.5 billion (18.3 percent
of total exports). Canada was the second largest, just shy of the EU value at
$282.5 billion (18.3 percent) (figure 1.5). Ranked by general U.S. imports,
China was the leading source of imports into the United States at $505.6
billion (21.6 percent of imports), followed by the EU at $434.9 billion (18.6
percent) (figure 1.6).
Table
1.2
U.S. merchandise trade with major trading
partners and the world, 2017 (million dollars)
|
Trading partner
|
U.S. total exports
|
U.S. general imports
|
Trade balance
|
Two-way trade (exports plus imports)
|
|
EU
|
283,517
|
434,933
|
-151,416
|
718,451
|
|
China
|
130,370
|
505,597
|
-375,228
|
635,967
|
|
Canada
|
282,472
|
299,975
|
-17,504
|
582,447
|
|
Mexico
|
242,989
|
314,045
|
-71,057
|
557,034
|
|
Japan
|
67,696
|
136,544
|
-68,848
|
204,239
|
|
South
Korea
|
48,277
|
71,164
|
-22,887
|
119,441
|
|
India
|
25,700
|
48,631
|
-22,931
|
74,332
|
|
Taiwan
|
25,754
|
42,492
|
-16,737
|
68,246
|
|
All others
|
418,969
|
405,632
|
13,337
|
824,600
|
|
Total
|
1,546,733
|
2,342,905
|
-796,172
|
3,889,638
|
Source:
USITC DataWeb/USDOC (accessed March 14, 2018).
Note:
Because of rounding, figures may not add to totals shown.
U.S. merchandise exports to nearly all leading trading
partners increased from 2016 to 2017 (table 1.3). Exports declined only to
Taiwan (down by $283 million or 1.1 percent). The largest increase in value was
a $15.7 billion increase in exports to Canada ($282.5 billion in 2017, up from
$266.8 billion in 2016). It was followed by a $14.8 billion increase in exports
to China ($130.4 billion in 2017, up from $115.6 billion in 2016). In
percentage terms, the largest increase in exports between 2016 and 2017 was to
India (18.7 percent), followed by South Korea (14.1 percent) and China (12.8
percent).
Table
1.3
U.S. merchandise trade with major trading
partners and the world, 2016–17 (million dollars)
|
Sector
|
2016
|
2017
|
change 2016–17
|
% change 2016–17
|
2016
|
2017
|
change 2016–17
|
% change 2016–17
|
|
|
Exports
|
Imports
|
|
EU
|
269,617
|
283,517
|
13,901 |
5.2
|
416,377
|
434,933
|
18,556
|
4.5
|
|
China
|
115,602
|
130,370
|
14,767
|
12.8
|
462,618
|
505,597
|
42,979
|
9.3
|
|
Canada
|
266,797
|
282,472
|
15,674
|
5.9
|
277,756
|
299,975
|
22,220
|
8.0
|
|
Mexico
|
229,702
|
242,989
|
13,287
|
5.8
|
294,056
|
314,045
|
19,989
|
6.8
|
|
Japan
|
63,236
|
67,696
|
4,460
|
7.1
|
132,046
|
136,544
|
4,497
|
3.4
|
|
South Korea
|
42,309
|
48,277
|
5,967
|
14.1
|
69,881
|
71,164
|
1,283
|
1.8
|
|
India
|
21,652
|
25,700
|
4,048
|
18.7
|
46,032
|
48,631
|
2,599
|
5.6
|
|
Taiwan
|
26,037 |
25,754
|
-283
|
-1.1
|
39,248
|
42,492
|
3,244
|
8.3
|
|
All
others
|
416,059
|
439,958
|
23,899
|
5.7
|
449,791
|
489,524
|
39,733
|
8.8
|
|
Total
|
1,451,011
|
1,546,733
|
95,722
|
6.6
|
2,187,805
|
2,342,905
|
155,100
|
7.1
|
Source:
USITC DataWeb/USDOC (accessed March 14, 2018).
Note:
Because of rounding, figures may not add to totals shown.
Figure
1.5
Leading U.S. export markets, by share, 2017
Source:
DataWeb/USDOC (accessed March 14, 2018).
Note:
Underlying data can be found in appendix table
B.6
.
Figure
1.6
Leading U.S. import sources, by share, 2017
Source:
DataWeb/USDOC (accessed March 14, 2018).
Note:
Underlying data can be found in appendix table
B.6
.
U.S. merchandise imports from all of
the major trading partners increased in 2017. The largest rise in value was a
$43.0 billion increase in imports from China (up 9.3 percent), a $22.2 billion
increase in imports from Canada (up 8.0 percent), and a $20.0 billion increase
in imports from Mexico (up 6.8 percent).
U.S. Trade with Free Trade
Agreement Partners
In 2017, two-way total merchandise trade (total exports plus
general imports) between the United States and its FTA partners amounted to
$1,517.5 billion, accounting for 39.0 percent of total U.S. merchandise trade
with the world ($3,889.6 billion).
This was somewhat higher than in 2016, when two-way merchandise trade between
the United States and its FTA partners totaled $1,424.1 billion, or 39.1
percent of total U.S. merchandise trade.
The value of U.S. imports entered under FTAs was $385.1
billion in 2017, a 2.8 percent increase from the 2016 value of $374.4 billion.
These imports accounted for 48.3 percent of total imports from FTA partners in
2017 and for 16.5 percent of total U.S. imports from the world.
The value of U.S. imports entered under trade preference
programs with developing countries was much smaller than that of U.S. imports
claiming eligibility under FTAs. U.S. imports under trade preference programs
increased from $29.3 billion in 2016 to $34.7 billion in 2017; they accounted
for 1.4 percent of total U.S. imports during 2017, whereas in 2016 they
accounted for 1.3 percent of imports. Imports that claimed eligibility under
the U.S. Generalized System of Preferences program totaled $21.2 billion in
2017; imports under the African Growth and Opportunity Act totaled $12.5
billion; imports under the Caribbean Basin Economic Recovery Act and the
Caribbean Basin Trade Partnership Act totaled $1.0 billion; imports under the
Haiti initiatives totaled $0.6 billion; and imports under the Nepal Trade
Preference Program totaled $0.002 billion ($2 million).
Total U.S. cross-border trade in private services (hereafter
“services”) grew by 5.0 percent between 2016 and 2017.
During that period, U.S. exports of services increased by 3.8 percent from
$733.6 billion to $761.7 billion, while U.S. services imports grew at a rate of
6.8 percent from $483.1 billion to $516.0 billion.
The U.S. surplus in cross-border services trade decreased 1.9 percent in 2017
to $245.7 billion (figure 1.7). U.S. exports in 9 of the 10 largest services
export categories grew in 2017, while U.S. exports of travel services declined.
The services export categories with the highest growth rates in 2017 included
research and development services (15.0 percent), insurance services (9.0
percent), and financial services (8.4 percent). U.S. imports of services grew
in all of the top 10 services import categories.
Figure
1.7
U.S. cross-border trade in private services
with the world, 2015–17
Source:
USDOC, BEA, Interactive data, International Transactions, Services, and
International Investment Position, International Transactions, Table 1.2, “U.S.
International Trade in Services,” March 21, 2018.
Note:
Data for 2017 are preliminary. Underlying data can be found in appendix table
B.7
.
Exports
U.S. travel services exports, valued at $203.7 billion in
2017, accounted for the largest share (26.7 percent) of total U.S. cross-border
services exports in 2017 (appendix table A.8).
Other large U.S. services export categories included charges for the use of
intellectual property not included elsewhere (n.i.e.) ($127.9 billion or 16.8
percent of total exports), financial services ($106.4 billion or 14.0 percent),
and professional and management consulting services ($78.7 billion or 10.3
percent).
After experiencing slow growth of 0.2 percent in 2016, total U.S. services
exports grew by 3.8 percent in 2017. The fastest-growing category of services
exports was research and development services, which grew 15.0 percent in 2017,
compared to 7.6 percent growth in 2016.
In several services categories, exports increased in 2017 following a decrease
in 2016. These include financial services (8.4 percent in 2017, compared to
-4.3 percent in 2016);
air passenger fares (0.9 percent in 2017, compared to -7.6 percent in 2016);
technical, trade-related, and other business services (6.2 percent in 2017, compared
to -12.1 percent in 2016); and air transport (5.6 percent in 2017, compared to
-0.8 percent in 2016). The only category that experienced a decline in export
growth in 2017 was travel services (-1.1 percent, compared with 0.3 percent in
2016).
Imports
Categories that accounted for the largest shares of U.S.
cross-border services imports in 2017 included travel services (with $135.2
billion or 26.2 percent of total U.S. imports), insurance services ($49.7
billion or 9.6 percent), charges for the use of intellectual property n.i.e.
($48.4 billion or 9.4 percent), and professional and management consulting
services ($42.9 billion or 8.3 percent) (appendix table A.9). Technical,
trade-related, and other business services
experienced the fastest import growth (9.9 percent) in 2017, followed by
travel, computer services, financial services, and charges for use of
intellectual property n.i.e. (with growth rates of 9.4 percent, 9.2 percent,
9.2 percent, and 8.9 percent, respectively). All of the top 10 services import
segments experienced positive growth in 2017, including those segments which
experienced a decline in 2016. These include professional and management
consulting services (which increased 6.8 percent in 2017, following a decline
of 0.6 percent in 2016); sea transport (up 5.7 percent, following a decline of
5.9 percent in 2016); financial services (up 9.2 percent, following a decline
of 0.4 percent in 2016); and technical, trade-related, and other business
services (up 9.9 percent, following a decline of 9.4 percent in 2016).
The EU was the largest export market for U.S. services in
2017, as well as the largest foreign supplier of U.S. services imports (table
1.4).
In that year, the EU accounted for $238.4 billion (31.3 percent) of total U.S.
services exports and $188.5 billion (36.5 percent) of total U.S. services
imports (figures 1.8 and 1.9).
After the EU, the top markets for U.S. services exports were Canada, China, and
Japan, while the top sources of imports were Canada, India, and Japan. The
United States maintained a services trade surplus with every major services
trading partner except for India, with which it posted a $5.8 billion deficit
in 2017.
The two segments that accounted for the largest shares of U.S. services imports
from India in 2016 (latest data available) were computer services (53.2
percent), and research and development services (13.5 percent). The United
States posted trade deficits with India in these two services segments.
Table
1.4
U.S. cross-border trade in private services
with major trading partners and the world, 2017 (million dollars)
|
Major trading partner
|
U.S. exports
|
U.S. imports
|
Trade balance
|
Two-way trade (exports plus imports)
|
|
EU
|
238,425
|
(
a
)188,496
|
49,929
|
426,921
|
|
Canada
|
58,307
|
32,515
|
25,792
|
90,822
|
|
Japan
|
45,421
|
28,353
|
17,068
|
73,774
|
|
China
|
55,585
|
17,421
|
38,164
|
73,006
|
|
Mexico
|
32,795
|
26,150
|
6,645
|
58,945
|
|
India
|
22,763
|
28,562
|
-5,799
|
51,325
|
|
Brazil
|
25,132
|
6,469
|
18,663
|
31,601
|
|
South
Korea
|
22,835
|
9,424
|
13,411
|
32,259
|
|
Australia
|
21,909
|
7,192
|
14,717
|
29,101
|
|
Singapore
|
17,843
|
7,499
|
10,344
|
25,342
|
|
Taiwan
|
9,195
|
8,053
|
1,142
|
17,248
|
|
All
others
|
211,519
|
155,881
|
55,638
|
367,400
|
|
Total
|
761,729
|
516,015
|
245,714
|
1,277,744
|
Source:
USDOC, BEA, Interactive data, International Transactions, Services, and
International Investment Position, International Transactions, tables 1.2 and
1.3, March 21, 2018.
U.S.
imports from the EU in 2017 are overstated because the data include government
goods and services n.i.e.
Figure
1.8
Leading U.S. export markets for private
services, by share, 2017
Source: USDOC, BEA,
Interactive data, International Transactions, Services, and International
Investment Position, International Transactions, tables 1.2 and 1.3, U.S.
International Trade in Services, March 21, 2018.
Note:
Data are preliminary. Because of rounding, figures may not add to 100 percent.
Underlying data can be found in appendix table
B.8
.
Figure
1.9
Leading U.S. import sources for private
services, by share, 2017
Source:
USDOC, BEA, Interactive data, International Transactions, Services, and
International Investment Position, International Transactions, tables 1.2 and
1.3, U.S. International Trade in Services, March 21, 2018.
Note:
Data are preliminary. Because of rounding, figures may not add to 100 percent.
Underlying data can be found in appendix table
B.8
.
The following timeline presents selected key trade events
between the United States and its trading partners in 2017. Some of these
developments are presented in more detail in chapters 2 through 6.
▼
Note: Tabulation of selected key trade activities in graphic above.
January
6–11:
The Asian-Pacific Economic
Cooperation (APEC) leaders’ and ministerial meetings convene in Ho Chi Minh
City, Vietnam, with discussions focusing on sustainable growth and
strengthening regional economic integration.
9:
The Office of the U.S. Trade
Representative (USTR) releases its
2016 Report to Congress on China’s WTO
Compliance
.
12:
The United States requests World Trade
Organization (WTO) consultations with China regarding Chinese subsidies to
primary aluminum producers (WT/DS519).
12:
The fourth meeting of the Joint
Committee under the U.S.-Korea Free Trade Agreement (KORUS) is held in Seoul,
South Korea.
13:
The United States and Paraguay sign a
Trade and Investment Framework Agreement (TIFA).
17–20:
The World Economic Forum annual
meeting is held in Davos, Switzerland.
18:
The United States requests WTO dispute
settlement consultations with Canada regarding measures governing the sale of
wine in grocery stores (DS520).
19:
The U.S.-Mongolia Agreement on
Transparency in Matters Related to International Trade and Investment enters
into force.
22:
The second meeting of the U.S.-Panama
Free Trade Commission is convened in Washington, DC.
25:
The WTO Dispute Settlement Body (DSB)
establishes a panel requested by the United States to examine China’s domestic
support for agricultural products (DS511).
30:
The United States officially withdraws
from the Trans-Pacific Partnership.
February
6:
The USITC announces three new
investigations on digital trade and the impact of barriers to digital trade on
the competitiveness of U.S. firms in international markets. These
investigations were requested by the USTR in a letter received on January 13,
2017.
10:
President Donald Trump and Japan’s
Prime Minister Abe hold their first official meeting in Washington, DC, to
discuss a variety of economic and political issues of mutual interest. Two of
the issues were the creation of a reoccurring U.S.-Japan Economic Dialogue to
deepen economic ties and the pursuit of a U.S.-Japan bilateral trade agreement
in the wake of the U.S. withdrawal from the Trans-Pacific Partnership
Agreement.
22:
The WTO Agreement on Trade Facilitation
enters into force.
March
1:
USTR releases its
2017 Trade Policy
Agenda
and
2016 Annual Report
.
2:
The United States and the European Union
(EU) agree to amend the Pharmaceutical Annex to the 1998 U.S.-EU Mutual
Recognition Agreement.
8:
Turkey requests WTO dispute settlement
consultations with the United States regarding countervailing measures on
certain pipe and tube products from Turkey (DS523).
21:
The WTO DSB establishes a panel to
review a complaint by India regarding certain U.S. measures at the state level
to promote renewable energy (DS510).
22:
The United States and Taiwan sign a
memorandum of understanding (MOU) to combat intellectual property rights (IPR)
infringement and trade fraud crimes.
23:
The United States and Laos hold the
inaugural meeting under the U.S.-Laos TIFA.
27–28:
The United States and Afghanistan
hold an annual meeting under the U.S.-Afghanistan TIFA.
27–28:
The United States and Vietnam hold
the first annual meeting under the U.S.-Vietnam TIFA since 2011.
30
: Senior officials from the United States
and the 10 members of the Association of Southeast Asian Nations (ASEAN) meet
to discuss their economic agenda, including proposals for advancing work under
the U.S.-ASEAN TIFA, such as on digital trade and ways to support small and
medium-sized enterprises in global trade.
31:
USTR releases its
National Trade
Estimate on Foreign Trade Barriers
report for 2017.
31:
Executive Order 13786 directs the U.S.
Department of Commerce (USDOC) and USTR to submit the “Omnibus Report on
Significant Trade Deficits,” which examines the causes of U.S. trade deficits
by country.
April
3
: The United States and Guatemala reach an
agreement to accelerate the elimination of tariffs on U.S. fresh, frozen, and
chilled poultry exports and for Guatemala to establish a tariff-rate quota
allowing imports of up to 1,000 metric tons of processed chicken leg quarters
to enter duty free each year through December 31, 2021.
3
: The United States and Thailand hold the
first of two TIFA meetings for the year.
13
: A WTO arbitrator determines that the
“reasonable period of time” for the United States to implement the DSB’s
recommendations and rulings related to U.S. antidumping and countervailing duty
measures on large residential washers from South Korea is 15 months, expiring
on December 26, 2017 (DS464).
17–20:
President Trump and Japanese Prime
Minister Abe meet in both Palm Beach, Florida, and Washington, DC, to discuss a
variety of economic and political issues, including a number of trade issues
and coordinated economic pressure on North Korea. The trade discussions
centered on tariff rate increases President Trump was considering on some
trading partners, potential U.S. airplane sales to Japan, and the launch of the
contemporaneous U.S.-Japan Economic Dialogue in Tokyo, led by Vice President
Michael Pence and Deputy Prime Minister Aso of Japan.
19:
USDOC initiates a section 232 national
security investigation on steel.
20:
The U.S.-Nepal TIFA Council holds its
third meeting to promote expanded bilateral trade and investment in goods and
services.
21:
The U.S.-Tunisia TIFA Council holds its
seventh meeting, discussing market access, growth, and cooperation in organic
product certification, technology transfer, and capacity building.
26:
USDOC initiates a section 232 national
security investigation on aluminum.
28:
USTR releases its
2017 Special 301
Report
on the global state of intellectual property rights protection and
enforcement. This year’s report places 11 countries on USTR’s “Priority Watch
List,” signifying countries USTR deems most problematic with respect to
protection and enforcement of intellectual property rights. These countries are
Algeria, Argentina, Chile, China, India, Indonesia, Kuwait, Russia, Thailand,
Ukraine, and Venezuela.
May
17:
The United States and Bangladesh hold
the 3rd Council meeting under the Trade and Investment Cooperation Forum
Agreement.
17:
USITC institutes a safeguard
investigation on crystalline silicon photovoltaic cells.
18:
The Trump Administration announces its
intent to renegotiate the North American Free Trade Agreement (NAFTA).
20–21:
The 23rd meeting of Ministers
Responsible for Trade under APEC is convened in Hanoi, Vietnam, with
discussions focusing on efforts to facilitate digital trade in the region,
expand services markets, strengthen intellectual property rights protections,
and eliminate barriers to agriculture and food trade. USTR Robert Lighthizer
holds bilateral meetings with the following economies: Canada, Japan, Mexico,
Vietnam, China, and Australia.
22:
The WTO DSB adopts the Appellate Body
report and the panel report in the complaint by China regarding certain U.S.
methodologies and their application to antidumping proceedings involving China
(DS471).
22:
The WTO DSB establishes a compliance
panel in response to a request by India in a case concerning prohibitions by
India on the importation of various U.S. agricultural products because of
concerns related to avian influenza (DS430).
22:
The WTO DSB authorizes Mexico to
suspend the application of tariff concessions to the United States in the case
regarding U.S. measures concerning the importation, marketing, and sale of tuna
and tuna products (DS381).
30:
The United States and Vietnam hold a
second meeting under the U.S.-Vietnam TIFA this year. USTR Lighthizer meets
with Vietnamese Prime Minister Nguyen Xuan Phuc to discuss the U.S.-Vietnam
trade relationship and outstanding bilateral trade issues.
June
5:
USITC institutes a safeguard
investigation on large residential washers.
7–8:
The
Organisation for Economic Co-operation and Development holds
its Ministerial Council meeting in Paris, France.
9:
The WTO DSB panel circulates its report
in the complaint by the EU regarding U.S. measures affecting trade in large
civil aircraft (second complaint) (DS353).
12–13:
The United States and Indonesia meet
under their TIFA.
12–13:
The United States and Thailand meet
under their TIFA for the second time in 2017.
19:
The WTO DSB establishes a dispute
settlement panel to review the complaint by Turkey regarding U.S.
countervailing duties on imports of Turkish steel pipes and tubes (DS523).
20:
USTR announces initiation of an
out-of-cycle African Growth and Opportunity Act (AGOA) review for Rwanda,
Tanzania, and Uganda.
27–29:
Following a 90-day notification to
Congress and a public comment period, USTR holds public hearings on NAFTA
renegotiations in Washington, DC.
29:
USTR’s annual review under the
Generalized System of Preferences (GSP) results in the USTR self-initiating a
country-practice review of Bolivia’s compliance with GSP eligibility criteria
related to child labor.
29:
USTR Lighthizer meets with New Zealand
Minister of Trade Todd McClay. Opportunities to deepen the trade partnership
and coordinate solutions on global dairy market challenges were discussed.
30:
USTR Lighthizer meets with Japan Trade
Minister Hiroshige Seko to discuss bilateral trade relations and cooperation
against third-party trade-distorting practices.
July
1:
The second set of tariff reductions
takes place under the expansion of the Information Technology Agreement.
7–8:
The G20 Summit takes place in Hamburg,
Germany. President Trump and Chinese President Xi Jinping meet to discuss
reciprocal trade and market access.
11:
The United States and the Philippines
meet under their TIFA.
12:
USTR Lighthizer formally notifies South
Korea that the United States is calling for a special session of the KORUS
Joint Committee to discuss possible amendments and modifications to KORUS.
17:
The United States and Malaysia meet
under the TIFA and agree to work together to address outstanding issues,
including by establishing working groups related to goods, intellectual
property, financial services, labor, and the environment.
17:
USTR Lighthizer releases objectives for
the renegotiation of NAFTA.
18:
U.S. Commerce Department Secretary
Wilbur Ross and U.S. Treasury Department Secretary Steven Mnuchin meet with
China’s Vice Premier Wang Yang for the first session of the U.S.-China
Comprehensive Economic Dialogue in Washington, DC.
24–25:
The inaugural meeting of the U.S.-UK
Trade and Investment Working Group takes place in Washington, DC, to discuss
the future trade relationship between the United States and the United Kingdom
(UK) after the UK leaves the EU.
31:
USTR announces reallocation of the
unused in-quota quantity of the WTO tariff-rate quota for raw cane sugar for
fiscal year (FY) 2017.
31:
USTR announces revised FY 2017
tariff-rate quota allocations for raw cane sugar.
August
7–10:
The United States co-hosts the 16th
AGOA Forum with Togo in Lomé, Togo, with government officials, civil society
leaders, business representatives, and representatives from the U.S.-sponsored
African Women’s Entrepreneurship Program in attendance.
8:
U.S. and Cambodian officials meet under
their TIFA.
14:
President Trump instructs USTR
Lighthizer to determine whether to investigate any of China’s laws, policies,
practices, or actions that may be considered unreasonable or discriminatory, or
may be harming U.S. intellectual property rights, innovation, and technical
development.
16–20:
The
first round of NAFTA renegotiations takes place in
Washington, DC.
18:
USTR Lighthizer, upon consultation with
U.S. governmental and private sector advisory committees, launches an
investigation of China regarding intellectual property, innovation, and
technology under Section 301 of the Trade Act of 1974.
22:
The first Special Session of the
U.S.-Korea FTA Joint Committee is held under the KORUS FTA.
September
1–5:
The second round of NAFTA
renegotiations takes place in Mexico City, Mexico.
9:
USTR holds consultations with ASEAN
economic ministers in Manila, Philippines.
18–19:
U.S. and EU officials meet for the
first annual review of the functioning of the Privacy Shield, a mechanism for
companies to transfer personal data from the EU to the United States that is
consistent with EU law.
21:
South Korea’s Minister for Trade
Hyun-chong Kim formally requests the second special session of the Joint
Committee under KORUS.
21:
U.S. President Trump and Japanese Prime
Minister Abe meet in New York to discuss a variety of economic and political
issues of mutual interest, including coordinated action on North Korea, during
the United Nations General Assembly meeting.
22:
The WTO DSB adopts the Appellate Body
report and the panel report in the complaint by the EU relating to U.S.
conditional tax incentives for large civil aircraft (DS487).
22:
U.S. and EU officials sign a “covered
agreement” on prudential measures affecting insurance and reinsurance. The
agreement would help level the regulatory playing field for U.S.-based insurers
and reinsurers doing business in the EU.
22:
The WTO DSB establishes a dispute
settlement panel requested by the United States to examine China’s
administration of its tariff-rate quotas for certain agricultural products
(DS517).
23–27:
The third round of NAFTA
renegotiations takes place in Ottawa, Canada. Progress is made in the areas of
telecommunications, competition policy, digital trade, good regulatory
practices, and customs and trade facilitation.
28:
The United States files a second
request for WTO dispute settlement consultations with Canada regarding measures
governing the sale of wine in grocery stores. The United States identifies
successor laws and regulations that entered into force after the original
consultations request (DS531).
October
3:
The United States and Ukraine hold the
7th U.S.-Ukraine Trade and Investment Council meeting under their Trade and
Investment Cooperation Agreement.
4:
A second Special Session of the
U.S.-Korea FTA Joint Committee is held under the KORUS FTA.
4:
The U.S.-Singapore FTA Environment
Chapter meeting takes place in Singapore. Discussions focus primarily on
enforcement of environmental laws, particularly to combat wildlife and timber
trafficking in the region.
11–17:
The fourth round of NAFTA
renegotiations takes place in Mexico City, Mexico.
19:
In accordance with the U.S.-Peru Trade
Promotion Agreement’s Annex on Forest Sector Governance, USTR Lighthizer
directs U.S. Customs and Border Protection (CBP) to block future timber imports
from a Peruvian exporter based on illegally harvested timber found in its
supply chain.
24:
USTR announces new enforcement
priorities for the GSP trade preference program. Priorities include heightened
focus on concluding outstanding GSP cases and a new interagency process to
assess beneficiary country compliance with eligibility criteria.
26:
The 11th ministerial-level meeting of
the India and United States Trade Policy Forum takes place in Washington, DC.
26:
The WTO DSB circulates the compliance
panel report in the complaint by Mexico regarding U.S. measures concerning the
importation, marketing, and sale of tuna and tuna products (DS381).
November
5–7:
President Trump visits Japan to meet
with Prime Minister Abe to discuss a variety of economic issues. In his initial
speech in Tokyo, President Trump addresses the importance of strengthening
bilateral trade and investment, job creation, and balanced trade.
13–14:
The second meeting of the U.S.-U.K.
Trade and Investment Working Group takes place in London, UK. Topics covered by
the working group include industrial and agricultural goods; services,
investment, financial services and digital trade; intellectual property rights
and enforcement; regulatory issues related to trade; labor and
environment/sustainable development; and small and medium-sized enterprises.
14:
The WTO DSB circulates the dispute
panel report in the complaint by South Korea concerning U.S. antidumping
measures relating to certain oil country tubular goods from South Korea
(DS488).
17–21:
The
fifth round of
NAFTA renegotiations takes place in Mexico City, Mexico.
17:
Secretary of State Rex Tillerson hosts
the Ministerial on Trade, Security, and Governance in Africa in Washington, DC.
Discussions are based on the themes of trade and investment, security, and good
governance.
17:
USTR Lighthizer releases an updated
summary of the objectives for the renegotiation of NAFTA.
22:
The WTO DSB adopts the Appellate Body
report and the panel report in the complaint by the United States relating to
certain measures Indonesia imposes on its imports of horticultural products,
animals, and animal products (DS478).
28:
Canada requests WTO dispute settlement
consultations with the United States regarding U.S. countervailing measures on
softwood lumber from Canada (DS533).
28:
Canada requests WTO dispute settlement
consultations with the United States regarding U.S. antidumping measures
applying differential pricing methodology to softwood lumber from Canada
(DS534).
29:
The United States and the Philippines
meet under their TIFA for the second time this year.
December
5:
The United States and Egypt hold a Trade
and Investment Council meeting in Cairo under their TIFA.
6:
The WTO DSB circulates the dispute panel
report in the complaint by Indonesia concerning U.S. antidumping and
countervailing measures relating to certain coated paper from Indonesia
(DS491).
8:
The U.S.-Australia FTA Joint Committee
meets to review implementation of the U.S.-Australia FTA, including issues
related to trade in goods and services, intellectual property, and investment.
The Committee also received a report from the FTA’s Committee on Sanitary and
Phyto-Sanitary (SPS) Measures and its efforts to address SPS issues affecting
U.S.-Australia agricultural trade.
10–13:
The WTO’s 11th Ministerial
Conference takes place in Buenos Aires, Argentina. Members agree to extend the
practice of not imposing customs duties on electronic transmissions for another
two years and discuss fisheries subsidies. Representatives from the United
States, the EU, and Japan agree to strengthen their commitment to ensure a
global level playing field and eliminate severe excess capacity in key sectors.
13:
The 11th anniversary council meeting of
the U.S.-Central Asia TIFA is held in Almaty, Kazakhstan, with senior trade
officials from the United States, Kyrgyzstan, Kazakhstan, Tajikistan,
Turkmenistan, and Uzbekistan, with representatives from Afghanistan
participating as observers.
19:
The United States requests
authorization to suspend concessions or obligations with respect to India in a
WTO case concerning India’s purchase power agreements with solar firms and
domestic content requirements (DS456).
20:
Canada requests WTO dispute settlement
consultations with the United States regarding certain measures maintained by
the United States with respect to antidumping and countervailing duty
proceedings (DS535).
22
: The Gambia and Swaziland are
redesignated as eligible for AGOA trade preferences.
Source: Compiled from official and
private sources, including the U.S. Department of Commerce, U.S. Department of
State, U.S. Department of Transportation, U.S. Department of Treasury, U.S.
Trade Representative, White House,
Federal Register
, Regulations.gov,
Asia-Pacific Economic Cooperation, World Trade Organization, European
Commission, Global Affairs Canada, and
Inside U.S. Trade
.
Top of the page
This chapter surveys activities related to the
administration of U.S. trade laws during 2017, covering import relief laws,
laws against unfair trade practices, national security investigations, trade
adjustment assistance programs, and tariff preference programs. Tariff
preference programs encompass the U.S. Generalized System of Preferences, the
Nepal Trade Preference Act, the African Growth and Opportunity Act, and the
Caribbean Basin Economic Recovery Act, including initiatives aiding Haiti.
This section covers safeguard actions under provisions
administered by the Commission, including the global safeguard provisions in
sections 201–204 of the Trade Act of 1974,
and the safeguard provisions in various bilateral free trade agreements (FTAs)
involving the United States.
The Commission conducted two new safeguard investigations
during 2017, both under the global safeguard provisions in sections 201–204 of
the Trade Act of 1974. These were the first investigations conducted by the
Commission under the global safeguard provisions since 2001. The first
investigation concerned imports of crystalline silicon photovoltaic cells (CSPV
cells),
and the second concerned imports of large residential washers (washers).
Each investigation was conducted following receipt of a petition from a
domestic producer of the article.
The Commission made affirmative injury determinations in each investigation
and, to address the serious injury, recommended a remedy measure to the
President. The Commission submitted its reports on CSPV cells and washers to
the President in November 2017 and December 2017, respectively. As of the end
of 2017, the Commission’s reports on both CSPV cells
and washers
were pending before the President. Under section 203 of the Trade Act of 1974,
the President makes the final decision on remedy, including whether to apply a
remedy measure and, if so, the type, amount, and duration of the measure.
Section 301 of the Trade Act of 1974 is the principal U.S.
statute for addressing unfair foreign practices affecting U.S. exports of goods
or services.
Section 301 may be used to enforce U.S. rights under bilateral and multilateral
trade agreements and to respond to unjustifiable, unreasonable, or
discriminatory foreign government practices that burden or restrict U.S.
commerce. Interested persons may petition the Office of the U.S. Trade
Representative (USTR) to investigate foreign government policies or practices,
or USTR may initiate an investigation itself.
If the investigation involves a trade agreement and
consultations do not lead to a mutually acceptable resolution, section 303 of
the Trade Act of 1974 requires USTR to use the dispute settlement procedures
available under the agreement in question. If the matter is not resolved by the
conclusion of the investigation, section 304 of the Trade Act of 1974 requires
USTR to determine whether the practices in question fulfill any of three
conditions: (1) they deny U.S. rights under a trade agreement; (2) they are
unjustifiable, and burden or restrict U.S. commerce; or (3) they are
unreasonable or discriminatory, and burden or restrict U.S. commerce. If the
practices fulfill either of the first two conditions, USTR must take action.
If the practices fulfill the third condition—that is, if they are unreasonable
or discriminatory, and they burden or restrict U.S. commerce—USTR must
determine whether action is appropriate and, if so, what type of action to
take.
The time period for making these determinations varies according to the type of
practices alleged.
Section 301 Investigations
During 2017, USTR self-initiated an investigation under
section 301 regarding China’s acts, policies, and practices related to
technology transfer, intellectual property, and innovation. In addition, in
response to a written request from representatives of the U.S. beef industry,
USTR initiated a process to consider whether to reinstate additional duties
that had been imposed on certain imports from the European Union (EU) under
section 301.
China Technology
Transfer.
On August 14, 2017, the President issued a memorandum to the
United States Trade Representative, directing the USTR to determine, pursuant
to section 302(b) of the Trade Act of 1974, whether to investigate any of
China’s laws, policies, practices, or actions that may be unreasonable or
discriminatory and that may be harming American intellectual property rights (IPRs),
innovation, or technological development.
[59]
In
accordance with the President’s memorandum, USTR initiated an investigation
under section 302(b) of the Trade Act of 1974, to determine whether any acts,
policies, or practices of the government of China related to technology
transfer, intellectual property, or innovation are unreasonable or
discriminatory and whether the acts, policies, or practices burden or restrict
U.S. commerce.
[60]
USTR is investigating a wide variety of acts, policies, and practices by the
government of China that allegedly require or pressure the transfer of
technology and intellectual property to Chinese companies on nonmarket terms.
In addition, USTR is investigating allegations of systematic Chinese government
support to Chinese companies that seek to acquire or obtain cutting-edge
technologies from U.S. companies in industries deemed important by the Chinese
government.
USTR is further considering
whether the Chinese government is conducting or supporting unauthorized
intrusions into U.S. commercial computer networks.
As part of the investigation, USTR held a
public hearing in October 2017 and solicited written public comments. Under the
statute, USTR generally has up to 12 months from the date of initiation to
determine whether the statutory requirements have been met and, if so, what
action to take. The China technology transfer section 301 investigation was
ongoing at the end of 2017.
[61]
EU Meat Hormones.
A second section 301
investigation that was active during 2017 related to a longstanding dispute
with respect to EU measures concerning meat and meat products. The
investigation concerned various meat hormone directives of the EU, which
prohibit the use of certain hormones that promote growth in farm animals. The
United States had successfully challenged the EU measures at the World Trade
Organization (WTO), and in 1999, imposed additional ad valorem duties
of 100 percent on about $117 million in imports from the EU in retaliation.
In January 2009, the USTR announced a determination to
modify the list of products subject to additional duties, consistent with WTO
authorization. In May 2009, the United States and the EU signed a memorandum of
understanding (MOU).
Under the MOU, the EU agreed to establish a tariff-rate quota (TRQ)
with an in-quota tariff rate of zero for beef produced without growth-promoting
hormones (i.e., “high-quality beef”)
in the amount of 20,000 metric tons (mt),
and the United States agreed to reduce the scope of the retaliation list.
The MOU further provided that the parties could enter a second phase under
which the EU would increase the TRQ to 45,000 mt beginning in August 2012, and
the United States would lift the remaining additional duties.
The United States and the EU entered into the second phase of the MOU beginning
August 1, 2012, and the EU increased the TRQ for high-quality beef to 45,000
mt.
The MOU provided that the second phase would continue for one year. In August
2013, the United States and the EU agreed to extend the second phase of the MOU
for two additional years, until August 2, 2015, thereby maintaining the TRQ for
high-quality beef at 45,000 mt.
Although the second phase of the MOU ended in August 2015, the EU has
maintained the 45,000 mt TRQ for high-quality beef.
In February 2016, Congress amended section 301 to authorize
USTR to reinstate any additional duties that had been previously imposed under
section 301 and then subsequently terminated.
The amendment also allows the USTR to suspend concessions and to reinstate a
section 301 action following receipt of a written request from a petitioner or
any representative of the domestic industry. It requires that USTR, following
the receipt of such a request, consult with the petitioner and representatives
of the domestic industry and provide an opportunity for public comments. In
addition, it requires that USTR review the effectiveness of any reimposed
additional duties.
On December 9, 2016, representatives of the U.S. beef
industry filed a request with USTR asking that the additional duties be
reinstated.
According to the industry, the MOU has not in practice provided benefits
sufficient to compensate for the economic harm resulting from the EU ban on all
but specially-produced U.S. beef.
On
December 28, 2016, USTR issued a public notice of the request and announced a
public hearing and an opportunity for public comment.
The public hearing was held on February 15–16, 2017, in Washington, DC. During
2017, USTR engaged in discussions with the EU about possible modifications of
the TRQ for high-quality beef to address U.S. industry concerns and was
considering the possible reinstatement of duties.
Special 301
The Special 301 law
requires that the USTR annually identify and issue a list of foreign countries
that deny adequate and effective protection of IPRs, or deny fair and equitable
market access to U.S. persons who rely on IPR protection.
Under the statute, a country denies adequate and effective IPR protection if
the country does not allow foreign persons “to secure, exercise, and enforce
rights relating to patents, process patents, registered trademarks, copyrights,
trade secrets and mask works.”
Under the statute, a country denies fair and equitable
market access if it denies access to a market for a product that is protected
by a copyright or related right, patent, trademark, mask work, trade secret, or
plant breeder’s right using laws and practices that violate international
agreements or that constitute discriminatory nontariff trade barriers.
A country may be found to deny adequate and effective IPR protection even if it
is in compliance with its obligations under the WTO Agreement on Trade-Related
Aspects of Intellectual Property Rights (TRIPS Agreement).
In addition, the Special 301 law directs the USTR to
identify so-called “priority foreign countries.”
Priority foreign countries are countries that have the most onerous or
egregious acts, policies, or practices with the greatest adverse impact (actual
or potential) on the relevant U.S. products.
Such countries must be designated as priority foreign countries unless they are
entering into good-faith negotiations, or they are making significant progress
in bilateral or multilateral negotiations to provide adequate and effective IPR
protection.
The identification of a country as a priority foreign country triggers a
section 301 investigation,
unless the USTR determines that the investigation would be detrimental to U.S.
economic interests.
In addition to identifying priority foreign countries as
required by statute, the USTR has adopted a practice of naming countries to a
“watch list” or a “priority watch list” when the countries’ IPR laws and
practices fail to provide adequate and effective IPR protection, but the
deficiencies do not warrant listing the countries as priority foreign
countries.
The priority watch list identifies countries with significant IPR concerns that
warrant close monitoring and bilateral consultation. If a country on the
priority watch list makes progress, it may be moved to the watch list or
removed from any listing. On the other hand, a country that fails to make
progress may be raised from the watch list to the priority watch list or from the
priority watch list to the list of priority foreign countries.
In February 2016, Congress enacted amendments to the Special
301 statute that provided that USTR should develop an action plan for each
country that has been identified as a priority watch list country and that has
remained on the priority watch list for at least one year.
The action plan should contain benchmarks designed to assist the country to
achieve, or make significant progress toward achieving, adequate and effective
protection of IPRs and fair and equitable market access for U.S. persons that
rely on IPR protection.
In the 2017 Special 301 review, the USTR examined the
adequacy and effectiveness of IPR protection in more than 100 countries.
In conducting the review, the USTR focused on a wide range of issues and policy
objectives, including inadequate IPR protection and enforcement worldwide,
compulsory technology licensing and transfer, and the unauthorized use of
unlicensed software by foreign governments.
Although no country was identified as a priority foreign
country in the
2017 Special 301 Report
, the report identified 11
countries on the priority watch list: Algeria, Argentina, Chile, China, India,
Indonesia, Kuwait, Russia, Thailand,
Ukraine, and Venezuela.
In addition, the report identified 23 countries on the watch list.
In keeping China on the priority watch list, the report
highlighted serious challenges with respect to adequate and effective IPR protection,
as well as fair and equitable market access for U.S. persons that rely on IRP
protection.
The report cites many longstanding concerns, such as coercive technology
transfer requirements, structural impediments to effective IPR enforcement, and
widespread infringing activity, including trade secret theft, rampant online
piracy and counterfeiting, and high levels of pirated and counterfeit exports.
India remained on the priority watch list in 2017 due to a lack of measurable
improvement to its IPR regime, particularly with respect to patents,
copyrights, trade secrets, and enforcement.
As part of the annual Special 301 process, USTR also issues
a separate report on so-called notorious markets. USTR defines notorious
markets as online or physical marketplaces that are reported to engage in or
facilitate commercial-scale copyright piracy and trademark counterfeiting. The
report,
2017 Out-of-Cycle Review of Notorious Markets
, was issued in
January 2018.
The report highlights those markets where the scale of this activity is such
that it can cause significant harm to U.S. IPR holders. The 2017 report listed
25 online markets and 18 physical markets in 12 countries, including markets in
China and India that reportedly engage in or facilitate commercial-scale
trademark counterfeiting and copyright piracy.
Antidumping Duty Investigations
The U.S. antidumping law is found in Title VII of the Tariff
Act of 1930, as amended.
This law offers relief to U.S. industries that are materially injured by
imports that are dumped, or sold at “less than fair value” (LTFV). The U.S.
government provides a remedy by imposing an additional duty on LTFV imports.
Antidumping duties are imposed when (1) the U.S. Department
of Commerce (USDOC) has determined that imports are being, or are likely to be,
sold at LTFV in the United States, and (2) the Commission has determined that a
U.S. industry is materially injured or threatened with material injury, or that
the establishment of an industry in the United States is materially retarded by
reason of such imports. (Such a conclusion is called an “affirmative
determination.”) Investigations are generally initiated on the basis of a
petition filed with the USDOC and the Commission by or on behalf of a U.S.
industry, but can be self-initiated by the USDOC.
The USDOC and the Commission each make preliminary determinations and, if the
Commission’s preliminary determination is affirmative, then each agency will
make final determinations during the investigation process.
In general, imports are considered to be sold at LTFV when a
foreign firm sells merchandise in the U.S. market at a price that is lower than
the “normal value” of the merchandise.
Generally, normal value is the price the foreign firm charges for a comparable
product sold in its home market.
Under certain circumstances, the foreign firm’s U.S. sales price may also be
compared with the price the foreign firm charges in other export markets or
with the firm’s cost of producing the merchandise, taking into account the
firm’s “selling, general, and administrative expenses” and its profit. Under
the law, this latter basis for comparison is known as “constructed value.”
Finally, where the producer is located in a nonmarket economy, a comparison is
made between U.S. prices and a “surrogate” normal value (its factors of
production, as valued by use of a “surrogate” country).
A “nonmarket economy country” is any foreign country that the administering
authority determines does not operate on market principles of cost or pricing
structures, so that sales of merchandise in such country do not reflect the
fair value of the merchandise.
In all three methods, the amount by which the normal value
exceeds the U.S. price is the “dumping margin.” The duty specified in an
antidumping duty order reflects the weighted average dumping margins found by
the USDOC, both for the specific exporters it examined and for all other
exporters.
This rate of duty (in addition to any ordinary customs duty owed) will be
applied to subsequent imports from the specified producers/exporters in the
country involved, but it may be adjusted if the USDOC receives a request for an
annual review.
The Commission instituted 58 new antidumping investigations,
and made 54 preliminary determinations and 36 final determinations in 2017.
As a result of affirmative final USDOC and Commission determinations, in 2017,
the USDOC issued 33 antidumping duty orders on 15 products from 16 countries (table
2.1). The status of all antidumping investigations active at the Commission
during 2017—including, if applicable, the date of final action—is presented in
appendix table A.10. A list of all antidumping duty orders and suspension
agreements (agreements to suspend investigations)
in effect as of the end of 2017 appears in appendix table A.11.
Table 2.1
Antidumping duty orders that became
effective during 2017
|
Trade partner
|
Product
|
Range of dumping margins
(percent)
|
|
Austria
|
Carbon and alloy steel cut-to-length plate
|
53.72
|
|
Belgium
|
Carbon
and alloy steel cut-to-length plate
|
5.40–51.78
|
|
Brazil
|
Carbon and alloy steel cut-to-length plate
|
74.52
|
|
Brazil
|
Emulsion
styrene-butadiene rubber
|
19.61
|
|
China
|
1,1,1,2 Tetrafluoroethane (R-134a)
|
148.79–167.02
|
|
China
|
1-Hydroxyethylidene-1,
1-diphosphonic acid (HEDP)
|
167.58–184.01
|
|
China
|
Ammonium sulfate
|
493.46
|
|
China
|
Amorphous
silica fabric
|
162.47
|
|
China
|
Biaxial integral geogrid products
|
372.81
|
|
China
|
Carbon
and alloy steel cut-to-length plate
|
68.27
|
|
China
|
Large residential washers
|
32.12–52.51
|
|
China
|
Stainless
steel sheet and strip
|
63.86–76.64
|
|
France
|
Carbon and alloy steel cut-to-length plate
|
6.15–148.02
|
|
Germany
|
Carbon
and alloy steel cut-to-length plate
|
5.38–21.03
|
|
India
|
Finished carbon steel flanges
|
11.32–12.58
|
|
India
|
New
pneumatic off-the-road tires
|
4.90–5.36
|
|
Italy
|
Carbon and alloy steel cut-to-length plate
|
6.08–22.19
|
|
Italy
|
Finished
carbon steel flanges
|
79.17–204.53
|
|
Japan
|
Carbon and alloy steel cut-to-length plate
|
14.79–48.67
|
|
Japan
|
Steel
concrete reinforcing bar
|
206.43–209.46
|
|
Mexico
|
Emulsion styrene-butadiene rubber
|
19.52
|
|
Poland
|
Emulsion
styrene-butadiene rubber
|
25.43
|
|
South Africa
|
Carbon and alloy steel cut-to-length plate
|
87.72–94.14
|
|
South
Korea
|
Carbon
and alloy steel cut-to-length plate
|
7.39
|
|
South Korea
|
Dioctyl terephthalate (DOTP)
|
2.71–4.08
|
|
South
Korea
|
Emulsion
styrene-butadiene rubber
|
9.66–44.30
|
|
South Korea
|
Ferrovanadium
|
3.22–54.69
|
|
South
Korea
|
Phosphor
copper
|
8.43
|
|
Spain
|
Finished carbon steel flanges
|
18.81–24.43
|
|
Taiwan
|
Carbon
and alloy steel cut-to-length plate
|
2.80–8.01
|
|
Taiwan
|
Steel concrete reinforcing bar
|
3.62–6.95
|
|
Turkey
|
Carbon
and alloy steel cut-to-length plate
|
3.62–6.95
|
|
Turkey
|
Steel concrete reinforcing bar
|
5.39–8.17
|
Source:
Compiled by USITC from
Federal Register
notices.
Note:
Antidumping duty orders become effective following final affirmative
determinations by USDOC and the Commission. The rates in the table apply in
addition to any ordinary customs duty owed.
Countervailing Duty Investigations
The U.S. countervailing duty law is also set forth in Title
VII of the Tariff Act of 1930, as amended.
It provides for the imposition of additional duties to offset (“countervail”)
foreign subsidies on products imported into the United States.
In general, procedures for such investigations are similar to those under the
antidumping law. Petitions are filed with the USDOC (the administering
authority) and with the Commission. Before a countervailing duty order can be
issued, the USDOC must find that a countervailable subsidy exists. In addition,
the Commission must make an affirmative determination that a U.S. industry is
materially injured or threatened with material injury, or that the
establishment of an industry is materially retarded, because of the subsidized
imports.
The Commission instituted 26 new countervailing duty
investigations, and made 17 preliminary determinations and 16 final
determinations during 2017. USDOC issued 11 countervailing duty orders on 9
products from 5 countries in 2017 as a result of affirmative USDOC and
Commission determinations (table 2.2). The status of all countervailing duty
investigations active at the Commission during 2017, and, if applicable, the
date of final action, is presented in appendix table A.12. A list of all
countervailing duty orders and suspension agreements
in effect at the end of 2017 appears in appendix table A.13.
Table 2.2
Countervailing duty orders that became
effective during 2017
|
Trade partner
|
Product
|
Range of countervailable subsidy rates (percent)
|
|
China
|
Biaxial integral geogrid products
|
15.61–152.50
|
|
China
|
Ammonium
sulfate
|
206.72
|
|
China
|
Amorphous silica fabric
|
48.94–135.39
|
|
China
|
Carbon
and alloy steel cut-to-length plate
|
251.00
|
|
China
|
Stainless steel sheet and strip
|
75.60–190.71
|
|
China
|
1-Hydroxyethylidene-1,
1-diphosphonic acid (HEDP)
|
0.75–54.11
|
|
India
|
New pneumatic off-the-road tires
|
4.72–5.36
|
|
India
|
Finished
carbon steel flanges
|
5.66–9.11
|
|
South Korea
|
Carbon and alloy steel cut-to-length plate
|
3.62–148.02
|
|
Sri
Lanka
|
New
pneumatic off-the-road tires
|
2.18
|
|
Turkey
|
Steel concrete reinforcing bar
|
16.21
|
Source:
Compiled by USITC from
Federal Register
notices.
Note:
Countervailing duty orders become effective following final affirmative
determinations by USDOC and the Commission. The rates in the table apply in
addition to any ordinary customs duty owed.
Reviews of Outstanding Antidumping and Countervailing Duty
Orders/Suspension Agreements
Section 751(a) of the Tariff Act of 1930 requires the USDOC,
if requested, to conduct annual reviews of outstanding antidumping duty and
countervailing duty orders to ascertain the amount of any net subsidy or
dumping margin and to determine compliance with suspension agreements. Section
751(b) also authorizes the USDOC and the Commission, as appropriate, to review
certain outstanding determinations and agreements after receiving information
or a petition that shows changed circumstances.
Where a changed-circumstances review is directed to the Commission, the party that
is asking to have an antidumping duty order or countervailing duty order
revoked or a suspended investigation terminated has the burden of persuading
the Commission that circumstances have changed enough to warrant revocation.
On the basis of either the USDOC’s or the Commission’s review, the USDOC may
revoke an antidumping duty or countervailing duty order in whole or in part, or
may either terminate or resume a suspended investigation.
Section 751(c) of the Tariff Act of 1930 requires both the
USDOC and the Commission to conduct “sunset” reviews of existing antidumping
duty and countervailing duty orders and suspension agreements five years after
their publication. These reviews are intended to determine whether revoking an
order or terminating a suspension agreement would be likely to lead to the
continuation or recurrence of dumping or a countervailable subsidy and of
material injury.
If either the USDOC or the Commission reaches a negative determination, the
order will be revoked or the suspension agreement terminated. During 2017, the
USDOC and the Commission instituted 32 sunset reviews of existing antidumping
and countervailing duty orders or suspended investigations,
and the Commission completed 46 reviews. As a result of affirmative determinations
by the USDOC and the Commission, 45 antidumping duty and countervailing duty
orders were continued. Appendix table A.14 lists, by date and action, the
reviews of antidumping duty and countervailing duty orders and suspended
investigations completed in 2017.
Section 129 Investigations
Section 129 of the U.S. Uruguay Round Agreements Act sets
out a procedure by which the Administration may respond to an adverse WTO panel
or Appellate Body report concerning U.S. obligations under the WTO agreements
on safeguards, antidumping, or subsidies and countervailing measures.
Specifically, section 129 establishes a mechanism permitting the USTR to
request that the agencies concerned—the USDOC and the Commission—issue a
consistency or compliance determination, where such action is appropriate, to
respond to the recommendations in a WTO panel or Appellate Body report.
Large Residential Washers from South Korea.
On September 26, 2016, the WTO Dispute Settlement Body (DSB) adopted the panel
and Appellate Body reports in United States—Anti-Dumping and Countervailing
Measures on Large Residential Washers from Korea (DS464). On September 26,
2016, the United States stated that it intends to implement the recommendations
of the DSB in this dispute in a manner that respects U.S. WTO obligations, and
that it will need a reasonable period of time in which to do so. On April 13,
2017, an Article 21.3(c) arbitrator determined that the requested time period
for implementation would expire on December 26, 2017.
On December 15, 2017, USTR requested that USDOC make a
determination under section 129 of the Uruguay Round Agreements Act to address
the DSB’s recommendations relating to USDOC’s CVD investigation of washers from
South Korea. On December 18, 2017, USDOC initiated a section 129 proceeding.
The section 129 proceeding is expected to be completed in 2018.
Section 337 of the Tariff Act of 1930, as amended,
prohibits certain unfair practices in the import trade. The unfair practice
most frequently investigated by the Commission is patent infringement. In this
context, section 337 prohibits the importation into the United States, the sale
for importation, and the sale within the United States after importation of
articles that infringe a valid and enforceable United States patent, provided
that an industry in the United States, relating to articles protected by the
patent concerned, exists or is in the process of being established.
Similar requirements govern investigations involving infringement of other
federally registered IPRs, including registered trademarks, registered
copyrights, registered mask works, and registered vessel hull designs. In addition,
the Commission has general authority to investigate other unfair methods of
competition and unfair acts in the importation and sale of products in the
United States (such as products manufactured abroad using stolen U.S. trade
secrets), the threat or effect of which is to destroy or injure a U.S.
industry, to prevent the establishment of a U.S. industry, or to restrain or
monopolize trade and commerce in the United States.
The Commission may institute an investigation on the basis of a complaint or on
its own initiative.
If the Commission determines that a violation exists, it can
issue an exclusion order directing U.S. Customs and Border Protection to block
the imports in question (“subject imports”) from entry into the United States.
The Commission can also issue cease and desist orders that direct the violating
parties to stop engaging in the unlawful practices. The orders enter into force
unless disapproved for policy reasons by the USTR
within 60 days of issuance.
During calendar year 2017, there were 130 active section 337
investigations and ancillary (secondary) proceedings, 74 of which were
instituted that year. Of these 74 new proceedings, 59 were new section 337
investigations and 15 were new ancillary proceedings relating to previously
concluded investigations. In 54 of the new section 337 investigations
instituted in 2017, patent infringement was the only type of unfair act
alleged. Of the remaining 5 investigations, 1 involved allegations of patent
infringement and trademark infringement; 1 involved allegations of patent
infringement, trademark infringement, copyright infringement, false
advertising, and passing off; 1 involved allegations of trademark infringement,
copyright infringement, and unfair competition; 1 involved allegations of false
advertising; and 1 involved allegations of trade secret misappropriation.
The Commission completed a total of 64 investigations and
ancillary proceedings under section 337 in 2017, including 1 remand proceeding,
1 modification proceeding, 2 advisory opinion proceedings, 1 enforcement
proceeding, 2 declassification proceedings, and 8 rescission proceedings. In
addition, the Commission issued 5 general exclusion orders, 12 limited
exclusion orders, and 30 cease and desist orders during 2017. The Commission
terminated 30 investigations without determining whether there had been a
violation. Of these investigations, 19 were terminated on the basis of
settlement agreements and/or consent orders, 10 were terminated based on
withdrawal of the complaint, and 1 was terminated for other good cause shown.
Commission activities involving section 337 proceedings in 2017 are presented
in appendix table A.15.
The section 337 investigations active in 2017 continued to
involve a broad spectrum of products. As in prior years, technology products
were the single largest category, with approximately 38 percent of the active
proceedings involving computer and telecommunications equipment and another 6
percent involving consumer electronics. Pharmaceuticals and medical devices
became the second-largest category and were at issue in about 13 percent of the
active proceedings. Automotive, transportation, and manufacturing products were
at issue in about 10 percent of the active proceedings. The remaining 33
percent of active proceedings involved a wide variety of other types of
articles, including arrowheads for recreational hunting, robotic vacuum
cleaners, lighted mirrors, pool and spa enclosures, reusable diapers, shaving
cartridges, LED lighting devices, gas spring nailers, insulated beverage
containers, cases and mounts for smartphones, and food flavorings.
At the close of 2017, 65 section 337 investigations and
related proceedings were pending at the Commission. As of December 31, 2017,
there were 109 exclusion orders based on violations of section 337 in effect.
Appendix table A.16 lists the investigations in which these exclusion orders
were issued. Copies of the exclusion orders are available on the Commission’s
website at
https://www.usitc.gov/intellectual_property/exclusion_orders.htm
.
For additional detailed information about 337 investigations instituted since
October 1, 2008, see the Commission’s 337Info database, found at
https://pubapps2.usitc.gov/337external
.
In April 2017, the U.S. Secretary of Commerce (“Secretary”)
initiated investigations on imports of steel and aluminum, respectively, under
the national security provisions of section 232 of the Trade Expansion Act of
1962.
Section
232 requires the Secretary to submit a report to the President within 270 days
of institution of an investigation. The report must include the Secretary’s
findings “with respect to the effect of the importation of such article in such
quantities or under such circumstances upon the national security” and his
recommendations for action or inaction. The statute also provides that if the
Secretary finds that the imported article “is being imported into the United
States in such quantities or under such circumstances as to threaten to impair
the national security,” he is to so advise the President in his report.
The Secretary initiated the steel investigation on April 19,
2017. On April 20, 2017, the President signed a memorandum directing the
Secretary to proceed expeditiously in conducting the investigation. The
President further directed that if the Secretary finds that steel is being
imported into the United States in such quantities or under such circumstances
as to threaten to impair the national security, the Secretary is to recommend
the actions and steps that should be taken to adjust steel imports so that they
will not threaten to impair the national security.
In a press release the USDOC stated that the
Secretary had initiated the steel investigation for the purpose of considering
overcapacity, dumping, illegal subsidies, and other factors to determine
whether steel imports threaten U.S. economic security and military
preparedness. The press release noted that the United States currently imposed
no tariffs on imports of steel, but that it had to impose antidumping and
countervailing duties in over 150 cases, with another 13 currently pending.
The press release also cited, among other things, military needs for specialty
steel alloys that are used for armor, vehicles, ships, aircraft, and
infrastructure, and the need for a healthy domestic steel industry that could
guarantee military supply chains in the event of a conflict.
USDOC invited the public to submit comments relating to the investigation and
held a public hearing on May 24, 2017. The investigation was in progress at the
end of 2017 (box 2.1).
The Secretary initiated the investigation on aluminum
imports on April 26, 2017. On April 27, 2017, the President signed a memorandum
directing the Secretary to proceed expeditiously in conducting his
investigation. The President further directed that the Secretary, if he finds
that aluminum is being imported into the United States in such quantities or
under such circumstances as to threaten to impair the national security,
recommend actions and steps that should be taken to adjust aluminum imports so
that they will not threaten to impair the national security.
In a press release published on its website, USDOC indicated that the Secretary
initiated the investigation on aluminum imports “in light of the large volumes
of excess global aluminum production and capacity—much of which results from
foreign government subsidies and other unfair practices—which distort the U.S.
and global aluminum markets.” In the release, USDOC also noted that aluminum is
used in a variety of commercial, infrastructure, and defense applications.
USDOC invited the public to submit comments relating to the investigation and
held a public hearing on June 22, 2017. The investigation was in progress at
the end of 2017 (box 2.1).
|
Box 2.1
National
security investigations on steel and aluminum, developments January–March
2018
|
|
Steel
investigation.
U.S. Secretary
of Commerce Wilbur L. Ross transmitted to the President a report on his
department’s national security investigation of U.S. steel imports on January
11, 2018. Based on findings in the report, the Secretary concluded that “the
present quantities and circumstance of steel imports are ‘weakening our
internal economy’ and threaten to impair the national security as defined in
Section 232.” He found that several important factors—including the level of
global excess capacity, the level of U.S. imports, the reduction in basic
U.S. oxygen furnace facilities since 2001, and the potential impact of
further U.S. plant closures on capacity needed in a national
emergency—supported recommending action under Section 232. To address the
threat and to enable U.S. steel producers to operate at about an 80 percent
or better capacity utilization rate based on available capacity in 2017, the
Secretary recommended two alternative courses of action: (1) apply a quota to
imports of flat, long, semi-finished, pipe and tube, and stainless steel
(“subject steel”) at a level of 63 percent of each country’s 2017 import
levels, or (2) apply a tariff to imports of subject steel at a rate of 24
percent ad valorem.
On March 8,
2018, the President issued Proclamation 9705, which imposed a tariff at a
rate of 25 percent ad valorem on imports of subject steel, but exempted
imports of subject steel from Canada and Mexico pending ongoing discussions.
The President subsequently issued
Proclamation 9711 of March 22, 2018, temporarily exempting Australia,
Argentina, South Korea, Brazil, and the European Union (EU) from the tariff
after having found satisfactory alternative means to address the national
security concern.
Aluminum
investigation.
Secretary Ross
transmitted to the President a report on his department’s national security
investigation of U.S. aluminum imports on January 19, 2018. In the report,
the Secretary concluded that “the present quantities and circumstances of
aluminum imports are ‘weakening our internal economy’ and threaten to impair
the national security as defined in Section 232.” He further concluded, among
other things, that “the U.S. Department of Defense and critical domestic
industries depend on large quantities of aluminum,” that “import trends have
left the United States almost totally reliant on foreign producers of primary
aluminum” (i.e., unwrought aluminum that is not from recycled sources), that
“the United States is at risk of becoming completely reliant on foreign
producers of high-purity aluminum essential for key military and commercial
systems,” and that “the domestic aluminum industry is at risk of becoming
unable to satisfy existing national security needs or respond to a national
security emergency that requires a large increase in domestic production.” In
response, the Secretary sought to raise domestic production of primary
aluminum to about 1.45 million metric tons, or about 80 percent of existing
U.S. primary aluminum production capacity. To accomplish this, he recommended
two alternative courses of action, one involving a global quota or tariff,
the other involving a tariff on imports from certain economies. Specifically,
the President: (1) would either impose a worldwide quota on imports of
primary aluminum and five types of wrought aluminum (“subject aluminum”) at a
level of 86.7 percent of 2017 import levels, or apply a tariff on all imports
of subject aluminum at a rate of 7.7 percent ad valorem, or (2) would impose
a tariff on imports of subject aluminum from a subset of economies (China,
Hong Kong, Russia, Venezuela, and Vietnam) at a rate of 23.6 percent ad
valorem. The Secretary stated that these five economies “are the source of
substantial imports due to significant overcapacity and potential unreliable
suppliers or likely sources of transshipped aluminum from China.”
On March 8, 2018, the President issued
Proclamation 9704, which imposed a tariff at a rate of 10 percent ad valorem,
in addition to the current rate of duty, on imports of subject aluminum, but
exempted imports of subject aluminum from Canada and Mexico pending ongoing
discussions.
The President
subsequently issued Proclamation 9710, temporarily exempting Australia,
Argentina, South Korea, Brazil, and the EU from the tariff after having found
satisfactory alternative means to address the national security concern.
|
The United States provides trade adjustment assistance (TAA)
to aid U.S. workers and firms adversely affected by import competition.
On June 29, 2015, President Barack Obama signed into law the Trade Preferences
Extension Act (TPEA). Title IV of the TPEA—the Trade Adjustment Assistance
Reauthorization Act of 2015 (TAARA 2015)—amended and reauthorized TAA for six
years, until June 30, 2021.
The main TAA programs in effect in fiscal year (FY) 2017 were TAA for Workers,
administered by the U.S. Department of Labor (USDOL), and TAA for Firms,
administered by the U.S. Department of Commerce (USDOC). A third program, TAA
for Farmers, administered by the U.S. Department of Agriculture (USDA), was
reauthorized by Congress through the TPEA of 2015.
However, the U.S. Congress did not appropriate funding for new participants in
this program for FY 2017. As a result, USDA did not accept any new petitions or
applications for benefits in FY 2017.
Selected developments in the TAA programs for workers and
firms during FY 2017 are summarized below.
The provisions relating to TAA for Workers are set out in
chapter 2 of title II of the Trade Act of 1974.
The program provides federal assistance to eligible workers who have been
adversely affected by import competition. The TAA program offers a variety of
benefits and services to eligible workers, including training, help with
healthcare premium costs, trade readjustment allowances, reemployment
assistance, and employment and case management services.
Current information on provisions of the TAA for Workers program, as well as
detailed information on program eligibility requirements, benefits, and
available services, is available at the USDOL’s Employment and Training
Administration (ETA) website for TAA,
https://www.doleta.gov/tradeact/
.
For petitioning workers to be eligible to apply for TAA, the
Secretary of Labor must determine that they meet certain criteria relating to
the reasons they were separated from their firm, including declining sales or
production at their firm and increased imports of like or directly competitive
articles.
(Workers often apply in groups based on their former firms.) Workers at firms
that are or were suppliers to or downstream users of the output of
TAA-certified firms may also be eligible for TAA benefits.
When the Commission makes an affirmative determination in a
global safeguard investigation under section 202 of the Trade Act of 1974,
USDOL is required to submit a report to the President under section 224(a) of
the Trade Act of 1974 on the number of workers in the relevant industry and the
extent to which adjustment of workers might be facilitated through existing
programs.
More specifically, USDOL’s report is required to address (1) the number of
workers in the domestic industry producing the like or directly competitive
article(s) who have been or are likely to be certified as eligible for TAA; and
(2) the extent to which the adjustment of such workers to the import
competition may be facilitated through the use of existing programs.
In 2017, USDOL submitted two such reports to the President following Commission
affirmative determinative determinations in safeguard investigations on (1)
imports of crystalline silicon photovoltaic cells (CSPV cells), and (2) imports
of large residential washers (washers).
In its reports, USDOL estimated the number of workers involved in the
production of either CSPV cells or washers who have been certified eligible to
apply for TAA since 2012, as well as the number of additional workers likely to
be covered by certified TAA petitions before the end of 2019. USDOL also found
that enough funding is available to provide TAA benefits and services to these
workers, and that training and benefits under various federal programs are
sufficient to assist workers to adjust to the trade impact. USDOL submitted its
reports on CSPV cells and washers to the President in November 2017 and
December 2017, respectively.
In FY 2017, $716.4 million was allocated to state
governments to fund the TAA for Workers program. This funding included $391.4
million for “training and other activities,” which includes funds for training,
job search allowances, relocation allowances, employment and case management
services, and related state administration; $293.7 million for trade
readjustment allowance benefits; and $31.2 million for reemployment trade
adjustment assistance benefits.
Groups of workers submitted 1,037 petitions for TAA in FY
2017, down 30.8 percent from the 1,498 petitions filed in FY 2016.
The USDOL certified 844 petitions covering 94,017 workers as eligible for TAA,
and denied 234 petitions covering 32,038 workers.
The largest number of petitions certified in FY 2017 was in the West census
region, followed by the Northeast, South, and the Midwest (table 2.3).
By state, California had the most workers certified (12,338 workers), followed
by Washington (7,416 workers), Michigan (7,135 workers), Texas (5,501 workers),
and Pennsylvania (4,219 workers).
Table 2.3
TAA certifications, by region, FY 2017
|
U.S. Census region
|
No. of petitions certified
|
No. of workers covered
|
|
West
|
223
|
31,786
|
|
Northeast
|
222
|
13,414
|
|
South
|
212
|
26,126
|
|
Midwest
|
184
|
22,392
|
|
Puerto Rico
|
3
|
299
|
|
Total
|
844
|
94,017
|
Source: USDOL,
ETA, email message to USITC staff, March 16, 2018.
The majority (57.7 percent, 487 petitions) of the TAA
petitions certified during FY 2017 were in the manufacturing sector, covering
60,346 workers, followed by the professional, scientific, and technical
services sector (11.6 percent, 98 petitions) and the finance and insurance
sector (7.9 percent, 67 petitions) (figure 2.1).
Figure
2.1
Share of TAA petitions
certified by industry sector in FY 2017
Source:
USDOL, ETA, email message to USITC staff, March 16, 2018.
Note: “Other”
includes all industry sectors where less than 20 petitions were certified in FY
2017. Underlying data can be found in appendix table
B.9
.
The TAA for Firms program
provides technical assistance to help U.S. firms experiencing a decline in
sales and employment to become more competitive in the global marketplace.
The program provides cost-sharing technical assistance to help eligible
businesses create and implement targeted business recovery plans. The program
pays up to 75 percent of the costs of developing the recovery plans, but firms
also contribute a share of the cost of creating and implementing their recovery
plans.
Current information on provisions of the TAA for Firms program, as well as
detailed information on program eligibility requirements, benefits, and
available services, is available at the USDOC’s Economic Development
Administration (EDA) website for TAA,
http://www.taacenters.org/
.
To be eligible for the program, a firm must show that an
increase in imports of like or directly competitive articles “contributed
importantly” to the decline in sales or production and to the separation or
threat of separation of a significant portion of the firm’s workers.
The program supports a nationwide network of 11 nonprofit or
university-affiliated Trade Adjustment Assistance Centers to help firms apply
for certification of eligibility and prepare and implement a business recovery
plan or adjustment proposal.
Firms generally have up to five years to implement an approved adjustment
proposal.
In FY 2017, the TAA for Firms program budget authorization
from Congress was $16 million, while FY 2017 actual funding appropriated for
the program was $13 million.
During FY 2016 (latest data available), EDA certified 68 petitions for
eligibility and approved 75 adjustment proposals.
The U.S. Generalized System of Preferences (GSP) program
authorizes the President to grant duty-free access to the U.S. market for about
3,500 products that are imported from designated developing countries and
territories.
Certain additional products (about 1,500 products) are allowed duty-free
treatment only when imported from countries designated as least-developed
beneficiary developing countries (LDBDCs).
The President’s authority to provide duty-free treatment under the GSP program
expired on December 31, 2017.
The goal of the GSP program is to accelerate economic growth
in developing countries by offering unilateral tariff preferences for imports
into the U.S. market.
An underlying principle of the GSP program is that the creation of trade
opportunities for developing countries encourages broader-based economic
development and creates momentum for economic reform and liberalization.
Countries are designated as “beneficiary developing
countries” under the GSP program by the President, although they can lose this
designation based on findings of country practices that violate the provisions
of the GSP statute, including inadequate protection of IPRs or of
internationally recognized worker rights.
Complaints about such violations (country practice allegations) are usually
brought to the attention of the interagency GSP subcommittee by a petition
process. Some beneficiary developing countries are also designated as LDBDCs,
and, as such, are eligible for GSP benefits for an additional list of about
1,500 products.
The President also designates the articles that are eligible
for duty-free treatment, but may not designate articles that he determines to
be “import sensitive” in the context of the GSP. Certain goods (e.g., most
footwear, textiles, and apparel) are designated by statute as “import
sensitive” and thus not eligible for duty-free treatment under the GSP program.
The statute further provides that countries “graduate” from the program when
they become “high income,” as defined by the World Bank’s per capita income
tables.
In addition, the statute allows for ending the eligibility of certain imports,
or imports from specific countries, under certain conditions.
Competitive need limitations (CNLs) are another important
part of the GSP program’s structure. CNLs are quantitative ceilings on GSP
benefits for each product and beneficiary developing country.
The GSP statute provides that a beneficiary developing country will lose its
GSP eligibility with respect to a product if the CNLs are exceeded, though
waivers may be granted under certain conditions. Two different measures for
CNLs may apply to U.S. imports of a particular product from a beneficiary
developing country during any calendar year. One CNL measure applies to imports
from a beneficiary developing country that account for 50 percent or more of
the value of total U.S. imports of that product. The other applies to imports
that exceed a certain dollar value ($180 million in 2017).
The legislation to reauthorize the GSP program in 2006 provided that a CNL
waiver in effect on a product for five or more years should be revoked if total
U.S. imports from a beneficiary developing country exceed certain
“super-competitive” value thresholds—that is, 75 percent of all U.S imports or
150 percent of the current year’s CNL dollar limit.
The following developments with respect to the U.S. GSP
program occurred in 2017:
Presidential Proclamation 9687 of December 22,
2017, ended the suspension of Argentina’s GSP benefits, effective January 1,
2018.
Argentina’s GSP benefits had been suspended in March 2012, based on Argentina’s
failure to enforce arbitral awards in good faith. Argentina’s GSP benefits had
previously been partially removed as the result of a country practice review of
Argentina’s protection of IPRs. That earlier partial suspension was not ended
by Proclamation 9687, in light of ongoing concerns with Argentina’s protection
of IPR.
-
Presidential Proclamation 9687 of December 22,
2017, also partially removed GSP eligibility from Ukraine, effective April 26,
2018, as the result of a country practice review of Ukraine’s protection of
IPRs. This partial removal covered 147 HTS subheadings. Ukraine had previously
lost its GSP eligibility in 2001, also because of its failure to adequately
protect IPRs, but was reinstated in 2006.
-
GSP eligibility was extended to all GSP
beneficiaries for 23 HTS numbers for travel goods (including luggage, backpacks,
handbags, and wallets) that had become eligible for LDBDCs and AGOA countries
on June 30, 2016, as a result of the 2015/2016 GSP Annual Review.
-
Additional results of the 2016/2017 GSP Annual
Review included denial of two petitions to add a product (preserved or prepared
pineapple and high-carbon ferromanganese) to GSP eligibility for all countries;
removal of one product (glycine) from GSP eligibility for all beneficiary
developing countries; granting five petitions to add products as eligible for
all beneficiary developing countries (rolled or flaked cereals other than oats
or barley, saturated acyclic monocarboxylic acids, certain finishing agents,
cellulose nitrates in primary forms, and essential oils of lemon); and granting
one CNL waiver for a coniferous wood product from Brazil. Two products were
newly excluded for exceeding CNL thresholds (heterocyclic aromatic pesticides
from India, and setts (small paving block), curbstones, and flagstones from
Turkey). De minimis CNL waivers were granted for 100 eligible products.
No products that had been excluded during prior GSP reviews, but for which
import levels had dropped below the threshold amounts set for the current
review, were redesignated as GSP eligible.
-
In an action separate from the GSP annual
review, in June 2017, USTR self-initiated a country practice review of
Bolivia’s eligibility for GSP benefits because of concerns about Bolivia’s
implementation of its commitments to eliminate the worst forms of child labor
and to afford internationally recognized worker rights, including a minimum age
for the employment of children.
This was the first self-initiated GSP review in over 20 years.
U.S. imports under GSP preferences rose 11.9 percent from
$19.0 billion in 2016 to $21.2 billion in 2017. This increase accounted for 9.9
percent of total U.S. imports from GSP beneficiary countries and 0.9 percent of
U.S. imports from all countries (tables 2.4 and A.2). The GSP utilization rate
for 2017 (total imports claimed under GSP as a share of eligible imports from
GSP countries) was 49.6 percent, a slight increase (1.3 percentage points) over
2016.
India was the leading source of imports entered under the
GSP program in 2017, followed by Thailand and Brazil, continuing a pattern
established in 2011 (appendix table A.17). These three countries together
accounted for 57.8 percent of all U.S. imports under GSP in 2017, while the top
five countries (including Indonesia and Turkey) accounted for 74.7 percent of
GSP imports. U.S. imports from all five countries increased in 2017 over the
previous year.
Table 2.4
U.S. imports for consumption from GSP
beneficiaries, 2015–17
|
Item
|
2015
|
2016
|
2017
|
|
Total imports from GSP beneficiaries (million $)
|
206,534
|
201,586
|
215,201
|
|
Total imports under GSP
(million $)
|
17,759
|
18,953
|
21,215
|
|
Imports
under LDBDC provisions (million $)
|
25
|
58
|
115
|
|
Imports under non-LDBDC
provisions (million $)
|
17,734
|
18,895
|
21,100
|
|
Imports under GSP (as a share of all imports from
GSP countries)
|
8.6
|
9.4
|
9.9
|
|
Imports
under GSP (as a share of all imports eligible for GSP)
|
45.4
|
48.3
|
49.6
|
Source:
USITC DataWeb/USDOC (accessed March 14, 2018).
Note:
Because of rounding, figures may not add to totals shown. LDBDC =
least-developed beneficiary developing country. The President’s authority to
provide duty-free treatment under the GSP program expired on December 31, 2017.
LDBDC-eligible products are those for which the rate of duty of “free” appears
in the special rate column of the HTS, followed by the symbol “A+” in parentheses.
The symbol “A+” indicates that all LDBDCs (and only LDBDCs) are eligible for
duty-free treatment with respect to all articles listed in the designated
provisions.
Non-LDBDC-eligible products are those for which a rate of duty of “free” appears
in the special rate column of the HTS followed by the symbols “A” or “A*” in
parentheses. The symbol “A” indicates that all beneficiary countries are
eligible for duty-free treatment with respect to all articles listed in the
designated provisions. The symbol “A*” indicates that certain beneficiary
countries (specified in general note 4(d) of the HTS) are not eligible for
duty-free treatment with respect to any article listed in the designated
provision.
Not all
products are eligible for GSP.
In 2017, the chemicals sector was again the top sector for
imports claiming eligibility under GSP (up $720 million, an increase of 18.8
percent) (appendix tables A.18 and A.19). The minerals and metals sector ranked
second in 2017, as it did in 2016 (up $795 million, an increase of 23.6
percent). Agricultural products made up the third-largest sector and also saw
imports claiming GSP eligibility increase $105 million (3.3 percent) over 2016.
Among the top 15 U.S. imports under GSP, all imports except one increased in
2017 (appendix table A. 20). Gold jewelry imports were the leading GSP import
product by value. Those imports increased 18.9 percent from 2016, with Turkey,
Indonesia, and South Africa accounting for 68.3 percent of the GSP trade.
Ferrochromium was the second GSP import by value, sourced primarily from South
Africa and Turkey. GSP imports of ferrochromium increased 82.4 percent over the
2016 amount. Nonalcoholic beverages (including milk-based drinks) sourced
primarily from Thailand, were the third-highest GSP import in 2017 by value at
$347 million.
Nepal Trade Preference Program
The Nepal Trade Preference Act (NTPA) was established under
Section 915 of the Trade Facilitation and Trade Enforcement Act of 2015, which
was signed into law on February 24, 2016.
The NTPA entered into effect on December 30, 2016.
This program was designed to improve Nepal’s export competitiveness and help
Nepal’s economic recovery following a 2015 earthquake.
The NTPA is scheduled to expire on December 31, 2025.
The NTPA authorizes the President to provide preferential
treatment to articles imported directly from Nepal into the United States if
the President determines that Nepal meets certain requirements set forth in the
NTPA, AGOA, and GSP statutes.
The
NTPA
originally gave Nepal duty-free access to the U.S. market for goods in 66 HTS
8-digit tariff lines, including certain luggage and flat goods in chapter 42 of
the HTS, certain carpets and floor coverings in chapter 57, some apparel in
chapters 61 and 62, two non-apparel made-up textile articles in chapter 63, and
various headwear items in chapter 65.
Because of changes made to the HTS in July 2016, Nepal was eligible for
duty-free treatment on 77 tariff lines, 31 of which are also duty free under
GSP, when the program entered into effect in December.
However, the NTPA’s rules of origin differ from the GSP’s; i.e., under the
NTPA, U.S. content may be counted towards part of the 35 percent value added
requirement.
In 2017, the first full year that the NTPA was in effect,
total U.S. imports from Nepal were $91.7 million; imports from Nepal under GSP
were $8.5 million (9.3 percent of total imports from Nepal); and imports under
the NTPA were $2.3 million (2.5 percent of total imports from Nepal) (table
2.5). U.S. imports under NTPA and GSP as a share of all imports from Nepal that
were eligible for NTPA and GSP preferences was 57.8 percent in 2017.
Table 2.5
U.S. imports for consumption from Nepal,
2015–17
|
Item
|
2015
|
2016
|
2017
|
|
Total imports from Nepal (thousand $)
|
86,854
|
88,294
|
91,695
|
|
Imports under GSP
(thousand $)
|
5,469
|
9,426
|
8,498
|
|
Imports
under NTPA (thousand $)
|
0
|
0
|
2,256
|
|
Share
of total imports from Nepal
|
|
|
|
|
Imports
under GSP (percent)
|
6.3
|
10.7
|
9.3
|
|
Imports under NTPA
(percent)
|
0.0
|
0.0
|
2.5
|
|
Imports under NTPA and GSP as a share of all imports
eligible for NTPA and GSP (percent)
|
|
|
57.8
|
Source:
USITC DataWeb/USDOC (accessed March 14, 2018).
U.S.
imports under NTPA were first recorded in 2017.
Enacted in 2000, the African Growth and Opportunity Act
(AGOA) gives tariff preferences to eligible sub-Saharan African (SSA) countries
pursuing political and economic reform.
In particular, AGOA provides duty-free access to the U.S. market for all
GSP-eligible products, and for more than 1,800 additional (AGOA-only)
qualifying HTS 8-digit tariff-line items. While AGOA’s eligibility criteria
and rules of origin
are similar to those of the GSP program, AGOA beneficiary countries are exempt
from the GSP CNLs.
AGOA also provides duty-free treatment for certain apparel articles cut and
sewn in designated beneficiary countries on the condition that additional eligibility
criteria are satisfied.
The current AGOA expiration date is September 30, 2025.
Each year, the President must consider whether individual
SSA countries are, or remain, eligible for AGOA benefits based on the
eligibility criteria. The Office of the U.S. Trade Representative (USTR)
initiates this annual eligibility review with the publication of a notice in
the
Federal Register
requesting comments and announcing a public
hearing. As a result of the annual review covering calendar year 2017, during
the year a total of 38 SSA countries
were designated as eligible for AGOA benefits, 8 countries
were not designated as eligible because they did not meet the eligibility
criteria, and 2 countries (Equatorial Guinea and Seychelles) were not
designated as eligible because they had graduated from GSP.
No AGOA countries lost benefits in 2017, and The Gambia and Swaziland were
re-designated as eligible for benefits, effective December 22, 2017.
In addition to the annual review process, any interested
party may submit a petition to USTR, at any time, with respect to whether a
beneficiary SSA country is meeting the AGOA eligibility requirements for an
out-of-cycle review.
On March 21, 2017, the Secondary Materials and Recycled Textiles Association
filed a petition requesting an out-of-cycle review of AGOA eligibility for
Kenya, Rwanda, Tanzania, and Uganda. The petition asserted that a March 2016
decision by the four countries to raise tariffs and phase in a ban on imports
of used clothing and footwear imposed a significant economic hardship on the
U.S. used clothing industry, and was a violation of the AGOA eligibility
criteria to eliminate barriers to U.S. trade and investment. USTR proceeded
with an out-of-cycle review of AGOA eligibility for Rwanda, Tanzania, and
Uganda, but not Kenya, stating that Kenya took steps to reverse the tariff
increases, effective July 1, 2017, and pledged not to ban imports of used
clothing.
A public hearing was held on July 13, 2017.
Those SSA countries that are designated as AGOA
beneficiaries may also be eligible for duty-free treatment for certain textile
and apparel articles if USTR determines the country has adopted an effective
visa system and all related procedures required to protect against illegal
transshipment of such articles. On August 22, 2017, USTR announced that Togo
became eligible to use AGOA’s apparel provisions.
Including Togo, a total of 27 AGOA countries were eligible to use AGOA’s
apparel benefits in 2017.
If an AGOA country loses its beneficiary status, but is later reinstated, then
the AGOA country must update its visa system and related measures in order to,
again, make use of the AGOA apparel benefits.
Preferential treatment for apparel under AGOA requires
apparel to be made from U.S. or SSA regional yarns and fabrics, cut and
assembled in one or more AGOA countries that are eligible for the program’s
apparel benefits. In addition, AGOA lesser-developed countries (LDCs) may use
fabric of any origin and still qualify for duty-free treatment up to a specified
annual quantitative limit, the so-called “third-country fabric cap.”
Of the SSA countries eligible for textile and apparel benefits, only South
Africa is not considered an LDC for the purposes of this third-country fabric
provision.
There are additional apparel provisions for the use of designated
“short-supply” fabrics (fabrics not commercially available in the United
States) and for folklore or handmade articles.
In 2017, the value of U.S. imports that entered duty-free
from beneficiary countries under AGOA was $12.5 billion, an increase of 32.4
percent from the $9.5 billion imported in 2016 (table 2.6). An additional $1.3
billion from AGOA beneficiary countries entered duty-free under GSP. In total,
U.S. imports under AGOA, including GSP, were $13.8 billion in 2017, accounting
for 55.4 percent of total U.S. imports from AGOA beneficiary countries and 90.0
percent of all U.S. imports from AGOA beneficiary countries that were eligible
for AGOA and GSP trade preferences in 2017.
Table 2.6
U.S. imports for consumption from AGOA beneficiaries, 2015–17
|
Item
|
2015
|
2016
|
2017
|
|
Total imports from AGOA countries (million $)
|
19,139
|
20,062
|
24,947
|
|
Imports under AGOA
(million $)
|
9,268
|
10,626
|
13,811
|
|
Imports
under AGOA, excluding GSP (million $)
|
7,984
|
9,451
|
12,512
|
|
Imports
under AGOA (as a share of all imports from AGOA countries)
|
48.4
|
53.0
|
55.4
|
|
Imports under AGOA (as a share of all imports
eligible for AGOA)
|
84.2
|
88.7
|
90.0
|
Source:
USITC DataWeb/USDOC (accessed March 14, 2018).
AGOA-eligible products are those for which a rate of
duty of “free” appears in the special rate column of the HTS followed by the
symbol “D” in parentheses. The symbol “D” indicates that all AGOA beneficiaries
are eligible for duty-free treatment with respect to all articles listed in the
designated provisions. In addition, provisions of subchapters II and XIX of
chapter 98 of the HTS set forth specific categories of AGOA-eligible products,
under the terms of separate country designations enumerated in subchapter
notes. Includes imports for which preferential tariff treatment was claimed for
AGOA-eligible goods by U.S. importers under GSP, for HTS rate lines with
special duty symbols “A,” “A*” (unless the AGOA beneficiary country is
excluded), or “A+.”
Imports under AGOA includes AGOA-eligible products
that may be imported under both AGOA and GSP. It is up to the exporting country
or importer to choose under which program it will claim preferential treatment.
Not all products are eligible for AGOA.
Crude petroleum continued to be the leading import under
AGOA, accounting for 73.2 percent of U.S. imports under AGOA in 2017. The
increase in U.S. imports under AGOA in 2017 compared to 2016 can be attributed
to an increase in the value and quantity of imports of crude petroleum
(appendix table A.21).
The value of U.S. crude petroleum imports under AGOA increased 47.5 percent
($3.0 billion) from 2016 to 2017, and the quantity increased 18.2 percent (26.2
million barrels) over the same period.
In 2017, 87.7 percent ($8.0 billion) of imports of crude petroleum from AGOA
beneficiaries came from the top two suppliers, Nigeria ($5.8 billion) and
Angola ($2.2 billion).
Each of the top two suppliers is heavily reliant on exports of crude petroleum.
Crude petroleum accounted for 95.0 percent of U.S. imports under AGOA from
Nigeria in 2017 and for 99.1 percent of U.S. imports under AGOA from Angola.
Following Nigeria and Angola, South Africa was the
third-largest supplier of goods under AGOA in 2017 (appendix table A.22). The
most important U.S. import under AGOA from South Africa was passenger motor
vehicles,
which accounted for 65.0 percent of U.S. imports under AGOA from South Africa
($1.2 billion) and 9.4 percent of all U.S. imports under AGOA in 2017, ranking
it second among top imports under AGOA. South Africa was the only AGOA country
to provide this product to the United States in 2017 (appendix table A.21).
Apparel
was the third-largest import under AGOA in 2017, valued at $1.0 billion, or
just 8.2 percent of total U.S. imports under AGOA. Unlike crude petroleum or
passenger motor vehicles, which are exported by one or two beneficiary
countries, U.S. apparel imports under AGOA are exported by over a dozen
beneficiary countries (table 2.7). The leading suppliers of apparel under AGOA
are Kenya, Lesotho, Madagascar, and Mauritius. For a majority of the AGOA
countries exporting apparel, AGOA’s textile and apparel provisions account for
all or nearly all of their AGOA usage.
Table 2.7
U.S. general imports of apparel under AGOA,
by country, 2015–17
|
FTA partner
|
2015
|
2016
|
2017
|
2016–17
|
|
|
|
Thousand $
|
|
% change
|
|
Kenya
|
367,035
|
338,370
|
339,375
|
0.3
|
|
Lesotho
|
299,314
|
294,309
|
288,958
|
-1.8
|
|
Madagascar
|
39,630
|
93,245
|
147,945
|
58.7
|
|
Mauritius
|
206,746
|
187,416
|
139,633
|
-25.5
|
|
Ethiopia
|
17,445
|
32,798
|
52,445
|
59.9
|
|
Tanzania
|
27,261
|
36,915
|
40,610
|
10.0
|
|
Ghana
|
9,101
|
6,093
|
8,210
|
34.7
|
|
South Africa
|
6,584
|
6,422
|
5,285
|
-17.7
|
|
Rwanda
|
174
|
452
|
1,494
|
230.5
|
|
Botswana
|
8,251
|
4,766
|
991
|
-79.2
|
|
Uganda
|
0
|
30
|
360
|
1,100.0
|
|
Malawi
|
6,268
|
1,556
|
321
|
-79.4
|
|
Other
AGOA
|
9
|
4
|
14
|
250.0
|
|
AGOA total
|
987,818
|
1,002,376
|
1,025,641
|
2.3
|
Source: U.S.
Department of Commerce, Office of Textiles and Apparel (OTEXA)
https://otexa.trade.gov/agoa-cbtpa/catv0.htm
(accessed April 12, 2018).
Section 105 of AGOA required the President to establish the
U.S.-Sub-Saharan Africa Trade and Economic Cooperation Forum (also known as the
AGOA Forum) to discuss trade, investment, and development at an annual
ministerial-level meeting with AGOA-eligible countries.
The 16th annual AGOA Forum was held in Lomé, Togo, on August 8–10, 2017. The
theme of the forum was “The United States and Africa: Partnering for Prosperity
through Trade.”
The Caribbean Basin Economic Recovery Act (CBERA) was
enacted in 1983 as part of the Caribbean Basin Initiative. Its goal was to
encourage economic growth and development in the Caribbean Basin countries by
using duty preferences to promote increased production and exports of
nontraditional products.
The Caribbean Basin Trade Partnership Act (CBTPA) amended CBERA in 2000 and
expanded the list of qualified articles for eligible countries to include
certain apparel.
The CBTPA also extended “NAFTA-equivalent treatment”—that is, rates of duty
equivalent to those accorded to goods complying with the rules of origin
applicable under the North American Free Trade Agreement (NAFTA)—to a number of
other products previously excluded from CBERA. These products included certain
tuna; crude petroleum and petroleum products; certain footwear; watches and
watch parts assembled from parts originating in countries not eligible for
normal trade relations (NTR) rates of duty; and certain handbags, luggage, flat
goods, work gloves, and leather wearing apparel.
Products that are still excluded from CBERA preferential treatment include
textile and apparel products not otherwise eligible for preferential treatment
under CBTPA (mostly textile products) and above-quota imports of certain
agricultural products subject to tariff-rate quotas (primarily sugar, beef, and
dairy products).
CBTPA preferential treatment provisions were extended in
2010 through September 30, 2020, while the original CBERA has no expiration
date.
In the section that follows, the term CBERA refers to CBERA as amended by the
CBTPA.
At the end of 2017, 17 countries and dependent territories
were designated eligible for CBERA preferences
and 8 of those countries were designated eligible for CBTPA preferences.
Several countries have asked to be designated as eligible for benefits under
CBERA, CBTPA, or both, including Turks and Caicos Islands, which requested
eligibility under CBERA; Aruba, The Bahamas, Dominica, Grenada, Montserrat, St.
Kitts and Nevis, and St. Vincent and the Grenadines, under CBTPA;
and Sint Maarten and Suriname, under both CBERA and CBTPA.
In 2017, the value of U.S. imports under CBERA increased by
10.3 percent to $961 million from $871 million in 2016 (table 2.8). The top
five imports under CBERA in 2017—methanol, T-shirts, polystyrene, sweaters, and
crude petroleum—comprised 80.7 percent of imports under the program (appendix
table A.23). The largest increase in the value of U.S. imports under CBERA was
in methanol, which rose by 49.4 percent to $378.3 million due primarily to a
51.9 percent increase in the price. Despite this increase, imports of methanol
under CBERA still were $272.5 million less in 2017 than in 2015. U.S. imports
of crude petroleum declined in 2017 mostly because of a decline in volume. U.S.
imports of apparel products under CBERA, entirely from Haiti in 2017, also
decreased, which can be attributed to a shift from such imports entering under
CBTPA provisions to entering under the HOPE Acts (discussed in the next
section), as provided in certain tariff provisions of subchapter XX of HTS
chapter 98.
Table 2.8
U.S. imports for consumption from
CBERA/CBTPA beneficiaries, 2015–17
|
Item
|
2015
|
2016
|
2017
|
|
Total imports from CBERA/CBTPA countries (million $)
|
7,061
|
5,342
|
5,872
|
|
Total imports under CBERA
(million $)
|
1,542
|
871
|
961
|
|
Imports
under CBTPA (million $)
|
564
|
392
|
344
|
|
Imports under CBERA,
excluding CBTPA (million $)
|
978
|
479
|
617
|
|
Imports under CBERA (as a share of all imports from
CBERA countries)
|
21.8
|
16.3
|
16.4
|
|
Imports
under CBERA (as a share of all imports eligible for CBERA)
|
58.6
|
44.7
|
41.8
|
Source:
USITC DataWeb/USDOC (accessed March 14, 2018).
CBTPA-eligible products are those for which a special
duty rate appears in the special rate column of the HTS, followed by the symbol
“R” in parentheses. The symbol “R” indicates that all CBTPA beneficiary
countries are eligible for special duty rate treatment with respect to all
articles listed in the designated provisions. In addition, subchapters II and
XX of chapter 98 set forth provisions covering specific products eligible for
duty-free entry, under separate country designations enumerated in those subchapters
(and including former CBTPA beneficiaries—El Salvador, Guatemala, Honduras,
Nicaragua, the Dominican Republic, Costa Rica, and Panama).
CBERA (excluding CBTPA)-eligible products are those
for which a special duty rate appears in the special rate column of the HTS,
followed by the symbols “E” or “E*” in parentheses. The symbol “E” indicates
that all beneficiary countries are eligible for special duty rate treatment
with respect to all articles listed in the designated provisions. The symbol “E*”
indicates that certain articles, under general note 7(d) of the HTS, are not
eligible for special duty treatment with respect to any article listed in the
designated provision.
Not all
imports are eligible for CBERA; a particular tariff category may not be
designated as such or a particular shipment may not meet program rules.
The top five products accounted for most CBERA imports in
2017. However, a large number of other products—particularly agricultural
products—were also imported under CBERA, including yams, melamine, spices,
guavas, orange juice, papayas, and various vegetable and fruit preparations,
although these imports were small.
U.S. imports under CBERA accounted for 16.4 percent of all
U.S. imports from CBERA countries in 2017 and 41.8 percent of U.S. imports from
CBERA countries that were eligible for CBERA trade preferences. Trinidad and
Tobago continued to be the leading supplier of U.S. imports under CBERA in 2017,
accounting for 50.8 percent of the total value. Trinidad and Tobago was the
sole supplier of top U.S. imports under CBERA, including methanol, petroleum
products, and melamine. Haiti and The Bahamas were the second and third leading
suppliers, accounting for 30.7 and 8.3 percent of the total, respectively
(appendix table A.24).
Haiti Initiatives
Since 2006, CBERA has been amended several times to expand
and enhance trade benefits for Haiti and to give Haitian apparel producers more
flexibility in sourcing yarns and fabrics.
The Haitian Hemisphere Opportunity through Partnership Encouragement Act of
2006 (HOPE Act)
and of 2008 (HOPE II Act)
(collectively referred to as HOPE or the HOPE Acts) amended CBERA to expand the
rules of origin for inputs to apparel and wire harness automotive components
assembled in Haiti and imported into the United States.
They also provided additional trade preferences to attract new jobs to Haiti
while offering incentives to encourage the use of U.S. inputs.
The Haitian Economic Lift Program of 2010 (HELP Act) expanded existing U.S.
trade preferences (especially duty-free treatment for certain qualifying
apparel, regardless of the origin of inputs
)
for Haiti that were established under the CBTPA and HOPE Acts and extended them
through September 30, 2020.
On June 29, 2015, President Barack Obama signed the Trade Preferences Extension
Act of 2015 into law, extending the HOPE Acts trade preferences through
September 30, 2025.
To date, there have been no other changes to the HOPE Acts, and duty-free
access to the U.S. market remains a major incentive for U.S. firms to import
apparel from Haiti.
The extension of trade preferences under the HOPE Acts has
contributed to the overall growth in U.S. apparel imports from Haiti in recent
years, together with Haiti’s low labor costs ($4.50–$6.00 per day),
proximity to the United States (resulting in a closer supply chain and shorter
lead times),
and an open economy.
However, in 2016 U.S. imports of apparel from Haiti dipped because of an
unstable retail climate in the United States that reduced U.S. demand for
apparel imports
and the bankruptcy of a South Korean suit and overcoat manufacturer that had
been producing apparel in Haiti.
In 2017, U.S. imports of apparel from Haiti resumed their overall growth of
recent years, rising by 2.1 percent to $866.0 million (table 2.9).
Table 2.9
U.S. imports of apparel from Haiti, 2015–17
|
Item
|
2015
|
2016
|
2017
|
|
Total apparel imports from Haiti (million $)
|
895.5
|
848.5
|
866.0
|
|
Apparel imports under a
trade preference program (million $)
|
892.5
|
842.9
|
854.1
|
|
CBERA/CBTPA
(million $)
|
394.9
|
307.9
|
277.2
|
|
HOPE and HELP Acts
(million $)
|
497.6
|
535.0
|
577.0
|
|
Share of total apparel imports from Haiti:
|
|
(Percent)
|
|
|
Apparel imports under a
trade preference program
|
99.7
|
99.3
|
98.6
|
|
CBERA/CBTPA
(percent)
|
44.1
|
36.3
|
32.0
|
|
HOPE and HELP Acts
(percent)
|
55.6
|
63.1
|
66.6
|
Source:
USITC DataWeb/USDOC (accessed March 14, 2018).
Note:
These data reflect detailed U.S. general import data under trade preference
programs sorted by category and published by the Office of Textiles and Apparel
at the U.S. Department of Commerce (accessed June 1, 2018).
For years, Haitian apparel production has been concentrated
in high-volume, commodity cotton garments that have relatively predictable
consumer demand and few styling changes. Major apparel firms such as Hanes,
Fruit of the Loom, and Gildan have been leading importers of cotton T-shirts
and cotton undergarments into the U.S. market from Haiti.
As in prior years, cotton knit shirts and blouses, cotton trousers and pants,
and cotton underwear dominated U.S. imports of apparel from Haiti, accounting
for 35.4 percent ($305.6 million), 12.4 percent ($106.8 million), and 7.6
percent ($65.7 million), respectively, of the total value of U.S. apparel
imports from Haiti in 2017.
However, these shares were lower than in 2016 and prior years.
In contrast, the share of total U.S. apparel imports from
Haiti accounted for by manmade-fiber garments (largely knit shirts and blouses
and trousers and slacks) continued to grow—rising from 34.4 percent ($292.4
million) in 2016 to 42.9 percent ($370 million) in 2017. Industry sources
attribute the steady shift in U.S. imports from Haiti from cotton apparel to
manmade-fiber garments to several factors: (1) greater duty savings under the
HOPE/Haiti Acts for apparel of manmade fibers because of their higher tariffs
(up to 32 percent ad valorem) compared to cotton apparel (for which tariffs
average around 16 percent);
(2) the ability provided under the HOPE Acts to use specialty, manmade-fiber
yarns from Asia to make apparel in Haiti;
(3) growing consumer demand for apparel made of synthetic blends;
(4) firms’ interest in diversifying their product offerings to maintain viable
business operations;
and (5) Haiti’s recently developed capacity to produce manmade-fiber apparel—an
ability that it lacked in the past.
A recent infusion of foreign investment has also been a
significant factor in the expansion of Haiti’s apparel production and exports.
Two of five foreign investors that had developed plans in 2016 to manufacture
apparel in Haiti’s Caracol Industrial Park—MAS Holdings (Sri Lanka) and Hansae
(South Korea)—began producing apparel by yearend 2017.
Other foreign investors— Yak-jin (South Korea), Everest Textiles (Taiwan), and
RSI (Taiwan)—are expected to start producing apparel (especially athleisure
wear) for U.S. clients soon.
In addition to the Caracol Industrial Park, the development of the privately
owned Lafito Industrial Free Zone (located 25 miles north of Haiti’s capital of
Port-au-Prince) is underway and expected to generate thousands of new apparel
jobs in the near future.
Moreover, Haiti has recently attracted the interest of Chinese and Vietnamese
investors who are exploring opportunities to produce apparel in Haiti,
suggesting the potential for continued apparel production growth.
Virtually all (98.6 percent) of U.S. imports of apparel from
Haiti entered free of duty under trade preference programs in 2017. These
programs offer unlimited duty-free treatment for certain apparel products and
limited duty-free treatment for other apparel products made from
non-originating fabrics up to certain quotas, known as tariff preference levels
(TPLs). These programs have helped to revitalize and expand Haiti’s apparel
industry, as evidenced by continued job growth in the sector: Haiti’s apparel
industry employed 47,356 people by yearend 2017 compared with 40,000 in 2016.
In 2017, Haiti accounted for all (100 percent) of U.S.
imports of apparel entering under the CBTPA. Just under one-third (32.0
percent) of total U.S. imports of apparel from Haiti ($277.2 million) entered
under CBTPA provisions in 2017.
This share fell for the second year in a row, reflecting a continued shift of
U.S. apparel imports from Haiti from entering under CBTPA provisions to
entering under the HOPE Acts because of the additional trade preferences that
the HOPE Acts offer. The value of U.S. imports of apparel entering under the
HOPE Acts rose 7.9 percent, from $535.0 million in 2016 to $577.0 million in
2017, and represented two-thirds (66.6 percent) of total U.S. apparel imports
that entered free of duty from Haiti, up from 63.1 percent in 2016. Of the
apparel imported from Haiti under the HOPE Acts in 2017, $537.5 million or 93.2
percent entered under TPLs.
Almost 26.6 percent ($142.8 million) of these U.S. imports of apparel from
Haiti entered under the woven apparel TPL in 2017, and 73.4 percent ($394.6
million) entered under the knit apparel and value-added TPLs the same year.
Most of the remaining U.S. imports ($36.3 million) under the
HOPE Acts in 2017 entered under the Earned Import Allowance Program (EIAP), a
special trade program created under HOPE II in 2008 that allowed the duty-free
entry into the United States of certain apparel manufactured in Haiti.
In contrast to a steady increase in U.S. imports entering under the EIAP in
prior years, U.S. imports of apparel from Haiti under the EIAP fell 39 percent,
from $59.1 million in 2016 to $36.3 million in 2017. Because the EIAP is based
on using fabrics of U.S. origin and has been used predominantly by woven bottom
producers in Haiti, the sharp drop in U.S. imports from Haiti under the EIAP
may be attributed to several factors. Declining denim production in the United
States has likely reduced the amount of U.S. fabric being sourced from Haiti,
with a resulting drop in EIAP eligibility.
In addition, the growing shift in U.S. imports of apparel under the CBTPA to
importing apparel under the tariff preference levels of the Haiti HOPE/HELP
Acts , which permit the use of third-country fabrics (sourced from Sri Lanka
and other countries, for example), also may have contributed to the decline in
U.S. imports under the EIAP.
As in previous years, no U.S. imports of apparel entered
under HTS 9820.61.45 in 2017. HTS 9820.61.45 is one of the HELP provisions
added in 2010 that allows for unlimited duty-free imports of certain knitted or
crocheted apparel. However, U.S. imports entering under HTS 9820.63.05, a
provision for home goods that was also added under HELP in 2010, rose to $2.7
million in 2017, up from $5,000 in 2016. This increase may be attributed to the
new production of certain home goods in Haiti for the U.S. market, which began
in 2017.
Top of the page
This chapter covers developments in 2017 in the World Trade
Organization (WTO). These include programs and related items under the WTO
General Council, as well as plurilateral agreements hosted under WTO auspices.
The chapter also summarizes developments in major WTO dispute settlement cases
during the year.
The WTO held its 11th Ministerial Conference (MC11) from
December 10 to 13, 2017, in Buenos Aires, Argentina. The conference concluded
with a number of outcomes, including a ministerial decision on fisheries
subsidies and a continuation of the customs duty moratorium on electronic
commerce, as well as additional commitments to continue negotiations in all
areas.
The Ministerial Decision on Fisheries Subsidies
will help fulfill commitments made under United Nations (UN) Sustainable
Development Goal 14.6
by opening negotiations on fisheries subsidies with the objective of reaching
agreement by the next WTO Ministerial Conference, to be held in 2019.
These negotiations aim at developing comprehensive and effective disciplines to
prohibit certain forms of fishery subsidies that have contributed to the
current overcapacity and overfishing, as well as to illegal, unreported, and
unregulated fishing.
WTO members also agreed to several work programs—one on
electronic commerce,
and another on small economies.
With respect to the former, members agreed to continue to refrain from levying
customs duties on so-called e-commerce transactions. For the latter, members
agreed to develop a proposal for a formal working group on micro, small, and
medium-sized enterprises (MSMEs), to be presented at the 2019 WTO ministerial
conference.
In addition, members agreed to continue their moratorium on
so-called non-violation and situation disputes in the area of intellectual
property
under the WTO Agreement on Trade-Related Aspects of Intellectual Property
Rights (TRIPS Agreement).
Such cases can arise when a member brings a WTO dispute settlement challenge
over an intellectual property action taken by another member, even where no
agreement or market commitment has been broken, because the complainant
considers the resulting situation to infringe on its own intellectual property
rights.
No agreement was reached at the Ministerial Conference on a
number of issues under negotiation in the Doha Round, including on the public
stockholding of foodstuffs for food security purposes. According to the WTO
Director-General Roberto Azevêdo in his closing remarks at the Ministerial
Conference, “There are some remaining topics, which our representatives should
continue negotiating....Members agreed to advance negotiations on all remaining
issues, including on the three pillars of agriculture, namely domestic support,
market access and export competition, as well as non-agriculture market access,
services, development, TRIPS, rules, and trade and environment.”
[266]
Furthermore, despite the lack of progress on issues considered essential by
developing country members in achieving sustainable and inclusive growth, the
Director-General noted the commitment of WTO members to advance negotiations on
remaining issues in Geneva, Switzerland, in 2018.
[267]
At the yearend meeting of the WTO General Council on
November 11, 2017, the WTO Director-General reported to members on informal
consultations held during the year among both large and small groupings of
delegates in efforts to resolve outstanding issues concerning the General
Council’s agenda.
In the WTO Council on Trade in Goods, three major issues were addressed in
2017: General Council waivers of obligations, enlargement of the European Union
(EU), and enlargement of the Eurasian Economic Union.
In the Council on Trade in Services, discussions remained unsuccessful in
finding ways to move forward with services negotiations.
In the TRIPS Council, member discussions revolved around whether negotiations
on a geographical-indications register for wines and spirits (under TRIPS
Article 23.4) should remain narrowly focused on wines and spirits, or whether
it should extend to additional products. The TRIPS Council also considered the
relationship between the TRIPS Agreement and the United Nations Convention on
Biological Diversity and the protection of traditional knowledge and folklore.
In particular, the council talked about proposals on disclosing sources of
biological material and associated traditional knowledge.
Work Programs, Decisions, Waivers, and Reviews
In addition to reviewing past decisions related to ongoing
WTO work programs—in particular, those from the WTO ministerial conferences
held in Indonesia in December 2013 and in Kenya in December 2015—delegates at
the November 2017 General Council meeting focused on the upcoming ministerial
conference to be held in Buenos Aires, Argentina, in December 2017. They also
reviewed work programs undertaken as part of the Doha Development Agenda,
including work programs on electronic commerce, small economies, and
aid-for-trade measures. They also reviewed work directed at benefiting the
least-developed country members, including the Director-General’s report on the
developmental aspects of cotton.
Work Program on Electronic Commerce
The Declaration on Global Electronic Commerce
was adopted at the May 1998 WTO ministerial conference in Geneva, Switzerland.
It called on the WTO General Council to establish a work program to examine
trade-related issues arising from global electronic commerce (e-commerce).
Discussions on e-commerce currently take place in four major WTO bodies.
In July 2017, members began to develop and submit papers on
various aspects of e-commerce, taking into consideration the upcoming December
2017 ministerial conference.
Bilateral discussions started in September 2017 between the chair of the
General Council and individual WTO members in four main areas: (1) the future
Work Program on Electronic Commerce; (2) the moratorium on imposing customs
duties on electronic transmissions that started under the 1998 Declaration; (3)
the possibility of future negotiations on e-commerce; and (4) the possible
establishment of an institutional structure—such as a working group—to provide
a single WTO body to help focus discussions on e-commerce.
At the ministerial conference in December 2017, members
agreed to extend the practice of not imposing customs duties on electronic
transmissions for another two years. They also committed to begin work toward
future WTO negotiations on the trade-related aspects of e-commerce.
Work Program on Small Economies
Members heard the report on the standing Work Program on
Small Economies during 2017, which focused on how work on global value chains
can be marshalled to benefit small, vulnerable economies. The WTO Committee on
Trade and Development, which chairs the work program, reported that members
agreed to continue discussions on how to reduce trade costs for small
economies, particularly in the area of trade facilitation.
Sixth Global Review on Aid for Trade
The WTO Director-General reported on the Sixth Global Review
on Aid for Trade, held in 2017.
He reported that issues covered included trade facilitation; connectivity
infrastructure; e-commerce; gender issues; investment; the least-developed
countries; MSMEs; trade and finance; and the UN Sustainable Development Goals,
which affect capacity-building for countries benefiting from aid-for-trade
measures.
Review of the Exemption under Paragraph 3(c) of the GATT 1994 (
“
Jones Act
”
Exemption)
The General Council held the 2017 biennial review of the
exemption under Paragraph 3(c) of GATT 1994 concerning maritime cabotage
in U.S. waters (commonly known as the “Jones Act” exemption) on the same basis
as the 2015 review, where statistical information was provided by the United
States.
The General Council noted remarks by interested delegations, and indicated that
under the two-year review cycle set out in paragraph 3(b)
of GATT 1994 the next review would take place in 2019.
Review of Waivers of Obligations under Article IX:4 of the WTO Agreement
In 2017, the General Council held reviews of several
multiyear waivers regarding adoption of nomenclature changes made to the
Harmonized System in 2002, 2007, and 2017, into WTO members’ tariff schedules.
The General Council also reviewed other previously agreed waivers, including
U.S. waivers related to the African Growth and Opportunity Act
and the Caribbean Basin Economic Recovery Act.
WTO Membership
There were 164 members of the World Trade Organization in
2017.
There were also 23 observers to the WTO by yearend, with South Sudan requesting
observer status on November 16, 2017.
According to USTR, six observers appeared actively engaged in the WTO accession
process.
No accessions to the WTO took place during the year, although the General
Council named a new chairman to lead discussions on the bid by Bosnia and
Herzegovina to join.
In addition, there were eight observer organizations to the WTO.
Appointment of Director-General
The General Council agreed to appoint Roberto Azevêdo as the
Director-General of the WTO for a second term of four years, starting on
September 1, 2017.
Other Business
Informal dialogues and workshops also took place during the
November 2017 General Council meeting. Various groups of delegates met to
discuss MSMEs as well as Investment Facilitation for Development. Workshops
focused on MSMEs and on trade and investment matters.
The WTO Agreement on Trade Facilitation entered into force
on February 22, 2017,
after two-thirds of WTO members, including the United States, notified the WTO
that they had ratified the agreement. The agreement establishes multilateral
trade rules under the WTO to reduce delays in customs and border procedures for
trade in goods across national borders.
At yearend 2017,
there were 127 WTO members that had deposited their acceptance of the agreement
with the WTO.
The Committee on Trade
Facilitation––established as part of the Agreement on Trade Facilitation––held
its inaugural session on May 16, 2017, to confirm the committee’s first chair.
In July, the committee received updates on the status of ratification and
notification processes, as well as on activities of the Trade Facilitation
Agreement Facility.
At the third committee meeting in 2017—and the
last one of the year—delegates reviewed a series of notifications under
different articles as mandated by the Trade Facilitation Agreement.
The majority of these submissions were under
articles 15 and 16––so-called category A, B, and C notifications.
Agreement on Trade in Civil Aircraft
The Agreement on Trade in Civil Aircraft eliminates import
duties on all aircraft (other than military aircraft) and other products
covered by the agreement, such as aircraft engines, their parts and components,
all components and sub-assemblies of civil aircraft, and flight simulators and
their parts and components. It also covers disciplines concerning government
procurement and financial support in the civil aircraft sector.
The agreement entered into force on January 1, 1980, and is one of two
plurilateral agreements (along with the Agreement on Government Procurement)
carried out under the auspices of the 1995 World Trade Organization
that commits signatories to core disciplines applicable only to those parties
signing the agreement. There were 32 signatories to the WTO Agreement on Trade
in Civil Aircraft in 2017, including the United States, and 20 of which were EU
member states.
The WTO Committee on Trade in Civil Aircraft held a regular meeting on November
1, 2017, to discuss updating the agreement’s aviation product list to be
compatible with the 2007 version of the Harmonized System.
Agreement on Government Procurement
The Agreement on Government Procurement (GPA) covers core
disciplines such as transparency, competition, and good governance in public
authorities’ procurement of goods, services, and capital infrastructure.
In 2017, there were 19 parties that had signed the original 1994 Agreement on
Government Procurement, including the United States.
These parties were also signatories to the 2012 Revised Agreement on Government
Procurement, except for Switzerland, whose acceptance of the revised agreement
was pending at yearend. The EU is a party in its own right to both the 1994 and
the 2012 GPA, as are each of the 28 EU member states. Macedonia (also known as
FYROM) applied for GPA accession in March 2017.
Expansion of the Information Technology Agreement
The Information Technology Agreement (ITA)
is a plurilateral agreement that eliminates tariffs on certain information and
communications technology products, such as computers, telecommunication
equipment, semiconductors, semiconductor manufacturing and testing equipment,
software, and scientific instruments, as well as most of the parts and
accessories for these products.
It was concluded by 29 participants at the December 1996 Singapore Ministerial
Conference.
In 2017, the ITA had 53 participants, accounting for 82 WTO members, including
the United States.
Following preliminary discussions in May 2012, a subset of
ITA participants opened talks on the possibility of broadening product coverage
under the original ITA, given advances in technology since the original 1996
agreement.
In July 2015, after 17 rounds of negotiations, participants in the ITA
Expansion agreed to a list of 201 additional products on which they would
eliminate customs duties.
These new items included products such as new-generation multicomponent
integrated circuits (MCOs), touch screens, GPS navigation equipment, portable
interactive electronic education devices, video game consoles, and medical
equipment, such as magnetic resonance imaging products and ultrasonic scanning
apparatus.
Because the most-favored-nation principle applies to multilateral WTO
agreements, all WTO members will benefit from duty-free access to the markets
of the parties to the ITA Expansion.
Following needed domestic ratification procedures in the
member countries, the first set of tariff reductions under the ITA expansion
took place on July 1, 2016. A majority of participants had implemented their
initial tariff commitments by yearend 2016.
On July 1, 2017, the second set of reductions took place.
Negotiations on an Agreement on Trade in Environmental Goods
On July 8, 2014, a group of WTO members launched
plurilateral negotiations toward an Environmental Goods Agreement (EGA). The
goal of these talks is to reduce customs duties on products used to treat and
benefit the environment, including products that help generate clean and
renewable energy, improve energy and resource efficiency, control air
pollution, manage waste products, treat waste water, monitor the quality of the
environment, and combat noise pollution.
In 2017, there were 18 participants, representing 46 WTO members, working
toward an EGA: Australia; Canada; China; Costa Rica; the EU; Hong Kong, China;
Iceland; Israel; Japan; South Korea; Liechtenstein; New Zealand; Norway;
Singapore; Switzerland; Taiwan; Turkey; and the United States.
Between 2014 and 2016, 18 rounds of negotiations were held.
No rounds took place in 2017. At the June and November 2017 meetings of the WTO
Trade and Environment Committee, delegates were briefed that EGA participants
continued to look for a way to move forward in these negotiations. A number of
members participating in the negotiations (Canada, the EU, Hong Kong, Japan,
South Korea, New Zealand, Norway, Singapore, Switzerland, Taiwan, and Turkey)
voiced their willingness to continue talks, and invited other members to join
in.
Negotiations on an Agreement on Fisheries Subsidies
The establishment of international disciplines on fisheries
subsidies has been under discussion in the WTO’s Negotiating Group on Rules
since the Doha Development Agenda was launched in 2001, with an elaboration of
the negotiating mandate in 2005. The adoption by world leaders in September
2015 of the UN’s Sustainable Development Goals (SDGs) gave renewed impetus to
these talks.
SDG target 14.6 set a deadline of 2020 for eliminating
subsidies that contribute to illegal, unreported, and unregulated (IUU)
fishing, and for prohibiting certain forms of fishery subsidies that contribute
to overcapacity and overfishing. Negotiations to establish fisheries
disciplines will also ensure special and differential treatment for developing
and least-developed countries.
On October 12, 2017, members engaged in these negotiations
circulated to the WTO Negotiating Group on Rules a draft compilation text based
on proposals by seven groups participating in these talks: (1) New Zealand,
Iceland, and Pakistan; (2) the EU; (3) Indonesia; (4) the African, Caribbean,
and Pacific Group; (5) Argentina, Colombia, Costa Rica, Panama, Peru, and
Uruguay; (6) the Least-developed Countries Group; and (7) Norway. Other members
suggested additional amendments to this text, including China, Japan, India,
the United States, and others, on issues such as transparency and institutional
matters as well as subsidies that contribute to IUU fishing.
Nonetheless, a consensus text could not be reached by the
end of the WTO Ministerial Conference in December 2017. As a result, ministers
issued a decision saying that they would continue to work toward a fisheries
agreement, with a view toward its adoption by the 2019 WTO Ministerial
Conference.
This section provides an overview of the WTO dispute
settlement process as well as information about proceedings during calendar
year 2017, particularly those in which the United States was a complaining or
responding party. More specifically, this section provides (1) a tally of new
requests for consultations filed by WTO members during calendar year 2017 under
the WTO Dispute Settlement Understanding (DSU); (2) a table that lists the new
dispute settlement panels established during calendar year 2017 in which the
United States was either the complaining party or the named respondent; and (3)
short summaries of the procedural and substantive issues in disputes involving
the United States that moved to the panel stage during 2017, as well as
summaries of panel and Appellate Body reports issued during 2017 in disputes
that involved the United States. At the end of this section, U.S. concerns with
the WTO dispute settlement process are described. Figure 3.1 provides a
timeline for the WTO dispute settlement process prepared by the WTO. The
references in the timeline are to articles in the WTO Dispute Settlement
Understanding.
Figure 3.1
Timeline for the WTO Dispute Settlement
Process
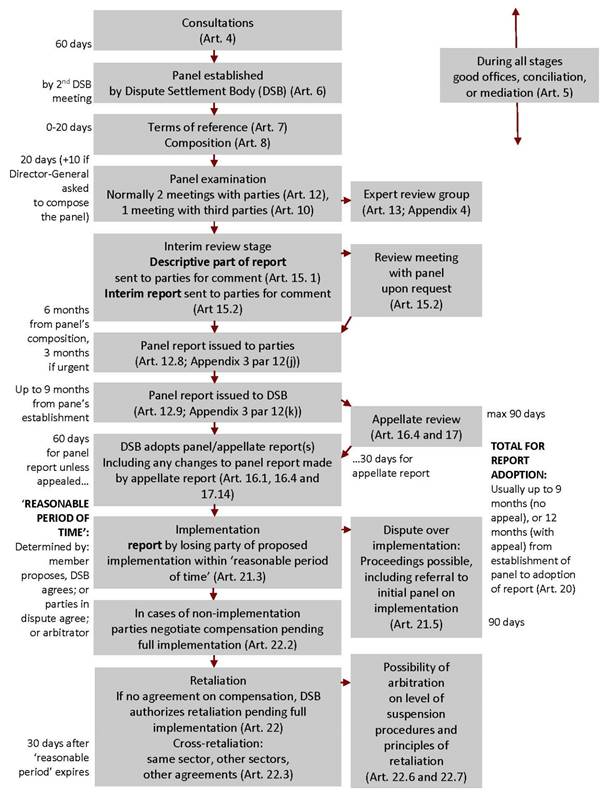
The summaries in this section of issues and findings and
recommendations in panel and Appellate Body reports are based entirely on
information in publicly available documents, including summaries published
online by the WTO, summaries included in USTR’s
2018 Trade Policy Agenda
and 2017 Annual Report
, and summaries included in USTR press releases. The
summaries in this report should not be regarded as comprehensive or as
reflecting a U.S. government or Commission interpretation of the issues raised
or addressed in the disputes or in panel or Appellate Body reports. A table
showing procedural developments during 2017 in disputes in which the United
States was the complainant or respondent appears in appendix table A.25.
This section focuses on developments during 2017. Several
disputes in which panels had been established and composed in 2016 were active
during 2017, with decisions expected in 2018; the panel decisions in these
cases will be summarized in the Commission’s report covering 2018.
A number of additional disputes in which dispute settlement consultations were
requested in 2016 remained in the consultation phase throughout 2017 without
further developments, at least as posted by the WTO on its dispute settlement
website.
This section also generally focuses only on developments
through the panel and Appellate Body stage and does not include matters that
arose after the Dispute Settlement Body (DSB) adopted panel or Appellate Body
reports in the original dispute. As indicated in the flowchart in figure 3.1,
dispute litigation often continues beyond the adoption of the panel or
Appellate Body report, particularly when the defending party is the “losing”
party. Issues may arise about the reasonableness of the time sought by the
losing party to implement findings and recommendations, the adequacy of actions
taken by that party to comply with the findings and recommendations, and
possible compensation and retaliation. Matters may be referred to the original
panel or to a new panel for further findings and recommendations on compliance
and other matters, and when appropriate, the parties may seek the help of an
arbitrator to resolve matters.
Appendix table A.25 sets out the timeline for procedural
actions in specific active WTO dispute settlement cases, including procedural
actions at the implementation, compliance, and compensation/retaliation stages.
A number of disputes were still active during 2017 well after the panel or
Appellate Body report had been adopted, including a dispute with respect to
U.S. measures relating to the importation, marketing, and sale of tuna and tuna
products;
as well as a dispute relating to China’s antidumping and countervailing
measures on broiler products from the United States.
During 2017 WTO members filed 17 new requests for dispute
settlement consultations, which was about the average for the five preceding
years. Three members—the United States, Canada, and Qatar—each filed 3 requests
and accounted for slightly over half the requests filed during 2017. The
Russian Federation and Ukraine each filed 2 requests, and Brazil, Indonesia,
Mexico, and Turkey each filed 1 request during 2017. Three members, the United
States, Canada, and the Russian Federation, were the named respondents in
slightly over half the requests, with the United States the named respondent in
4 of the requests, while Canada was the named respondent in 3 requests and the
Russian Federation in 2 requests during 2017. Australia, Bahrain, China, the
EU, Kazakhstan, Saudi Arabia, Ukraine, and the United Arab Emirates were each
the named respondent in 1 request during 2017. Two of the 3 requests filed by
the United States during 2017 were against Canada, and the third was against
China, while 3 of the requests in which the United States was the named
respondent were filed by Canada, while the fourth was filed by Turkey. The
issues presented in these disputes are described below. Unlike the trend in
recent years, in which China and the EU were a named party in multiple disputes
each year, either as a complainant or respondent, neither filed a new request
for dispute settlement consultations during 2017, and each was named respondent
in only 1 new request filed during 2017.
All three complaints that the United States filed during
2017 were still at the consultation stage as of the end of 2017. The first of
the complaints related to subsides paid by China to producers of primary
aluminum. In the complaint, the United States alleged that China’s measures
appear to be inconsistent with its obligations under Articles 5(c), 6.3(a),
6.3(b), 6.3(c), and 6.3(d) of the Subsidies and Countervailing Measures
Agreement (SCM Agreement) and Article XVI:1 of the GATT 1994. The United States
filed its request for consultations on January 12, 2017.
In the view of the United States, China appears to provide subsidies through
artificially cheap loans from banks and through artificially low-priced inputs
for aluminum production, such as coal, electricity, and alumina.
In the second and third complaints, both of which concerned measures maintained
by the Canadian province of British Columbia governing the sale of wine in
grocery stores, the United States claimed that the measures appear to be inconsistent
with Article III:4 of the GATT 1994.
The United States maintains that the measures provide advantages to British
Columbia wine by granting exclusive access to a retail channel (selling wine on
grocery store shelves) by allowing only British Columbia wine to be sold on
regular grocery store shelves. Imported wine may be sold in grocery stores only
through a so-called “store within a store.”
As of the end of 2017, three of the four disputes filed
against the United States during 2017 were still in the consultation phase;
only one had advanced to the panel stage. The first of the four disputes was
filed by Turkey on March 8, 2017, and it concerned countervailing duty measures
imposed by the United States on imports of certain pipe and tube products from
Turkey. Turkey requested establishment of a panel. A panel was established on
June 19, 2017, and composed on September 14, 2017. The issues raised in this
dispute are further summarized in the next section of this chapter, which
covers new panels established during 2017 in which the United States was a
named party.
The remaining three requests for consultations were filed by
Canada, and all three related to U.S. countervailing duty and antidumping
measures. Two of the requests were filed on November 28, 2017, and concerned
U.S. countervailing duty measures and U.S. antidumping measures, respectively,
on softwood lumber from Canada. In the countervailing duty measures dispute (DS533),
Canada claimed that the measures appear to be inconsistent with Articles
1.1(a), 1.1(b), 2.1(a), 2.1(b), 10, 11.2, 11.3, 14(d), 19.1 19.3, 19.4, 21.2,
21.2, 32.1, and 32.5 of the SCM Agreement and Article VI:3 of the GATT 1994.
Specifically, Canada challenged the U.S. Department of Commerce (USDOC)
determinations regarding benchmarks for stumpage, the log export permitting
processes, and non-stumpage programs.
In the antidumping measures dispute (DS534), Canada claimed that the measures
appear to be inconsistent with Articles 1, 2.1, 2.4, and 2.4.2 of the
Antidumping Agreement and Article VI:1 and VI.2 of the GATT 1994.
Specifically, Canada challenged the USDOC’s application of a differential
pricing methodology, including the United States’ use of zeroing when applying
the average-to-transaction comparison methodology.
Canada filed the third request for dispute settlement
consultations on December 20, 2017. Canada framed the request more broadly to
apply to certain U.S. laws, regulations, and other measures concerning
antidumping and countervailing duty proceedings, and claimed that the measures
appear to be inconsistent with multiple articles of the Antidumping Agreement
and SCM Agreement and also with Article VI:2, VI:3, and X:3(a) of the GATT 1994.
As indicated in table 3.1, four dispute settlement panels
were established during 2017 in which the United States was either the
requesting party (complainant) or the respondent party. The United States was
the complaining party in two disputes involving China, and the responding party
in two disputes filed by India and Turkey, respectively. As of the end of 2017,
panels had been composed in two of the four disputes (DS511 and DS523), and all
were still pending.
Table 3.1
WTO dispute settlement panels
established during 2017 in which the United States was a party
|
Case no.
|
Complainant
|
Respondent
|
Case name
|
Panel established
|
|
DS510
|
India
|
United States
|
United States—Certain Measures Relating to the
Renewable Energy Sector
|
03/21/2017
|
|
DS511
|
United
States
|
China
|
China—Domestic
Support for Agricultural Producers
|
01/25/2017
|
|
DS517
|
United States
|
China
|
China—Tariff Rate Quotas for Certain Agricultural
Products
|
09/22/2017
|
|
DS523
|
Turkey
|
United
States
|
United
States—Countervailing Measures on Certain Pipe and Tube Products
|
09/14/2017
|
Source: WTO, “
Dispute
Settlement: The Disputes—Chronological List of Disputes
” (accessed
May 19, 2017).
Panels Established during 2017 at the Request of the United States
China
—
Domestic
Support for Agricultural Products (DS511)
On September 16, 2016, the United States requested
consultations with China regarding certain measures through which China appears
to provide domestic support in favor of agricultural producers, in particular
those producing wheat, indica rice, japonica rice, and corn. The United States
claimed that the measures appear to be inconsistent with Articles 3.2, 6.3, and
7.2(b) of the Agreement on Agriculture. The parties consulted on the matter on
October 20, 2016, but the consultations did not resolve the matter. On December
5, 2016, the United States requested establishment of a panel, and the DSB
established a panel at its meeting on January 25, 2017. Following agreement of
the parties, the panel was composed on June 24, 2017.
China
—
Tariff
Rate Quotas for Certain Agricultural Products (DS517)
On December 15, 2016, the United States requested
consultations with China concerning China’s administration of its tariff-rate
quotas for certain agricultural products, including those for wheat, short and
medium grain rice, long grain rice, and corn. The United States claimed that
the measures appear to be inconsistent with Articles X:3(a), XI:1, and
XIII:3(b) of the GATT 1994; and Paragraph 1.2 of Part I of China’s Protocol of
Accession. On February 9, 2017, the United States and China held consultations
in Geneva. After the consultations failed to resolve U.S. concerns, the United
States requested establishment of a panel on August 31, 2017, and a panel was
established at the DSB meeting on September 22, 2017. As of the end of 2017,
the panel had not been composed.
Panels Established during 2017 in Which the United States Was the Named
Respondent
United States
—
Certain
Measures Relating to the Renewable Energy Sector (DS510)
On September 9, 2016, India requested WTO consultations
regarding certain U.S. measures relating to domestic-content requirements and
subsidies instituted by the governments of the states of Washington,
California, Montana, Massachusetts, Connecticut, Michigan, Delaware, and
Minnesota in the energy sector. India claimed that the measures appear to be
inconsistent with Articles III:4, XVI, and XVI:4 of the GATT 1994; Article 2.1
of the Agreement on Trade-related Investment Measures (TRIMS); and Articles
3.1(b), 3.2, 5(a), 5(c), 6.3(a), 6.3(c), and 25 of the SCM Agreement.
Consultations between India and the United States took place in Geneva on
November 16–17, 2016. On January 17, 2017, India requested the establishment of
a panel, and the DSB established a panel at its meeting on March 21, 2017. As
of the end of 2017, the panel had not been composed.
United States
—
Countervailing
Measures on Certain Pipe and Tube Products (DS523)
On March 8, 2017, Turkey requested WTO consultations
concerning countervailing duty measures imposed by the United States under four
final countervailing duty determinations issued by USDOC on certain pipe and
tube products from Turkey. Turkey claimed that the measures appear to be
inconsistent with Articles 1.1(a)(1), 1.1(b), 2.1(c), 2.4, 10, 12.7, 14(d),
15.3, 19.4, and 32.1 of the SCM Agreement and Article VI:3 of the GATT 1994.
Turkey challenged the application of measures in four final countervailing duty
determinations with respect to the provision of hot-rolled steel for less than
adequate remuneration. In addition, with respect to injury determinations,
Turkey challenged section 771(7)(G)(i) of the Tariff Act of 1930 regarding
cross-cumulation of imports.
On May 11, 2017, Turkey requested the establishment of a panel, and the DSB
established a panel at its meeting on June 19, 2017. At the request of Turkey,
the Director-General composed the panel on September 14, 2017.
During 2017, a WTO dispute settlement panel or the Appellate
Body issued a report in five disputes to which the United States was a party,
either as a complainant or as the respondent (table 3.2). The United States was
the complaining party in only one of those disputes, and was the responding
party in the four other disputes. This section covers only panel and Appellate
Body reports relating to the original disputes and does not include subsequent
reports, such as those of a compliance panel or an arbitrator. Many of the
latter reports are noted in table A.25, which contains a procedural summary of
most of the dispute settlement cases which are still active in some respect.
Table 3.2
WTO dispute settlement panel
and Appellate Body (AB) reports circulated and/or adopted in 2017 in which the
United States was a party
|
Case no.
|
Complainant
|
Respondent
|
Case name
|
Date of report circulation or
adoption
|
|
DS471
|
China
|
United
States
|
United States—Certain
Methodologies and Their Application to Anti-Dumping Proceedings Involving
China
|
Appellate
Body report circulated 05/11/2017; adopted 05/22/2017
|
|
DS478
|
United States
|
Indonesia
|
Indonesia—Importation of
Horticultural Products, Animals and Animal Products
|
Appellate Body report
circulated 11/09/2017; adopted 11/22/2017
|
|
DS487
|
European
Union
|
United
States
|
United
States—Conditional Tax Incentives for Large Civil Aircraft
|
Appellate
Body report circulated 09/04/2017; adopted 09/22/2017
|
|
DS488
|
South Korea
|
United States
|
United States—Anti-Dumping
Measures on Certain Oil Tubular Goods from Korea
|
Panel report circulated
11/14/2017; adopted 01/12/2018
|
|
DS491
|
Indonesia
|
United
States
|
United
States—Anti-Dumping and Countervailing Measures on Certain Coated Paper from
Indonesia
|
Panel
report circulated 12/06/2017; adopted 01/12/2018
|
Source: WTO, “
Dispute
Settlement: The Disputes—Chronological List of Disputes
” (accessed
May 19, 2017).
Reports in Which the United States Was the Complainant
Indonesia
—
Importation
of Horticultural Products, Animals and Animal Products (DS478)
On May 8, 2014, the United States requested consultations
with Indonesia concerning certain measures it imposed on the importation of
horticultural products, animals, and animal products. The United States claimed
that the measures are inconsistent with Articles III:4 and XI:1 of the GATT
1994; Article 4.2 of the Agreement on Agriculture; Articles 1.2, 1.5, 1.6, 2.2,
3.2, 3.3, 5.1, and 5.2 of the Import Licensing Agreement; and Articles 2.1 and
2.15 of the Agreement on Preshipment Inspection.
The United States was concerned that Indonesia, through its import licensing
regimes, imposed numerous prohibitions and restrictions on the importation of
covered products, including (1) prohibiting the importation of certain products
altogether; (2) imposing strict application windows and validity periods for
import permits; (3) restricting the type, quantity, and country of origin of
products that may be imported; (4) requiring that importers actually import a
certain percentage of the volume of products allowed under their permits; (5)
restricting the uses for which products may be imported; (6) imposing
local-content requirements; (7) restricting imports on a seasonal basis; and
(8) setting a “reference price” below which products may not be imported.
The measures at issue included import licensing regimes earlier amended by
Indonesia in response to previous U.S. requests for dispute settlement
consultations in January 2013 (DS455) and August 2013 (DS465).
On March 18, 2015, the United States requested establishment
of a panel. On May 20, 2015, the DSB established a single panel under Article
9.1 of the DSU to examine this dispute and dispute DS477, brought by New
Zealand. At the request of New Zealand and the United States, on October 8,
2015, the Director-General composed the panel.
The panel circulated its report on December 16, 2016. The
panel found that all of Indonesia’s import-restricting measures for
horticultural products and animal products are inconsistent with Article XI:1
of the GATT 1994. The panel also found that Indonesia failed to demonstrate
that the challenged measures are justified under any general exception
available under the GATT 1994.
Indonesia appealed the panel’s report to the Appellate Body
on February 17, 2017, and the Appellate Body issued its report on November 9,
2017. The Appellate Body affirmed the finding of the panel that all of
Indonesia’s measures are inconsistent with Article XI:1 of the GATT 1994 and,
as Indonesia did not establish an affirmative defense with respect to any
measure, affirmed that they are inconsistent with Indonesia’s WTO obligations.
At its meeting on November 22, 2017, the DSB adopted the
Appellate Body report and the panel report, as modified by the Appellate Body
report. On December 15, 2017, Indonesia informed the DSB that it required a
reasonable period of time to comply with the DSB’s recommendations and rulings
and that the 45-day deadline established by Article 21.3(b) of the DSU to reach
a mutually agreed reasonable period of time might need to be extended. On
January 11, 2018, Indonesia, New Zealand, and the United States informed the
DSB that in order to allow sufficient time for them to discuss a mutually
agreed period, they had agreed on deadlines for arbitration under Article
21.3(c) of the DSU.
Reports in Which the United States Was the Respondent
United States
—
Certain
Methodologies and Their Application to Anti-dumping Proceedings Involving China
(DS471)
On December 3, 2013, China requested consultations with the
United States regarding the use of certain methodologies in antidumping
investigations involving Chinese products. China claimed that the measures are
inconsistent with Articles 2.4.2, 6.1, 6.8, 6.10, 9.2, 9.3, 9.4 and Annex II of
the Antidumping Agreement and Article VI:2 of the GATT 1994. Specifically,
China challenged USDOC’s application in certain investigations and
administrative reviews of a “targeted dumping methodology,” “zeroing” in
connection with such methodology, a “single rate presumption for non-market
economies,” and a “NME-wide methodology” including certain “features.” China
also challenged a “single rate presumption” and the use of “adverse facts
available” “as such.”
On February 13, 2014, China requested establishment of a
panel, and the DSB established a panel at its meeting on March 26, 2014. The
Director-General composed the panel on August 28, 2014. On February 23, 2015,
the chair of the panel informed the DSB that the start of proceedings was
deferred due to the unavailability of Secretariat lawyers and that the panel,
under its adopted timetable, expected to issue its final report to the parties
in June 2016.
The panel circulated its report on October 19, 2016. The
panel found that a number of aspects of the “targeted dumping methodology”
applied by USDOC in three challenged investigations were not inconsistent with
the requirements of the Antidumping Agreement, including certain quantitative
aspects of USDOC’s methodology. However, the panel found fault with other
aspects of USDOC’s methodology and with USDOC’s explanation of why its resort
to the alternative methodology was necessary. The panel also found that USDOC’s
application of the alternative methodology to all sales, rather than only to
so-called pattern sales, and USDOC’s use of “zeroing” in connection with the
alternative methodology, were inconsistent with the second sentence of Article
2.4.2 of the Antidumping Agreement.
In addition, the panel questioned USDOC’s use of a
rebuttable presumption that all producers and exporters in China comprise a
single entity under common government control—the China-government entity—to
which a single antidumping margin is assigned, both as used in specific
proceedings and generally. The panel found that USDOC’s use of the presumption
is inconsistent with certain obligations in the WTO Antidumping Agreement
concerning when exporters and producers are entitled to a unique antidumping
margin or rate. However, the panel agreed with the United States that China had
not established that USDOC has a general norm whereby it uses adverse
inferences to pick information that is adverse to the interests of the
China-government entity in calculating its antidumping market or rate. The
panel decided to exercise judicial economy with respect to the information
USDOC used in particular proceedings.
On November 18, 2016, China appealed certain of the panel’s
findings regarding USDOC’s “targeted dumping methodology,” use of “adverse
facts available,” and the “single rate presumption.” The Appellate Body issued
its report on May 11, 2017. The Appellate Body rejected virtually all of
China’s claims on appeal and did not make any additional findings of inconsistency
against the United States.
On May 22, 2017, the DSB adopted the panel and Appellate
Body report. On June 19, 2017, the United States stated that it intended to
implement the recommendations of the DSB in a manner that respects U.S.
obligations, and that it would need a reasonable period of time in which to do
so. On October 17, 2017, China requested that an Article 21.3(c) arbitrator
determine the reasonable period of time for implementation.
On January 19, 2018, the Award of the Arbitrator was circulated to members; the
Arbitrator determined that the reasonable period is 15 months, expiring on
August 22, 2018.
United States
—
Conditional
Tax Incentives for Large Civil Aircraft (DS487)
On December 19, 2014, the EU requested consultations with
the United States with respect to conditional tax incentives established by the
State of Washington relating to the development, manufacture, and sale of large
civil aircraft. The EU alleged that the measures constitute specific subsidies
within the meaning of Articles 1 and 2 of the SCM Agreement and alleged that
such tax incentives are prohibited subsidies that are inconsistent with
Articles 3.1(b) and 3.2 of the SCM Agreement.
More specifically, the dispute concerned legislation enacted in the State of
Washington in November 2013, which amended and extended various tax incentives
for the aerospace industry. The EU identified seven separate tax incentives,
including a reduced business and occupation tax rate, credits against business
taxation, and exemptions from various other taxes in the State of Washington.
On February 12, 2015, the EU requested establishment of a
panel, and on February 23, 2015, the DSB established a panel. On April 22,
2015, at the request of the EU, the Director-General composed the panel.
On November 28, 2016, the panel report was circulated to
members. The panel found that only the Washington State business and occupation
tax incentive was a prohibited subsidy. While the panel found the six other tax
incentives to be subsidies, they were not deemed to be illegal under WTO rules.
On December 16, 2016, the United States appealed certain
issues of law and legal interpretations in the panel report, and on January 17,
2017, the EU notified the SSB of its decision to cross-appeal. The Appellate
Body circulated its report on September 14, 2017. The Appellate Body found that
none of the seven challenged programs were prohibited import-substitution
subsidies, and accordingly reversed the panel’s finding that the business and
occupation tax rate is a prohibited subsidy under Article 3.1(b) of the SCM
Agreement. Having reversed the panel’s sole finding of inconsistency, the
Appellate Body made no recommendation in the dispute.
The DSB adopted the Appellate Body report and the panel
report, as modified by the Appellate Body report, on September 22, 2017.
United States
—
Anti-Dumping
Measures on Certain Oil Country Tubular Goods from Korea (DS488)
On December 22, 2014, South Korea requested consultations
with the United States regarding certain antidumping duty measures on oil
country tubular goods (OCTG) from South Korea and the investigation methodology
underlying such measures. South Korea claimed that the calculation by USDOC of
the constructed value profit rate for South Korean respondents was inconsistent
with U.S. obligations under Articles 2.2, 2.2.2, 2.2.1.1, 2.3, 2.4, 6.2, 6.4,
6.9, 6.10, including Articles 6.10.1 and 6.10.2, and 12.2.2 of the Antidumping
Agreement and Articles I and X:3 of the GATT 1994.
On February 23, 2015, South Korea requested the
establishment of a panel, and a panel was established on March 25, 2015. On
July 13, 2015, the parties agreed on the composition of the panel. On January
16, 2016, the chair of the panel informed the DSB that the beginning of the
panel’s work had been delayed due to a lack of available experienced lawyers in
the Secretariat, and that the panel expected to issue its final report to the
parties before the end of 2016. On September 15, 2016, the parties agreed on a
new chair following the resignation of the chair of the panel. On December 19,
2016, the chair of the panel informed the DSB that following the additional
delay due to the need to appoint a new chair and the complexity of the issues
raised by the parties in the dispute, the panel expected to issue its final
report to the parties by June 2017.
On November 14, 2017, the panel report was circulated to
members. The panel found that the United States had acted inconsistently in
four respects: (1) with the chapeau (introductory paragraph) of Article 2.2.2
of the Antidumping Agreement, because USDOC did not determine profit for
constructed value based on actual data pertaining to sales of the like product
in the home market; (2) with Articles 2.2.2(i) and (iii), because USDOC relied
on a narrow definition of the “same general category of products” in concluding
it could not determine profit under Article 2.2.2(i) and in concluding it could
not calculate a profit cap under Article 2.2.2(iii); (3) with Article 2.2.2,
because USDOC did not determine profit for constructed value based on actual
data pertaining to sales of the like product in third-country markets and with
respect to Articles 1 and 9.3 as a consequence of substantive violations of
Articles 2.2.2, 2.2.2(i), and 2.2.2(iii).
Finally, the panel found two of South Korea’s claims with
respect to profit for constructed value to be outside its terms of reference.
In the first instance, this finding applied to South Korea’s claim that the United
States had violated Article 2.2.2(iii) because USDOC had determined the profit
rate based on a certain company’s financial statements. In the second instance,
the finding applied to South Korea’s claim that the United States had violated
Article X.3(a) of the GATT 1994, because USDOC had purportedly acted contrary
to its agency practice of determining profit. The panel rejected the remaining
claims asserted by South Korea, including claims about the use of constructed
export price and the selection of costs for calculation of constructed normal
value.
On January 12, 2018, the DSB adopted the panel report in
this dispute.
United States
—
Anti-Dumping
and Countervailing Measures on Certain Coated Paper from Indonesia (DS491)
On March 13, 2015, Indonesia requested consultations with
the United States concerning the imposition of antidumping and countervailing
duty measures on certain coated paper products from Indonesia, as well as the
investigation underlying those measures. Indonesia claimed that the measures
are inconsistent with Articles 2.1, 2.1(c), 10, 12.7, 15.5, 15.7, and 15.8 of
the SCM Agreement; Articles 3.5, 3.7, and 3.8 of the Antidumping Agreement; and
Article VI of the GATT 1994. Indonesia requested establishment of a panel on
July 9, 2015, and the DSB established a panel on September 28, 2015. On
February 4, 2016, at the request of Indonesia, the Director-General composed
the panel.
With regard to the countervailing duty measures, Indonesia
challenged USDOC’s determinations that Indonesia’s provision of standing
timber, log export ban, and debt forgiveness program are countervailable
subsidies. Indonesia claimed that USDOC determined both that the standing
timber was provided for less than adequate remuneration and that the log export
ban distorted prices without factoring in prevailing market conditions.
Indonesia also alleged, with regard to all three subsidies, that USDOC failed
to examine whether there was a plan or scheme in place sufficient to constitute
a “subsidy programme” within the meaning of the SCM Agreement. Indonesia
further claimed that USDOC did not identify whether each subsidy was “specific
to an enterprise . . . within the jurisdiction of the granting authority,” as
required by the SCM Agreement. In addition, Indonesia challenged USDOC’s “facts
available” determination, in which it concluded that the government of
Indonesia forgave debt.
With regard to both the antidumping and countervailing duty
measures, Indonesia alleged that the USITC threat of injury determination breached
both the Antidumping Agreement and SCM Agreement because it relied on
allegation, conjecture, and remote possibility; was not based on a change in
circumstances that was clearly foreseen and imminent; and showed no causal
relationship between the subject imports and the threat of injury to the
domestic industry.
Indonesia also raised an “as such” claim with respect to 19
U.S.C. § 11677(11)(B) (affirmative determination by divided U.S. International
Trade Commission). Indonesia contended that, with respect to threat of injury
cases, the law does not consider or exercise “special care” because of the
requirement that a tie vote be treated as an affirmative Commission
determination.
On December 6, 2017, the panel report was circulated to
members. The report rejected all of Indonesia’s claims. Indonesia chose not to
appeal, and the DSB adopted the report on January 12, 2018.
U.S. Concerns with WTO
Dispute Settlement
In recent years, the United States has expressed a number of
concerns about how the WTO dispute settlement system functions, including the
concern that a number of WTO dispute settlement reports have not followed WTO
rules. The most recent expression of these concerns is reflected in the
President’s
2018 Trade Policy Agenda and
2017 Annual Report
issued in March 2018 (2018 report).
The 2018 report states that the most
significant area of concern has been panels and the Appellate Body adding to or
diminishing rights and obligations under the WTO Agreement by not applying the
WTO Agreement as written. The 2018 report noted that the earlier Bush and Obama
Administrations had detailed numerous examples and concerns and had proposed
formal guidance in 2005 for WTO members to adopt, but that these efforts have
not yielded significant results.
Concerns cited included Appellate Body interpretations that
would significantly restrict the ability of WTO members to counteract
trade-distorting subsidies provided through state-owned enterprises; concerns
with the Appellate Body’s interpretation of the non-discrimination obligation
under the Agreement on Technical Barriers to Trade, which calls for reviewing
factors unrelated to any difference in treatment due to national origin;
disagreement with panel and Appellate Body reports which resulted in an interpretation
under which WTO rules do not treat different (worldwide vs. territorial) tax
systems fairly; concerns that the Appellate Body’s non-text-based
interpretation of Article XIX of the GATT 1994 and the Safeguards Agreement
has seriously undermined the ability of
members to use safeguards measures; and concerns that the Appellate Body in
effect created a new category of prohibited subsidies that was neither
negotiated nor agreed to by WTO members.
The 2018 report also cited a number of additional concerns:
(1)
Concern about the Appellate Body’s decision, at
least since 2011, to ignore the mandatory 90-day deadline for deciding appeals
set out in WTO rules and instead assume the authority to take whatever time it
considers appropriate for individual appeals. The 2018 report cited among other
things the Appellate Body’s approach in appeals in compliance proceedings in
2017 involving the United States and European Union concerning large civil
aircraft.
(2)
Concern about service on the Appellate Body by
persons who are no longer Appellate Body members. The 2018 report cited
concerns expressed by the United States in August 2017 about decisions of the
Appellate Body to “authorize” a person who is no longer a member of the
Appellate Body to continue hearing appeals, and stated that the Appellate Body
does not have the authority to deem someone a member who is not a member. Since
the summer of 2017, U.S. officials have had the view at WTO Dispute Settlement Body
meetings that this issue must be resolved before the United States will
consider supporting new appointments to the Appellate Body.
[374]
(3)
Concern about the tendency of WTO reports to
make findings unnecessary to resolve a dispute or on issues not presented in
the dispute. Citing Articles 3.4, 3.7, 7.1, and 11 of the DSU, the 2018 report
said that WTO panels and the Appellate Body are not to make findings that
cannot “assist the DSB in making [its] recommendations.” It noted that the
purpose of the dispute settlement system is not to produce reports or to “make
law,” but rather to help members resolve trade disputes among them.
(4)
Concern about the Appellate Body’s approach to
reviewing facts, and concern about
de
novo
review of a member’s domestic
law.
The 2018 report noted that Article
17.6 of the DSU limits an appeal to “issues of law covered in the panel report
and legal interpretations developed by the panel.” The 2018 report expressed
concern that the Appellate Body has consistently reviewed panel fact-finding
under different legal standards, and has reached conclusions that are not based
on panel factual findings or undisputed facts. The report also expressed
concern about the Appellate Body’s review of the meaning of a member’s domestic
law that is being challenged. The report said that the key fact to be proven is
what a member’s challenged measure does or means, and the law to be interpreted
and applied are the provisions of the WTO agreements.
The report expressed concern that the
Appellate Body asserts it can review the meaning of a member’s domestic measure
as a matter of law rather than acknowledging that it is a matter of fact and
thus not a subject for Appellate Body review. The report also expressed concern
that when the Appellate Body reviews the meaning of a member’s domestic
measure, it does not provide any deference to a panel’s findings of fact.
(5)
Concern that the Appellate Body claims its
reports are entitled to be treated as precedent.
The 2018 report states that this is not
consistent with WTO rules, and that WTO members established one and only one
means for adopting binding interpretations of the obligations agreed to:
Article IX:2 of the Agreement Establishing
the World Trade Organization.
Top of the page
This chapter summarizes trade-related activities during 2017
in two major multilateral organizations—the Organisation for Economic
Co-operation and Development (OECD) and the Asia-Pacific Economic Cooperation
(APEC) forum. It also covers the status of negotiations for a Trade in Services
Agreement (TiSA) and activities conducted under trade and investment framework
agreements (TIFAs).
The OECD provides a forum for member governments to review
and discuss economic, social, and other policy experiences affecting their
market economies, as well as engage with other major nonmember economies to
address issues facing the global economy. In 2017, there were 35 OECD members.
The OECD held its Ministerial Council Meeting on June 7–8,
2017, in Paris, France. The meeting focused on how the benefits arising from
globalization might be shared more broadly.
Regarding trade and investment in particular, the chair of the meeting found
that OECD members appeared to agree on a number of points, including (1) the
need to dismantle trade barriers without reducing international standards, as
done by the World Trade Organization (WTO) Trade Facilitation Agreement; (2)
the need to address overcapacity in various industrial sectors—including steel,
aluminum, and shipbuilding—through such measures as the recent establishment of
the Global Forum on Steel Excess Capacity; and (3) the need for continued OECD
work on an array of trade topics, such as export credit rules.
At the 2016 G20 Summit in Hangzhou, China, ministers
established a Global Forum on Steel Excess Capacity comprising 33 countries.
The forum set the following aims at the summit: (1) exchange information and
data on excess capacity in the steel industry between governments of
steel-producing countries; (2) develop ways to strengthen the functioning of
the world steel market; and, (3) with the OECD acting as facilitator in this
three-year process, present a report on its work to G20 ministers in 2017. The
forum held its first ministerial meeting under the German G20 Presidency on
November 30, 2017, in Berlin, Germany. Its principal goals were to review the
exchange of information underway, receive the initial report published in
November 2017, and hear a progress report on the Forum’s upcoming work in 2018.
The OECD Trade Committee met twice during 2017: April 26,
for its 170th session, and November 29–30, for its 171st. The Trade Committee
continued work on two broad themes: (1) trade and the digital economy and (2) trade
and investment.
Working Party of the Trade Committee
The Working Party of the Trade Committee met four times in
2017: March 16–17, June 15–16, October 10, and December 14–15.
During 2017, the Working Party focused on the following topics: global value
chains and trade in value added; trade in services, especially the OECD’s
Services Trade Restrictiveness Index; digital trade; data localization and
local-content policies; state-owned enterprises and small and medium-sized
enterprises; best practices in government procurement; and international
regulatory cooperation.
Other topics considered during the year included measuring nontariff measures;
technology transfer issues; trade and investment; and trade facilitation
matters reflecting the updated OECD Trade Facilitation Indicators.
Established in 1989 and composed of 21 member economies,
the Asia-Pacific Economic Cooperation (APEC) is a regional economic forum.
Since its inception, APEC has aimed to increase prosperity in the region by
supporting regional economic integration; promoting balanced, innovative,
inclusive, and sustainable growth; and facilitating easy movement of goods, services,
investment, and people across borders. Throughout the year, APEC organizes
events, including an economic leaders’ summit, senior official meetings, policy
dialogues, and workshops, to discuss various trade- and investment-related
issues. APEC decisions are made by consensus, and commitments are undertaken
voluntarily. Every year, one of the 21 APEC member economies plays the host to
APEC’s meetings and serves as the APEC chair.
APEC’s operational structure is based on both “bottom-up”
and “top-down” approaches. Four core committees, including the Committee on
Trade and Investment (CTI), provide strategic policy recommendations to APEC
economic leaders and ministers who meet annually to set the vision of
overarching goals and initiatives. The working groups under each committee are
then tasked with carrying out these initiatives through a variety of
APEC-funded projects. Member economies also take individual and collective
actions to carry out APEC initiatives. Capacity building is a key element of APEC’s
operation, playing an important role in helping reach APEC’s goals by providing
skill training and technological know-how to member economies.
In 2017, Vietnam served as the APEC chair and hosted major
APEC meetings. Under its leadership, APEC highlighted the theme of “Creating
New Dynamism, Fostering a Shared Future,” and sought to pursue the following
four priorities:
promoting sustainable, innovative
and inclusive growth; deepening regional economic integration; strengthening
micro, small, and medium enterprises’ (MSMEs) competitiveness and innovation in
the digital age; and enhancing food security and sustainable agriculture in
response to climate change.
In 2017, APEC organized various events, carrying out
discussions and/or training on a wide range of topics, including labor
mobility; women’s economic, financial, and social inclusion; anticorruption and
transparency issues; competition policy and laws; sustainable tourism; food
safety and security; energy efficiency and storage; and agricultural
technology, among others.
In its 2017 annual report to ministers, CTI noted the
accomplishments made throughout the year. Among the highlights are:
(1) Progress made in advancing global value chain (GVC)
development and cooperation. These advancements included a proposal to
establish a
APEC Global Value Chain Partnership Platform
; the release
of APEC’s
Global Value Chains Investment Climate Improvement Report
;
the implementation of targeted capacity-building projects to improve supply
chain performance on prearrival processing, expedited shipments, electronic
payment, and more; and progress made towards developing statistical measurement
of trade in value added (TiVA) in the APEC region by 2018.
(2) Progress made in promoting MSMEs’ participation in the
global economy. This included projects for facilitating MSMEs’ integration into
GVCs in services industries, such as fashion design and logistics; a workshop
organized to discuss best practices for integrating small and medium-sized
suppliers into the automotive GVCs; an initiative on promoting MSMEs’ global
reach through electronic commerce (e-commerce); and projects facilitating
MSMEs’ use of intellectual property rights.
(3) Progress made in reducing applied tariffs to 5 percent or
less on the APEC list of environmental goods, as well as in implementing the
Environmental
Services Action Plan
. The latter effort included a workshop on
environmental services and a set of case studies on environmental damage
remediation services, renewable energy services, and energy efficiency
services.
(4) Efforts made in advancing work related to the
realization of the Free Trade Area of the Asia Pacific (FTAAP) through
“capacity building initiatives and information sharing mechanism.”
These efforts included a workshop on free trade agreement (FTA) negotiation
skills; a policy dialogue on regional trade agreements (RTAs) and FTAs; and a
report,
Trends and Developments in Provisions and Outcomes of RTAs/FTAs
Implemented in 2016 by APEC Economies
.
Digital Trade, Internet Economy, and E-Commerce
Recognizing the growing amount of trade conducted
electronically and the transformative effect of e-commerce on industries, APEC
listed digital trade, the internet economy, and e-commerce as important trade
and investment topics to address. In recent years, a number of working groups
and initiatives have been established to promote the development and use of
digital technology for economic growth in the APEC region. Examples include
Initiative of Cooperation to Promote Internet Economy
(2014),
the Ad Hoc Steering Group on the Internet Economy (2015),
and the
Work Plan for Advancing “Facilitating Digital Trade for Inclusive
Growth”
(2015).
In 2017, there were various developments in this area. In
April 2017, the Policy Support Unit (PSU) of APEC completed a study and
released a report,
Facilitating Digital Trade for Inclusive Growth: Key
Issues in Promoting Digital trade in APEC
. The report discussed
opportunities as well as challenges that digital trade presents, and
highlighted emerging technical and policy issues that need to be better
understood for balanced regulation of the industry. The report identified the
factors enabling the growth of the digital economy, including those affecting
infrastructure (e.g., internet speed and cost), the supply of internet services
(e.g., the availability of skilled labor such as engineers and scientists, and
intellectual property rights protection), and the demand for internet services
(e.g., internet access and online payment).
In November 2017, PSU released another report,
Promoting
E-Commerce to Globalize MSMEs
. Through case studies of Taiwan, China,
Brunei Darussalam, and Malaysia, the report identified constraints faced by
MSMEs in attempting to participate in e-commerce and digital trade. Constraints
addressed included information communication technology infrastructure,
logistics cost, payment services, and postal services, among others.
A trade policy dialogue on facilitating digital trade was
held on May 12, 2017. At the dialogue, the participants discussed barriers to
digital trade, and identified issues and areas where further work should be
conducted. Based on the discussion, CTI agreed on
The Work Plan to Identify
Building Blocks to Facilitate Digital Trade for 2018
. In addition, in
2017, senior officials also approved a number of new initiatives, including
The APEC Internet and Digital Economy Roadmap
and the
APEC Framework
on Cross-border E-commerce Facilitation
.
In 2013, a group of 20 WTO members launched negotiations on
a plurilateral Trade in Services Agreement (TiSA) that might form the basis for
a broader multilateral agreement.
Four rounds of negotiations were held in 2013, five rounds in 2014, five rounds
in 2015, and seven rounds in 2016.
Negotiations intensified in 2016, focusing on market access and proposals for
additional disciplines under the annexes.
However, no negotiating rounds were held in 2017.
As of the last negotiating round in December 2016, there were 23 participants,
including Australia, Canada, Chile, Colombia, Costa Rica, the European Union,
Hong Kong, Iceland, Israel, Japan, South Korea, Liechtenstein, Mauritius,
Mexico, New Zealand, Norway, Pakistan, Panama, Peru, Switzerland, Taiwan, Turkey,
and the United States.
Trade and Investment Framework Agreements (TIFAs) provide
principles for dialogue on trade and investment issues. By yearend 2017, the
United States had entered into 57 TIFAs, including one new TIFA with Paraguay
(table 4.1). These agreements cover diverse matters, including market access,
labor, environment, and intellectual property rights.
TIFA meetings serve as a setting for the United States and other parties to the
TIFA to discuss issues of mutual interest with the objective of strengthening
trade and investment ties, and promoting free, fair, and reciprocal trade.
As part of the Trump administration’s stated goal of expanding trade with
countries in the Indo-Pacific region, several of the meetings were held between
the United States and Asia-Pacific trading partners.
Table
4.1
U.S. trade and investment framework agreements
in 2017
|
Type and name
|
Date signed
|
|
Bilateral
|
|
|
U.S.-Afghanistan
TIFA
|
September
21, 2004
|
|
U.S.-Algeria TIFA
|
July 13, 2001
|
|
U.S.-Angola
TIFA
|
May 19,
2009
|
|
U.S.-Argentina TIFA
|
March 23, 2016
|
|
U.S.-Armenia
TIFA
|
November
13, 2015
|
|
U.S.-Bahrain TIFA
|
June 18, 2002
|
|
U.S.-Bangladesh
TICFA
|
November
25, 2013
|
|
U.S.-Brunei-Darussalam TIFA
|
December 16, 2002
|
|
U.S.-Burma
TIFA
|
May 21,
2013
|
|
U.S.-Cambodia TIFA
|
July 14, 2006
|
|
U.S.-Egypt
TIFA
|
July 1,
1999
|
|
U.S.-Georgia TIFA
|
June 20, 2007
|
|
U.S.-Ghana
TIFA
|
February
26, 1999
|
|
U.S.-Iceland TICF
|
January 15, 2009
|
|
U.S.-Indonesia
TIFA
|
July
16, 1996
|
|
U.S.-Iraq TIFA
|
July 11, 2005
|
|
U.S.-Kuwait
TIFA
|
February
6, 2004
|
|
U.S.-Laos TIFA
|
February 17, 2016
|
|
U.S.-Lebanon
TIFA
|
November
30, 2006
|
|
U.S.-Liberia TIFA
|
February 15, 2007
|
|
U.S.-Libya
TIFA
|
December
18, 2013
|
|
U.S.-Malaysia TIFA
|
May 10, 2004
|
|
U.S.-Maldives
TIFA
|
October
17, 2009
|
|
U.S.-Mauritius TIFA
|
September 18, 2006
|
|
U.S.-Mongolia
TIFA
|
July
15, 2004
|
|
U.S.-Mozambique TIFA
|
June 21, 2005
|
|
U.S.-Nepal
TIFA
|
April
15, 2011
|
|
U.S.-New Zealand TIFA
|
October 2, 1992
|
|
U.S.-Nigeria
TIFA
|
February
16, 2000
|
|
U.S.-Oman TIFA
|
July 7, 2004
|
|
U.S.-Pakistan
TIFA
|
June
25, 2003
|
|
U.S.-Paraguay TIFA
|
January 13, 2017
|
|
U.S.-Philippines
TIFA
|
November
9, 1989
|
|
U.S.-Qatar TIFA
|
March 19, 2004
|
|
U.S.-Rwanda
TIFA
|
June 7,
2006
|
|
U.S.-Saudi Arabia TIFA
|
July 31, 2003
|
|
U.S.-South
Africa TIFA
|
June
18, 2012a
|
|
U.S.-Sri Lanka TIFA
|
July 25, 2002
|
|
U.S.-Switzerland
TICF
|
May 25,
2006
|
|
U.S.-Taiwan TIFA
|
September 19, 1994
|
|
U.S.-Thailand
TIFA
|
October
23, 2002
|
|
U.S.-Tunisia TIFA
|
October 2, 2002
|
|
U.S.-Turkey
TIFA
|
September
29, 1999
|
|
U.S.-Ukraine TICA
|
March 28, 2008
|
|
U.S.-United
Arab Emirates TIFA
|
March
15, 2004
|
|
U.S.-Uruguay TIFA
|
January 25, 2007
|
|
U.S.-Vietnam
TIFA
|
June
21, 2007
|
|
U.S.-Yemen TIFA
|
February 6, 2004
|
|
Regional
|
|
|
U.S.-Association
of Southeast Asian Nations (ASEAN) TIFA
|
August
5, 2006
|
|
U.S.-Caribbean Community (CARICOM) TIFA
|
May 28, 2013
|
|
U.S.-Central
Asian TIFA
|
June 1,
2004
|
|
U.S.-Common Market for Eastern and Southern Africa
(COMESA) TIFA
|
October 29, 2001
|
|
U.S.-East
African Community TIFA
|
July
16, 2008
|
|
U.S.-Economic Community of West African States
(ECOWAS) TIFA
|
August 5, 2014
|
|
U.S.-Gulf
Cooperation Council (GCC) Framework Agreement for Trade, Economic,
Investment, and Technical Cooperation
|
September
25, 2012
|
|
U.S.-Southern Africa Customs Union (SACU) Trade,
Investment, and Development Cooperative Agreement
|
July 16, 2008
|
|
U.S.-West
African Economic and Monetary Union (WAEMU) TIFA
|
April
24, 2002
|
Source: USTR, “
Trade
and Investment Framework Agreements
,” n.d. (accessed March 22,
2018); USTR, “
United
States, Bangladesh Sign Trade and Investment Cooperation Forum Agreement
,”
November 25, 2013; USTR
,
2018 Trade Policy Agenda and 2017 Annual Report
,
March 2017, 357; USTR, “
SACU
,”
(accessed March 22, 2018).
Note: TICF stands for Trade and Investment Cooperation
Forum, TICA stands for Trade and Investment Cooperation Agreement, and TICFA
stands for Trade and Investment Cooperation Forum Agreement. All are considered
TIFAs by USTR. For more information, see USTR, “
Trade
and Investment Framework Agreements
” (accessed March 22, 2018).
The
United States-South Africa TIFA was amended on June 18, 2012, and replaces the
original TIFA, signed on February 18, 1999.
On
October 2, 2008, the United States and Uruguay signed a TIFA protocol on trade
and environment and a TIFA protocol on trade facilitation.
The 10
countries of ASEAN are Brunei Darussalam (Brunei), Burma, Cambodia, Indonesia,
Laos, Malaysia, the Philippines, Singapore, Thailand, and Vietnam.
The 15
members of CARICOM are Antigua and Barbuda, The Bahamas, Barbados, Belize,
Dominica, Grenada, Guyana, Haiti, Jamaica, Montserrat, St. Lucia, St. Kitts and
Nevis, St. Vincent and the Grenadines, Suriname, and Trinidad and Tobago. It
also has 5 associate members: Anguilla, Bermuda, the British Virgin Islands,
the Cayman Islands, and the Turks and Caicos Islands.
The 6
parties to the U.S.-Central Asian TIFA are the United States, Kazakhstan,
Kyrgyzstan, Tajikistan, Turkmenistan, and Uzbekistan.
The 19
members of COMESA are Burundi, Comoros, the Democratic Republic of the Congo,
Djibouti, Egypt, Eritrea, Ethiopia, Kenya, Libya, Madagascar, Malawi,
Mauritius, Rwanda, Seychelles, Sudan, Swaziland, Uganda, Zambia, and Zimbabwe.
The 6
parties to the U.S.-East African Community TIFA are the United States, Burundi,
Kenya, Rwanda, Tanzania, and Uganda.
The 15 members of ECOWAS are Benin, Burkina Faso, Cabo
Verde, Côte d’Ivoire, The Gambia, Ghana, Guinea, Guinea-Bissau, Liberia, Mali,
Niger, Nigeria, Senegal, Sierra Leone, and Togo.
The 6 parties to the U.S.-Gulf Cooperation Council
(GCC) Framework Agreement for Trade, Economic, Investment, and Technical
Cooperation are Bahrain, Kuwait, Oman, Qatar, Saudi Arabia, and the United Arab
Emirates.
The 5 members of SACU are Botswana, Lesotho, Namibia,
South Africa, and Swaziland.
The 8 members of WAEMU are Benin, Burkina Faso, Côte
d’Ivoire, Guinea-Bissau, Mali, Niger, Senegal, and Togo.
On January 13, 2017, the United States Trade Representative
(USTR) and the Paraguayan Ambassador to the United States met in Washington,
DC, to sign a TIFA. The TIFA creates a forum for the countries to engage on a
diverse set of bilateral economic issues, including market access and
intellectual property rights protection.
During 2017, the following TIFA councils met:
Afghanistan
The United States and Afghanistan met under their TIFA on
March 27–28, 2017, in Kabul, Afghanistan. Several issues were discussed,
including the importance of women in increasing trade and economic growth,
workers’ rights, ease of doing business, and the importance of nurturing a
governing regime that will foster private sector growth. In addition, the
countries discussed potential vehicles for increasing Afghanistan’s external
trade and investment, including Afghanistan’s accession to the WTO, full
implementation of the Afghanistan-Pakistan Transit Trade Agreement, and full
implementation of the Transports Internationaux Routiers Convention (International
Road Transport Convention) of the International Road Union.
Algeria
On April 24, 2017, the United States and Algeria met in
Algiers under their TIFA. Topics discussed included ease of doing business,
market access, and investments in agriculture and pharmaceuticals.
Bangladesh
Under their TICFA, the United States and Bangladesh met in
Dhaka on May 17, 2017. The countries used the meeting as a forum to discuss
Bangladeshi efforts to improve labor conditions.
Additional topics addressed included market access, intellectual property, the
digital economy, and ease of doing business.
Burma (Myanmar)
On July 13, 2017, government officials from the United
States and Burma met to discuss the plan for moving forward under their TIFA,
signed in 2013. The meeting, which was held in Rangoon (Yangon), included
discussions related to intellectual property rights and enforcement, labor
standards, and agriculture.
Cambodia
On August 8, 2017, U.S. and Cambodian senior government
officials met under their TIFA. The countries agreed to work cooperatively to
address outstanding bilateral trade issues, especially those related to labor,
intellectual property protection, and financial services. During the meeting,
U.S. officials shared the Trump Administration’s trade priorities, including
improving enforcement of trade laws, lowering the trade deficit, and opening
new markets.
Central Asia
On December 13, 2017, senior government officials met in
Almaty, Kazakhstan, for the U.S.-Central Asia TIFA Council meeting. Topics
covered included the trade, transit, and investment environment; facilitating
regional private sector activity by expanding fair and reciprocal trade and
creating a welcoming business environment; and Central Asian exports under the
U.S. Generalized System of Preferences.
In 2017, U.S. and foreign officials agreed to form a new working group on
intellectual property rights.
The Afghan government participated in the council meeting as observers, and
proposed becoming a full member of the TIFA.
Egypt
On December 5, 2017, the United States and Egypt held a
Trade and Investment Council meeting in Cairo under their TIFA. During the
meeting, both countries renewed their commitment to work cooperatively towards
improving bilateral trade, especially in the areas of market access, labor
regulations, and intellectual property protection and enforcement.
Indonesia
The United States and Indonesia met under their TIFA on June
12–13, 2017. During the TIFA meetings in Washington, DC, and in subsequent
informal meetings in both Jakarta and Washington, the countries proposed to
resolve outstanding bilateral issues, including U.S. intellectual property
rights concerns and agricultural import barriers.
As Indonesia is listed on USTR’s Special 301 Priority Watch List, the countries
discussed a work plan for addressing U.S. concerns regarding intellectual
property protection and enforcement.
The two sides also focused on making progress on agriculture, high-technology
products, digital services, and financial services, and addressed several
market access restrictions, including agricultural import barriers, import
licensing restrictions, and localization requirements.
Laos
On March 23, 2017, the United States and Laos held the
inaugural meeting under their TIFA. In addition to affirming their interest in
expanding bilateral trade, the countries discussed the importance of addressing
vital issues in a timely manner. These key topics included digital trade;
agricultural, sanitary, and phytosanitary standards; intellectual property; and
illegal logging and wildlife tracking.
The United States also encouraged labor-related reforms.
Malaysia
Under their TIFA, the United States and Malaysia met on July
17, 2017, with the goals of further strengthening trade relations and promoting
fair and balanced trade. During the course of their meetings, the countries
established working groups related to the environment, financial services,
goods trade, labor, and intellectual property.
Nepal
On April 20, 2017, the United States and Nepal held their
third TIFA Council meeting in Kathmandu. Technical discussions addressed
customs and trade facilitation, sanitary and phytosanitary measures, food
safety, labeling requirements, standards and conformity assessment, and labor.
The two sides also discussed the Nepal Trade Preference Act (NTPA), which
entered into force on December 30, 2016, following the 2015 earthquakes in
Nepal.
Under the NTPA, the United States grants duty-free treatment to imports from
Nepal for products covered by 77 HTS tariff lines. During the TIFA Council
meeting, the government of Nepal requested that additional products be added to
the duty-free trade preference program. Both countries affirmed the importance
of full implementation of the NTPA.
Pakistan
Under their TIFA, the United States and Pakistan held an
intersessional meeting in June. The United States used the forum to promote
market access for several U.S. agricultural products, including beef,
distiller’s dried grains, soybeans, pulses, and chickpeas. In addition, the
U.S. side discussed the importance of intellectual property rights protection
and enforcement and tax predictability for U.S. businesses.
Philippines
The United States and the Philippines met under their TIFA
twice in 2017: on July 11 in Manila, and on November 29 in Washington, DC.
The countries discussed bilateral trade issues including intellectual property
protection, customs, agriculture, labor, and investment. In addition, the
countries agreed to work cooperatively to advance the U.S.-Association of
Southeast Asian Nations (ASEAN) trade and investment agenda.
Thailand
Under their TIFA, the United States and Thailand met twice
in 2017: on April 3 and June 12–13. The countries met with the goals of
expanding market access and working together to address trade barriers. During
the meetings, U.S. officials discussed both the importance of labor laws’
compliance with internationally recognized workers’ rights standards and the
importance of enhancing trade with countries in the Asia-Pacific region via
bilateral trade initiatives focused on promoting economic growth and
competitiveness.
In December 2017, in response to the country’s improved intellectual property
protections and enforcement, Thailand was moved from the Special 301 Priority
Watch List to the Watch List.
Tunisia
On April 21, 2017, government officials from the United
States and Tunisia met in Tunis under their TIFA. Their meeting was the seventh
since the TIFA was signed in 2002. The countries discussed recent bilateral
strides made in support of U.S. and Tunisian agricultural industries. In
addition, the United States discussed the Tunisian government’s marked progress
on its economic reform program, stressing that the country’s new laws on
investment, the banking sector, and bankruptcy will increase Tunisia’s
attractiveness as a trading partner for U.S. firms.
Turkey
The United States and Turkey met in Ankara on September
12–13 for their 10th TIFA meeting.
Topics discussed included agricultural and industrial goods trade, intellectual
property rights and enforcement, the digital economy, government procurement,
and export credit cooperation. In addition, the countries agreed to work
towards improving the private sector business climate between them. To
accomplish this, the governments plan to increase dialogue on subjects such as
trade facilitation, export financing, innovation, advanced manufacturing, and startups.
Ukraine
The United States and Ukraine met on October 3, 2017, under
their Trade and Investment Cooperation Agreement (TICA). The meeting, held in
Kyiv under the auspices of the U.S.-Ukraine Trade and Investment Council, was
the seventh meeting since the TICA entered into force in 2008. During the
meeting, the Ukraine government described its efforts to diversify its exports
and improve intellectual property rights protection and enforcement. The United
States acknowledged Ukraine’s efforts to reform its tax and customs
authorities, and urged Ukraine to continue reforms aimed at increasing the ease
of doing business in the country.
Vietnam
On March 27–28, 2017, government officials from the United
States and Vietnam met under their TIFA, the first such meetings since 2011.
During the talks, the countries discussed bilateral issues related to several
topics, and agreed to create working groups on agriculture and food safety,
industrial goods, intellectual property, and digital trade. They also discussed
issues related to motor vehicles, electronic payments, and labor reforms.
In addition, officials discussed how they could work cooperatively to build
U.S.-ASEAN ties.
On May 30, 2017, senior officials met under the TIFA again, this time in
Washington, DC. Topics included agricultural imports, including U.S. import
restrictions on catfish from Vietnam, and digital trade, including electronic
payment services and Vietnamese advertising on U.S. social websites.
Top of the page
This chapter summarizes developments related to U.S. free
trade agreements (FTAs) during 2017.
It describes trends in U.S. merchandise trade with FTA partners, features
highlights of the status of U.S. FTA negotiations during the year, and
summarizes major activities and dispute settlement developments involving the
North American Free Trade Agreement (NAFTA) and other U.S. FTAs in force during
2017.
The United States was party to 14 FTAs involving a total of
20 countries as of December 31, 2017. Starting with the most recent, the FTAs
in force during 2017 were the U.S.-Panama Trade Promotion Agreement (TPA)
(entered into force in 2012); the U.S.-Colombia TPA (2012); the U.S.-Korea FTA
(2012); the U.S.-Oman FTA (2009); the U.S.-Peru TPA (2009); a multiparty FTA
with the countries of Central America and the Dominican Republic (CAFTA-DR)
that includes the Dominican Republic, El Salvador, Guatemala, Honduras, and Nicaragua
(entered into force 2006–07) and Costa Rica (2009); the U.S.-Bahrain FTA
(2006); the U.S.-Morocco FTA (2006); the U.S.-Australia FTA (2005); the
U.S.-Chile FTA (2004); the U.S.-Singapore FTA (2004); the U.S.-Jordan FTA
(2001); NAFTA, with Canada and Mexico (1994); and the U.S.-Israel FTA (1985).
Total two-way merchandise trade between the United States
and its 20 FTA partners was $1.5 trillion in 2017, which accounted for 39.0
percent of total U.S. merchandise trade with the world. The value of U.S.
exports to FTA partners totaled $720.5 billion, a 6.6 percent increase from
$675.8 billion in 2016; this growth mirrored the 6.6 percent increase in total
U.S. exports to the world in 2017. The value of U.S. exports to most FTA
partners increased in 2017; the exception was exports to Israel. U.S. imports
from FTA partners were valued at $797.0 billion, a 6.5 percent increase from
$748.3 billion in 2016. The U.S. merchandise trade deficit with all FTA
partners increased 5.6 percent to $76.6 billion in 2017 (tables 5.1–5.3).
U.S. trade with the two NAFTA countries (Canada and Mexico)
continued to contribute the most to overall U.S. trade with FTA partners. In
2017, these countries accounted for $1.1 trillion, or 75.1 percent, of total
U.S. trade with its FTA partners. From 2016 to 2017, the value of U.S. exports
to NAFTA countries rose 5.8 percent ($29.0 billion) to $525.5 billion. U.S.
imports from NAFTA countries rose 7.4 percent ($42.2 billion), to $614.0 billion
in 2017. As a result, the U.S. merchandise trade deficit with its NAFTA
partners increased by 17.6 percent to $88.6 billion in 2017.
U.S. trade with its non-NAFTA FTA partners was valued at
$378.0 billion in 2017, which was a 3.7 percent increase from 2016. U.S.
exports to these FTA partners increased 8.8 percent ($15.7 billion), from
$179.3 billion in 2016 to $195.0 billion in 2017. At the same time, U.S.
imports from these partners increased 3.7 percent ($6.5 billion) from $176.5
billion in 2016 to $183.0 billion.
U.S. exports increased more than imports, causing the U.S. merchandise trade
surplus with its non-NAFTA FTA partners to increase 333.9 percent to $12.0
billion (tables 5.1–5.3).
Table 5.1
Total U.S. exports to FTA partners, by FTA
partner, 2015–17
|
FTA partner
|
2015
|
2016
|
2017
|
2016–17
|
|
|
|
Million $
|
|
% change
|
|
NAFTA
|
517,059
|
496,499
|
525,460
|
5.8
|
|
Canada
|
280,855
|
266,797
|
282,472
|
5.9
|
|
Mexico
|
236,204
|
229,702
|
242,989
|
5.8
|
|
Non-NAFTA
|
194,005
|
179,266
|
194,990
|
8.8
|
|
Israel
|
13,539
|
13,197
|
12,544
|
-4.9
|
|
Jordan
|
1,360
|
1,459
|
1,963
|
34.5
|
|
Chile
|
15,449
|
12,922
|
13,608
|
5.3
|
|
Singapore
|
28,474
|
26,725
|
29,753
|
11.3
|
|
Australia
|
25,034
|
22,160
|
24,601
|
11.0
|
|
Morocco
|
1,625
|
1,933
|
2,116
|
9.5
|
|
Bahrain
|
1,271
|
899
|
907
|
0.9
|
|
CAFTA-DR
|
28,713
|
28,709
|
30,719
|
7.0
|
|
Oman
|
2,355
|
1,804
|
2,096
|
16.2
|
|
Peru
|
8,724
|
7,955
|
8,686
|
9.2
|
|
South Korea
|
43,484
|
42,309
|
48,277
|
14.1
|
|
Colombia
|
16,303
|
13,067
|
13,272
|
1.6
|
|
Panama
|
7,674
|
6,128
|
6,447
|
5.2
|
|
FTA
partner total
|
711,064
|
675,766
|
720,450
|
6.6
|
|
World total
|
1,503,101
|
1,451,011
|
1,546,733
|
6.6
|
|
FTA partner
share of world (percent)
|
47.3
|
46.6
|
46.6
|
|
Source:
USITC DataWeb/USDOC (accessed March 14, 2018).
Note:
Because of rounding, figures may not add to totals shown.
CAFTA-DR
is a multiparty FTA that includes the Dominican Republic, El Salvador, Guatemala,
Honduras, Nicaragua, and Costa Rica.
Table 5.2
Total U.S. imports from FTA partners, by
FTA partner, 2015–17
|
FTA partner
|
2015
|
2016
|
2017
|
2016–17
|
|
|
|
Million $
|
|
% change
|
|
NAFTA
|
592,632
|
571,812
|
614,020
|
7.4
|
|
Canada
|
296,230
|
277,756
|
299,975
|
8.0
|
|
Mexico
|
296,401
|
294,056
|
314,045
|
6.8
|
|
Non-NAFTA
|
181,763
|
176,507
|
183,016
|
3.7
|
|
Israel
|
24,478
|
22,203
|
21,947
|
-1.2
|
|
Jordan
|
1,492
|
1,555
|
1,688
|
8.5
|
|
Chile
|
8,772
|
8,797
|
10,552
|
19.9
|
|
Singapore
|
18,267
|
17,833
|
19,397
|
8.8
|
|
Australia
|
10,884
|
9,510
|
10,051
|
5.7
|
|
Morocco
|
1,012
|
1,021
|
1,230
|
20.4
|
|
Bahrain
|
902
|
768
|
996
|
29.7
|
|
CAFTA-DR
|
23,755
|
23,356
|
23,641
|
1.2
|
|
Oman
|
907
|
1,125
|
1,069
|
-5.0
|
|
Peru
|
5,053
|
6,252
|
7,283
|
16.5
|
|
South Korea
|
71,758
|
69,881
|
71,164
|
1.8
|
|
Colombia
|
14,075
|
13,794
|
13,556
|
-1.7
|
|
Panama
|
408
|
410
|
442
|
7.8
|
|
FTA
partner total
|
774,395
|
748,318
|
797,036
|
6.5
|
|
World total
|
2,248,183
|
2,187,805
|
2,342,905
|
7.1
|
|
FTA
partner share of world (percent)
|
34.4
|
34.2
|
34.0
|
|
Source:
USITC DataWeb/USDOC (accessed March 14, 2018).
Note:
Because of rounding, figures may not add to totals shown.
CAFTA-DR
is a multiparty FTA that includes the Dominican Republic, El Salvador,
Guatemala, Honduras, Nicaragua, and Costa Rica.
Table 5.3
U.S. merchandise trade balance with FTA
partners, by FTA partner, 2015–17
|
FTA partner
|
2015
|
2016
|
2017
|
2016–17
|
|
|
|
Million $
|
|
% change
a
|
|
NAFTA
|
-75,572
|
-75,312
|
-88,560
|
-17.6
|
|
Canada
|
-15,375
|
-10,958
|
-17,504
|
-59.7
|
|
Mexico
|
-60,197
|
-64,354
|
-71,057
|
-10.4
|
|
Non-NAFTA
|
12,242
|
2,760
|
11,974
|
333.9
|
|
Israel
|
-10,939
|
-9,007
|
-9,403
|
-4.4
|
|
Jordan
|
-132
|
-96
|
275
|
(
)
|
|
Chile
|
6,677
|
4,125
|
3,057
|
-25.9
|
|
Singapore
|
10,207
|
8,891
|
10,356
|
16.5
|
|
Australia
|
14,151
|
12,650
|
14,550
|
15.0
|
|
Morocco
|
613
|
911
|
887
|
-2.7
|
|
Bahrain
|
368
|
131
|
-89
|
(
)
|
|
CAFTA-DR
|
4,958
|
5,353
|
7,078
|
32.2
|
|
Oman
|
1,448
|
679
|
1,027
|
51.3
|
|
Peru
|
3,671
|
1,703
|
1,403
|
-17.6
|
|
South Korea
|
-28,273
|
-27,572
|
-22,887
|
17.0
|
|
Colombia
|
2,228
|
-726
|
-284
|
60.9
|
|
Panama
|
7,266
|
5,718
|
6,005
|
5.0
|
|
FTA
partner total
|
-63,330
|
-72,553
|
-76,586
|
-5.6
|
|
World
total
|
-745,082
|
-736,794
|
-796,172
|
-8.1
|
Source:
USITC DataWeb/USDOC (accessed March 14, 2018).
Note:
Because of rounding, figures may not add to totals shown.
Negative
percentage changes indicate an increase in the U.S. trade deficit or a decrease
in the U.S. trade surplus. Positive percentage changes indicate a decrease in
the trade deficit or an increase in the trade surplus.
Not
meaningful.
CAFTA-DR
is a multiparty FTA that includes the Dominican Republic, El Salvador,
Guatemala, Honduras, Nicaragua, and Costa Rica.
The value of U.S. imports entered under FTAs totaled $385.1
billion in 2017, which accounted for nearly half (48.3 percent) of total U.S.
imports from FTA partners and 16.5 percent of U.S. imports from the world
(tables 5.4–5.5).
The
value of U.S. imports entered under FTAs in 2017 increased $10.6 billion (2.8
percent), up from $374.4 billion in 2016. FTA imports from Chile grew 26.6
percent ($1.3 billion), which represented the largest percent increase. The
growth was primarily driven by large increases in imports of copper products.
Imports under FTAs from Peru and Bahrain increased 24.5 percent ($651 million)
and 16.5 percent ($82 million), respectively; however, they changed from
smaller baselines. Imports from Mexico accounted for the greatest increase in
value, rising by $11.9 billion (7.0 percent) to $182.8 billion. Combined
imports from the NAFTA partners rose 3.5 percent ($10.6 billion), which was
mostly due to an increase in motor vehicle imports from Mexico.
U.S. imports under an FTA declined the most from Oman, largely due to a 64.3
percent drop in U.S. imports of crude petroleum.
Table 5.4
U.S. imports for consumption that entered
under FTA provisions, by FTA partner, 2015–17
|
FTA partner
|
2015
|
2016
|
2017
|
2016–17
|
|
|
|
Million $
|
|
% change
|
|
NAFTA
|
316,260
|
302,019
|
312,637
|
3.5
|
|
Canada
|
140,755
|
131,203
|
129,875
|
-1.0
|
|
Mexico
|
175,504
|
170,816
|
182,763
|
7.0
|
|
Non-NAFTA
|
56,851
|
72,428
|
72,416
|
0.0
|
|
Israel
|
2,908
|
2,750
|
2,693
|
-2.1
|
|
Jordan
|
1,349
|
1,355
|
1,485
|
9.6
|
|
Chile
|
4,860
|
4,691
|
5,940
|
26.6
|
|
Singapore
|
1,658
|
1,842
|
1,806
|
-1.9
|
|
Australia
|
5,122
|
3,703
|
3,914
|
5.7
|
|
Morocco
|
256
|
190
|
201
|
5.9
|
|
Bahrain
|
527
|
499
|
581
|
16.5
|
|
CAFTA-DR
|
13,524
|
13,662
|
13,697
|
0.3
|
|
Oman
|
598
|
815
|
708
|
-13.1
|
|
Peru
|
2,731
|
2,659
|
3,310
|
24.5
|
|
South Korea
|
17,872
|
34,885
|
33,015
|
-5.4
|
|
Colombia
|
5,405
|
5,324
|
5,010
|
-5.9
|
|
Panama
|
41
|
53
|
56
|
5.8
|
|
FTA
partner total
|
373,110
|
374,447
|
385,055
|
2.8
|
|
World
total
|
2,226,615
|
2,173,617
|
2,330,447
|
7.2
|
Source:
USITC DataWeb/USDOC (accessed March 14, 2018).
Note:
Because of rounding, figures may not add to totals shown.
CAFTA-DR
is a multiparty FTA that includes the Dominican Republic, El Salvador,
Guatemala, Honduras, Nicaragua, and Costa Rica.
Jordan remained the partner with the highest ratio of
imports entered under an FTA to total imports, with a ratio of 88.0 percent
(table 5.5). Other countries with notably high ratios include Oman (66.3
percent), Bahrain (58.3 percent), and Mexico (58.2 percent). CAFTA-DR countries
as a whole also had a high FTA imports-to-total-imports ratio, at 57.9 percent.
Each CAFTA-DR partner had large shares, except for Costa Rica, for which the
ratio was 32.7 percent. The partners with the smallest shares of imports
entered under an FTA to total imports continued to be Singapore (9.3 percent),
Israel (12.3 percent), and Panama (12.7 percent). The imports from these
countries often entered the United States free of duty under normal trade
relations rates.
Table 5.5
Ratio of U.S. imports for consumption under
FTAs to U.S. general imports, by partner, 2015–17
|
FTA partner
|
2015
|
2016
|
2017
|
|
|
|
Percent
|
|
|
NAFTA
|
53.4
|
52.8
|
50.9
|
|
Canada
|
47.5
|
47.2
|
43.3
|
|
Mexico
|
59.2
|
58.1
|
58.2
|
|
Non-NAFTA
|
31.3
|
41.0
|
39.6
|
|
Israel
|
11.9
|
12.4
|
12.3
|
|
Jordan
|
90.4
|
87.2
|
88.0
|
|
Chile
|
55.4
|
53.3
|
56.3
|
|
Singapore
|
9.1
|
10.3
|
9.3
|
|
Australia
|
47.1
|
38.9
|
38.9
|
|
Morocco
|
25.3
|
18.6
|
16.4
|
|
Bahrain
|
58.4
|
64.9
|
58.3
|
|
CAFTA-DR
|
56.9
|
58.5
|
57.9
|
|
Oman
|
65.9
|
72.4
|
66.3
|
|
Peru
|
54.1
|
42.5
|
45.4
|
|
South Korea
|
24.9
|
49.9
|
46.4
|
|
Colombia
|
38.4
|
38.6
|
37.0
|
|
Panama
|
10.0
|
13.0
|
12.7
|
|
FTA
partner total
|
48.2
|
50.0
|
48.3
|
Source:
USITC DataWeb/USDOC (accessed March 14, 2018).
Note:
Because of rounding, figures may not add to totals shown.
CAFTA-DR
is a multiparty FTA that includes the Dominican Republic, El Salvador,
Guatemala, Honduras, Nicaragua, and Costa Rica.
In February 2016, the United States and 11 other countries
signed the Trans-Pacific Partnership. Although the U.S. administration worked
during 2016 to prepare the signed agreement for Congressional consideration,
implementing legislation was not submitted to Congress by yearend. In January
2017, newly elected President Donald Trump instructed the U.S. Trade
Representative (USTR) to formally withdraw the United States from further TPP
discussions.
U.S. and European Union (EU) officials began negotiating a
Transatlantic Trade and Investment Partnership Agreement in 2013. By the end of
2016, 15 negotiating rounds had been held.
In January 2017, the United States and EU issued a joint report on the status
of negotiations as of the end of 2016, and highlighted areas that still needed
“significant work.” These areas included (1) the most sensitive tariff lines
(the final 3 percent of tariff lines); (2) market access in service sectors;
(3) sanitary and phytosanitary measures; (4) mutual recognition of professional
qualifications; (5) government procurement; (6) standards and conformity
assessment procedures; (7) investor protection; (8) labor and environmental
protection; (9) electronic commerce; (10) energy; and (11) trademarks, generic
names, and geographical indications.
No TTIP negotiations were held in 2017 and, as of June 2018, none were
scheduled for 2018.
The North American Free Trade Agreement (NAFTA) between the
United States, Canada, and Mexico entered into force on January 1, 1994. All of
the agreement’s provisions were implemented, as scheduled, by the three parties
by January 1, 2008, with the exception of the NAFTA cross-border trucking
provisions.
On May 18, 2017, more than 23 years after NAFTA entered into
force, USTR notified Congress that the President intended to initiate
negotiations with Canada and Mexico to modernize the agreement.
The negotiations began on August 16, 2017, in Washington, DC,
with two primary goals.
The first is to update NAFTA with modern provisions on digital trade,
intellectual property, cybersecurity, good regulatory practices, and treatment
of state-owned enterprises. The second is to “rebalance NAFTA” in a way that
makes it easier to reduce the U.S. trade deficit with Canada and Mexico.
Within this framework, USTR has “set as its primary
objective for these negotiations to improve the U.S. trade balance and reduce
the trade deficit with the NAFTA countries.”
To accomplish this objective, USTR is focusing on tightening rules of origin
for products imported into the United States from Canada and Mexico to ensure
they contain considerable regional, and U.S.-specific, content. The focus is on
products for which the United States has significant trade imbalances, such as
in automobiles and automotive parts.
In addition, USTR has proposed that all provisions in the labor and environment
chapters be subject to the same dispute settlement mechanism that applies to
other obligations under the agreement.
In developing these objectives, USTR held numerous meetings
with congressional leaders and private sector advisory committees, and held
public hearings on June 27–29, 2017.
USTR received more than 12,000 public comments for the hearings that were
reviewed and integrated into the Administration’s priorities for the
renegotiation. On November 17, 2017, after four rounds of negotiations USTR
updated the NAFTA negotiation objectives.
By the end of 2017, five negotiating rounds had been
completed (table 5.6). At the end of the third round of negotiations, USTR
announced that the chapter on small and medium-sized enterprises had been
completed.
The chapter on competition was completed in round four. The same round also saw
progress in several other negotiating areas, including customs and trade
facilitation, digital trade, good regulatory practices, and certain sectoral
annexes.
Throughout the negotiations, officials from all three countries continued to
engage representatives of the private sector, industry associations, and civil
society, including labor groups.
Table 5.6
Timetable of major NAFTA negotiations,
2017–18
|
Negotiation Round
|
Date
|
City
|
|
First round
|
August 16–20, 2017
|
Washington, DC
|
|
Second
round
|
September
1–5, 2017
|
Mexico
City
|
|
Third round
|
September 23–27, 2017
|
Ottawa
|
|
Fourth
round
|
October
11–17, 2017
|
Arlington,
Virginia
|
|
Fifth round
|
November 17–21, 2017
|
Mexico City
|
|
Sixth
round
|
January
23–28, 2018
|
Montreal
|
|
Seventh round
|
February 25–March 5, 2018
|
Mexico City
|
Source:
USTR,
2018 Trade
Policy Agenda and 2017 Annual Report
, March, 2018; USTR. “
Trilateral
Statement on the Conclusion of the Fifth Round of NAFTA Negotiations
,”
November 21, 2017 (accessed April 5, 2018).
NAFTA’s central oversight body is the Free Trade Commission,
which is responsible for overseeing NAFTA’s implementation and elaboration, as
well as activities under its dispute settlement provisions. The commission itself
has not officially met since 2012.
However, lower-ranked officials of the three member countries have met
regularly to consider approaches to expand and deepen trade and investment
opportunities in North America, and in 2017, met to renegotiate the agreement.
The following sections describe the major activities of
NAFTA’s Commission for Labor Cooperation (CLC) and Commission for Environmental
Cooperation (CEC) during 2017, as well as dispute settlement activities under
NAFTA Chapters 11 and 19 in that year.
NAFTA's
Commission for
Labor Cooperation
The CLC, composed of a ministerial council and an
administrative secretariat, was established under the North American Agreement
on Labor Cooperation (NAALC). The NAALC is a supplemental agreement to NAFTA
that aims to promote effective enforcement of domestic labor laws and foster
transparency in administering them. The CLC is responsible for implementing the
NAALC.
Each NAFTA partner has a national administrative office
(NAO) within its labor ministry to act as the contact point with the other
parties, the secretariat, other government agencies, and the public.
Another NAO function is to receive and respond to public communications on
labor law matters arising in another NAALC country. The United States’ NAO is
the Office of Trade and Labor Affairs in the U.S. Department of Labor (USDOL).
Each NAO establishes its own domestic procedures for reviewing and responding
to public communications.
The NAOs and the secretariat also carry out the cooperative
activities of the CLC, including seminars, conferences, joint research
projects, and technical assistance.
As part of the renegotiations, the United States is proposing to make the labor
obligations subject to the same dispute settlement mechanism as other
enforceable obligations of NAFTA.
As of the end of 2017, there were three submissions under
review at the NAALC. One with the United States’ NAO (involving Mexico),
and two with the Canadian NAO (one involving Mexico and one involving the
United States).
In December 2017, Mexico’s executive branch submitted
legislation to its Congress to amend Mexico’s Federal Labor Law by implementing
constitutional reforms to the labor justice system enacted in February 2017.
One of the reforms consists of transferring the authority to adjudicate labor
disputes from the current tripartite Conciliation and Administrative Boards to
new labor courts, while transferring the registration of unions and collective
bargaining agreements to a new federal institution. The U.S. Administration is
consulting with the Mexican government about the reforms through the ongoing
renegotiation of NAFTA.
NAFTA's
Commission for
Environmental Cooperation
The CEC was established under Article 8 of the North
American Agreement on Environmental Cooperation. This supplemental agreement,
which came into force at the same time as NAFTA, is designed to support NAFTA's
environmental goals, which are to protect and improve the environment, support
sustainable development, and increase cooperation in reaching these goals.
The CEC was established to support cooperation among the parties to reach these
goals.
Articles 14 and 15 of the supplemental agreement offer
citizens and nongovernmental organizations a mechanism to help enforce
environmental laws in the NAFTA countries. Article 14 governs alleged
violations submitted for review by the CEC. It sets out guidelines about
criteria for submissions and for parties that can file complaints. Article 15
outlines the CEC Secretariat’s obligations in considering the submissions and
publishing findings in the factual record.
At the end of 2017, two complaint files remained active under Articles 14 and
15. One, involving Mexico, was submitted in 2016, and the other, involving
Canada, was submitted in 2017 (table 5.7).
Table 5.7
Active files as of yearend 2017 under
Articles 14 and 15 of the North American Agreement on Environmental Cooperation
|
Name
|
Case
|
First filed
|
Country
|
Status
|
|
Agricultural Waste Burning in Sonora
|
SEM-16-001
|
January 22, 2016
|
Mexico
|
The Secretariat submitted a draft factual record to
Council for a 45-day comment period on the accuracy of the draft.
|
|
Alberta
Tailings Ponds II
|
SEM-17-001
|
June
26, 2017
|
Canada
|
The
Secretariat received a response from the concerned government party and began
considering whether to recommend a factual record.
|
Source:
CEC, “
Submission on Enforcement
Matters: Active Submissions
” (accessed April 9, 2018).
Refers to
the country against which an allegation was filed.
At the 24th regular session of the CEC Council on June 28,
2017, in Charlottetown, Prince Edward Island, Canada, a new trilateral
cooperative work program for the CEC was announced. Its focus was primarily on
improving the outcomes of interactions between trade and the environment.
Panelists discussed sustainable and innovative water-related businesses,
increasing resilience through cooperation, sustainable economic growth on the
water’s edge, and solution-focused innovation.
The session also featured a dialogue with youth and the public on how
innovation can accelerate clean growth and advance North American
competitiveness.
Under the
Operational Plan of the Commission for
Environmental Cooperation 2017–2018
,
the CEC will undertake 10 cooperative projects that bring together experts on
environmental issues of regional concern. Examples include “greening” transport
by reducing maritime shipping emissions; achieving legal and sustainable trade
in select North American species; measuring and mitigating food loss and waste;
protecting pollinators vital to food crops; advancing growth and conservation
of migratory species through ecotourism; and improving cost-effectiveness and
environmental protection through higher industrial energy efficiency.
The United States accepted chairmanship of the CEC Council
for 2018, and announced it will host the 2018 CEC Council Session in Oklahoma
City.
The Border Environment Cooperation Commission and the North
American Development Bank were created in 1994 to address environmental issues
in the U.S.-Mexico border region.
As of December 31, 2017, the bank had contracted a total of about $3.0 billion
in loans and grants to help finance 244 projects estimated to cost a total of
$9.3 billion. Of the financing contracted, 94 percent has been disbursed.
The dispute settlement provisions of NAFTA Chapters 11
(Investment) and 19 (Review and Dispute Settlement in
Antidumping/Countervailing Duty Matters) cover a variety of areas.
The sections below describe developments during 2017 in NAFTA Chapter 11
investor-state disputes and Chapter 19 binational reviews of final
determinations of antidumping and countervailing cases. Appendix table A.26
presents an overview of developments in NAFTA Chapter 19 dispute settlement
cases to which the United States was a party in 2017.
NAFTA Chapter 11 Dispute Settlement Developments
Chapter 11 of NAFTA includes provisions designed to protect
cross-border investors and to make it easier to settle investment disputes.
Under subpart B of Chapter 11, an individual investor who alleges that a NAFTA
country has breached its investment obligations under Chapter 11 may pursue
arbitration through internationally recognized channels or remedies available
in the host country’s domestic courts.
A key feature of the Chapter 11 arbitral provisions is the enforceability in
domestic courts of final awards made by arbitration tribunals.
In 2017, there were 5 active Chapter 11 cases filed against the United States,
4 of them filed by Canadian investors and 1 filed by Mexican investors;
11 filed by U.S. investors against Canada;
and 4 filed against Mexico, 3 by U.S. investors and 1 by Canadian investors.
NAFTA Chapter 19 Dispute Panel Reviews
Chapter 19 of NAFTA provides for a binational panel to
review final determinations made by national investigating authorities in
antidumping and countervailing duty cases.
Such a panel serves as an alternative to judicial review by domestic courts and
may be established at the request of any involved NAFTA country.
At the end of 2017, the NAFTA Secretariat listed six binational panels active
under Chapter 19 (table 5.8). The United States filed two cases contesting
Mexico’s determinations; Canada filed three cases contesting U.S.
determinations; and Mexico filed one case contesting U.S. determinations.
Table 5.8
NAFTA Chapter 19 binational panels, active
reviews through 2017
|
Country
|
Case number
|
National agencies’ final
determination
|
Case title
|
|
Mexico
|
|
|
|
|
|
MEX-USA-2015-1904-01
|
SE
Antidumping Administrative Review
|
Ammonium
sulphate
|
|
|
MEX-USA-2016-1904-01
|
SE Antidumping Administrative Review
|
Ethylene glycol monobutyl ether
|
|
United
States
|
|
|
|
|
|
USA-CDA-2015-1904-01
|
USDOC Antidumping Administrative Review
|
Supercalendered paper
|
|
|
USA-CDA-2017-1904-02
|
USDOC
Antidumping Administrative Review
|
Certain
softwood lumber products
|
|
|
USA-CDA-2017-1904-03
|
USDOC Antidumping Administrative Review
|
Certain softwood lumber products
|
|
|
USA-MEX-2017-1904-01
|
USDOC
Antidumping Administrative Review
|
Certain
circular welded non-alloy steel pipe
|
Source:
NAFTA Secretariat, “
Status
Report of Panel Proceedings—Chapter 19 Active Cases
“ (accessed April
9, 2018).
The
United States filed the first two cases contesting Mexico’s determinations,
while Canada filed three cases and Mexico one case contesting U.S.
determinations.
In
Canada, final dumping and subsidy determinations are made by the Canada Border
Services Agency (CBSA), and injury determinations are made by the Canadian
International Trade Tribunal (CITT). In Mexico, all determinations are made by
the Secretariat of the Economy (SE). In the United States, dumping and subsidy
determinations are made by the U.S. Department of Commerce (USDOC), and injury
determinations are made by the USITC. NAFTA Secretariat, “Overview of the
Dispute Settlement Provisions,” accessed March 15, 2017.
In 2017, U.S. officials met with FTA partners for
discussions on a variety of matters, including labor and environmental issues,
enhancing trade and investment, and dispute settlement. Highlights of these
consultations are presented in this section.
Thirteen of the 14 U.S. FTAs have labor provisions to
protect worker rights and facilitate cooperation on labor issues.
The U.S. Department of Labor, which monitors reports and submissions made under
the labor chapters of U.S. trade agreements, reported two developments in 2017:
(1) a January 2017 submission under the U.S.-Colombia TPA, and (2) a June 2017
report issued regarding the arbitral panel decision reached under CAFTA-DR
concerning Guatemala.
Further details are set out below.
Twelve of the 14 U.S. FTAs have investment provisions
designed to protect foreign investors and their investments, as well as to
facilitate the settlement of investment disputes.
The U.S. Department of State reported two submissions in 2017 under the
U.S.-Panama TPA,
both on behalf of Bridgestone Licensing Services, Inc. and Bridgestone Americas,
Inc. The submissions alleged that a decision by the Supreme Court of Panama
related to trademark proceedings violated certain provisions of the U.S.-Panama
TPA.
The U.S.-Australia Joint Committee, the central body under
the 2005 U.S.-Australia Free Trade Agreement, held its sixth meeting in
December 2017 to review the operation of the agreement. The Joint Committee
received a report from the FTA’s Committee on Sanitary and Phytosanitary
Measures about its efforts to address sanitary and phytosanitary issues
affecting agricultural trade between the two countries. The two sides agreed to
meet again in 2018 to review the FTA’s implementation.
The Joint Committee, the primary body overseeing the 2006
U.S.-Bahrain Free Trade Agreement, met in 2017 to review the FTA’s chapters
covering customs, services, and investment; to consider possible cooperation
with the broader Middle East and North Africa region; and to address matters
concerning labor rights and the environment.
Labor
In 2017, U.S. officials met with government officials from
Bahrain, as well as with representatives from labor unions and businesses, to
continue discussions on labor rights that began in 2013. Subjects addressed in
these talks included Bahrain’s response to employment discrimination,
enforcement of laws on freedom of association and collective bargaining, how to
amend Bahrain’s labor laws to make them more consistent with international
standards, as well as encouraging regular dialogue between government, labor,
and business representatives. In December 2017, representatives from the two
sides met in Washington, DC, to discuss possible Bahraini initiatives in
remaining areas of interest, and agreed to continue discussions in 2018.
Environment
During 2017, U.S. officials and experts met with Bahrain’s
Supreme Council for Environment to continue efforts set out under the
U.S.-Bahrain Memorandum of Understanding on Environmental Cooperation.
The MOU was negotiated in parallel with the U.S.-Bahrain FTA to support the
dual goals of strengthening environmental protection under the FTA’s
Environment Chapter and promoting sustainable development as trade expands
under the FTA. Both sides look to revise the Plan of Action developed under the
MOU, as approved by the Bahraini cabinet in August 2017, and expect to
reconvene in 2018.
The CAFTA-DR central oversight body, the Free Trade
Commission, met in 2017, and agreed to modify certain product-specific rules of
origin to reflect changes in the nomenclature of the 2017 global Harmonized
System of tariff classifications.
In addition, the United States worked bilaterally with a number of CAFTA-DR
partners in 2017 on matters related to implementation of the agreement. For
example, the United States worked with several partners on agricultural trade,
in particular poultry tariffs and tariff-rate quotas.
Labor
In January 2017, Honduras passed a new labor inspection law
in an effort to bring the country into compliance with CAFTA-DR’s Labor Chapter
provisions, following a Monitoring and Action Plan signed in 2015 between
Honduras and the United States.
On June 26, 2017, the arbitral panel decision was released
in a case concerning violations of the CAFTA-DR Labor Chapter, brought by the
United States against Guatemala in April 2008. The panel found that Guatemala
had failed to effectively enforce its labor laws, but that violation of
CAFTA-DR labor provisions could not be proven without other required evidence.
Environment
CAFTA-DR officials met twice in 2017 to discuss
environmental priorities under the agreement, in particular to prepare for
meetings of the agreement’s Environmental Affairs Council.
The Council held its 11th meeting June 21–22, 2017, to discuss progress and
challenges under the CAFTA-DR Environment Chapter, and focused in particular on
environmental impact assessments and best practices concerning air quality and
waste management laws.
The U.S.-Chile Free Trade Commission, the supervisory body
for the 2004 U.S.-Chile Free Trade Agreement, convened its most recent meeting
in December 2016, and expects to hold its 12th meeting in 2018.
Labor
In April 2017, Chile’s most recent labor reform went into
effect. It covers areas related to collective bargaining, such as an employer’s
ability to replace striking with non-striking workers, as well as expanding
collective bargaining rights to certain temporary workers and apprentices and
removing obstacles that previously limited collective bargaining to the
individual enterprise level.
Environment
The Secretariat of the Convention on International Trade in
Endangered Species of Wild Fauna and Flora (CITES) announced in 2017 that
Chile’s new wildlife law fully satisfied commitments made in implementing CITES
international standards. The new law was supported by efforts to promote
environmental protection in Chile taken with the help of the FTA’s Joint
Commission for Environmental Cooperation.
The U.S.-Colombia Free Trade Commission, the oversight body
under the 2012 U.S.-Colombia Trade Promotion Agreement (CTPA), worked on
initiatives launched at the first Free Trade Commission meeting in November
2012. These included changes to the CTPA’s dispute settlement mechanism and
updates to the CTPA’s rules of origin, including updates to reflect changes in
trade nomenclature in the 2012 and 2017 Harmonized System. The Free Trade
Commission expects to conclude this work in 2018.
The CTPA’s Committee on Agriculture and its Committee on
Sanitary and Phytosanitary Measures also met, leading to an exchange of letters
in August 2017 that removed the temporary restrictions on U.S. paddy rice
imported into Colombia originally agreed in 2012.
The CTPA’s Free Trade Commission also arrived at decisions on two other
agricultural matters in November and December 2017, respectively: it (1)
clarified tariff treatment for U.S. yellow corn imported into Colombia under a
tariff-rate quota, and (2) clarified product coverage for U.S. variety meats
imported into Colombia under a second tariff-rate quota.
Labor
On January 11, 2017, the U.S. Department of Labor issued a
report in response to a submission filed May 16, 2016, under the CTPA’s Labor
Chapter, by the American Federation of Labor and Congress of Industrial
Organizations (AFL-CIO) and five Colombian workers’ organizations.
The report recommended that the U.S. Secretary of Labor open consultations
under the TPA, and set out 19 recommendations aimed at addressing a range of
labor concerns. Areas of particular focus included violence against unionists,
protection of labor rights, labor law inspection, and enforcement of rights to
protect freedom of association and collective bargaining in Colombia. Four
meetings were held later in 2017 between the two sides regarding CTPA labor
commitments––three in Washington, DC, and one in Bogotá, as well as a
videoconference in April 2017.
The U.S.-Israel Joint Committee was established as the
central body overseeing the 1985 U.S.-Israel Free Trade Agreement.
On May 10, 2017, the Joint Committee signed a decision revising the rules of
origin provisions in the FTA.
On December 5, 2017, the two countries also agreed to extend the 2004 Agreement
on Trade in Agricultural Products (ATAP) through December 31, 2018, to allow
time to negotiate a successor agreement.
This agreement provides preferential market access to U.S. agricultural
products, but does not conform to the FTA’s objective of free trade in
agricultural products. The ATAP was first reached in 1996, and renegotiated in
2004 to remain in effect through December 2008. Since then, both sides have
extended the 2004 ATAP on an annual basis, pending a new agreement.
In 2017, the United States and Jordan continued to consult
on the implementation of the 2001 U.S.-Jordan Free Trade Agreement and to work
on the environmental matters set out under the 2014–2017 Work Program of the
FTA’s Environment Chapter.
Labor
During 2017, Jordan and the United States continued work
toward completion of the Implementation Plan signed in 2016, which aims to
ensure a broader scope for labor inspections to include garment dormitories. In
addition, Jordan agreed to make factory-level audits publicly available in
2017.
The fourth meeting of the KORUS FTA Joint Committee was held
in Seoul on January 12, 2017.
Also in 2017, the following committees met under the KORUS FTA: the Automobiles
Working Group, the Committee on Services and Investment, the Committee on Trade
in Goods, the Committee on Technical Barriers to Trade, the Professional
Services Working Group, and the Committee on Trade Remedies.
In November 2017, the KORUS FTA Sanitary and Phytosanitary Committee met and
discussed a number of the United States’ market access requests with South
Korea’s Ministry of Agriculture, Food, and Rural Affairs. According to USTR,
these issues included market access for blueberries from states beyond Oregon;
improvement of the cherry export program; and market access for U.S. apples and
pears, which South Korea currently bans.
On July 12, 2017, USTR Robert Lighthizer formally notified
South Korea that the United States was calling for a special session of the
Joint Committee, established under Article 22.2 of the KORUS FTA, to discuss
possible amendments and modifications to KORUS and to “review progress on the
implementation of the Agreement, resolve several problems regarding market
access in South Korea for U.S. exports, and, most importantly, address our
significant trade imbalance.”
This special session, which was held on August 22, 2017, in South Korea, was
the first special session held under the KORUS FTA.
The daylong meeting was attended by USTR Lighthizer via teleconference.
On September 21, 2017, South Korean Trade Minister
Hyun-chong Kim formally requested the second special session of the Joint
Committee.
The meeting was held on October 4, 2017, in Washington, DC, and was co-chaired
by Ambassador Lighthizer and Minister Kim.
Following that meeting, South Korea began the domestic procedures required for
it to begin discussions to amend the agreement. Those procedures included an
assessment of the economic feasibility of the agreement, a public hearing, and
reports to the National Assembly.
These procedures were completed in December 2017, when it was announced that
negotiations on amendments and modifications to KORUS would begin on January 5,
2018.
The U.S.-Morocco Joint Committee held its fifth meeting on
October 18, 2017, under the 2006 U.S.-Morocco Free Trade Agreement. The Joint
Committee noted progress in the areas of agriculture, labor, and environmental
matters, as well as Morocco’s commitment to allow access for U.S. automobile
exports made to U.S. safety standards.
The two countries also agreed to further discussions on Moroccan market access
for U.S. pharmaceutical products.
Agriculture and Sanitary and Phytosanitary Measures
The two countries held meetings of the FTA’s Subcommittee on
Agriculture as well as the Subcommittee on Sanitary and Phytosanitary Measures.
At the Agriculture Subcommittee meetings, and later at the Joint Committee
meeting, Morocco agreed to fully tender FTA imports under its wheat tariff-rate
quota in each calendar year, and to re-tender in particular situations. Morocco
also agreed at the Joint Committee meeting to accelerate the phaseout of
tariffs on a number of wheat, beef, and poultry products from the United States
for which Morocco applied a lower duty on EU products. At the meeting of the
Subcommittee on Sanitary and Phytosanitary Measures, Morocco removed its ban on
U.S. beef product imports previously subject to restrictions because of bovine
spongiform encephalopathy. Morocco also agreed to set import alerts for certain
wheat fungal toxins (mycotoxins) at standard international levels.
Labor
In August 2017, Morocco began to implement a law addressing
certain domestic worker rights, an issue originally raised in 2014 by the
United States under the FTA’s Subcommittee on Labor. When fully implemented,
the law will provide a number of protections and benefits for domestic workers.
Environment
At the FTA’s Joint Cooperation Committee meeting in 2017,
the two countries continued to work on environmental matters under the
2014–2017 Plan of Action, as set out by the U.S.-Morocco Joint Statement on
Environmental Cooperation. In particular, the two sides highlighted in 2017 the
establishment of protocols implementing Morocco’s new legislation in support of
the Convention on International Trade in Endangered Species of Wild Fauna and
Flora (CITES).
In 2017, the two sides began to prepare a new Plan of Action
for 2018–2021 regarding environmental matters under the 2009 U.S.-Oman Free
Trade Agreement. This follows completion of the 2014–2017 Plan originally
established under the U.S.-Oman Memorandum of Understanding on Environmental
Cooperation.
The U.S.-Panama Free Trade Commission provides the key
oversight for the 2012 U.S.-Panama Trade Promotion Agreement.
The Free Trade Commission held its second meeting in November 2016 and expects
to hold its third meeting in 2018.
Labor
Under the TPA’s Labor Chapter, representatives from the U.S.
Department of Labor and Panama’s Ministry of Labor and Maritime Authority met
in August 2017 to discuss labor law enforcement issues concerning child labor,
wage-and-hour protections, union registration, short-term contracts, and
subcontracting, as well as occupational safety and health issues.
Environment
In 2017, the two sides continued efforts to establish an
independent secretariat for environment matters under the agreement. The
secretariat is presently situated in the Water Center for the Humid Tropics of
Latin America and the Caribbean, located in Panama City, Panama. In 2017, the
center’s Council hired an executive director, as well as agreed to an initial
outreach plan for the Secretariat.
During 2017, the U.S.-Peru Free Trade Commission continued
its work as the central body overseeing the implementation of the 2009
U.S.-Peru Trade Promotion Agreement (PTPA), and is expected to meet next in
2018.
Labor
In June 2017, U.S. officials visited Peru to follow up on
the issues identified in a U.S. Department of Labor report released in March
2016 in response to a public submission filed under the Labor Chapter of the
PTPA in July 2015. The USDOL report raised concerns about Peru’s protection of
fundamental labor rights and enforcement of labor laws. U.S. officials also
held videoconferences with their Peruvian counterparts to discuss these issues
in August and December 2017.
Environment
The two governments made progress under the 2015–2018 Work
Program of PTPA’s Environmental Cooperation Agreement, signing a memorandum of
understanding between the U.S. Environmental Protection Agency and the Peruvian
Organization of Evaluation and Environmental Inspection to support Peru’s
efforts to strengthen enforcement of and compliance with Peruvian environmental
laws.
Nonetheless, the U.S. Interagency Committee on Trade in Timber Products from
Peru determined during 2017 that Peru had made insufficient progress to stem
illegal logging. As a consequence, USTR instructed the U.S. Customs and Border
Protection Agency to deny future timber shipments from a Peruvian exporter,
subject to verification.
The United States and Peru expect to hold a review in 2018 of implementation of
the PTPA’s Environment Chapter in Lima, Peru, at the senior-level Environmental
Affairs Council.
The United States and Singapore met in July 2017 for a
comprehensive review of the FTA, as well as in March and December 2017 for a
review of the FTA’s labor provisions, and in October 2017 to review the FTA’s
environmental provisions.
Environment
On October 4, 2017, the two sides met to review the implementation
of the Environment Chapter of the 2004 U.S.-Singapore Free Trade Agreement,
in accordance with their Memorandum of Intent on Cooperation in Environmental
Matters and as set out under the 2016–2017 Plan of Action for Environmental
Cooperation.
Discussions centered largely on enforcement of environmental laws, particularly
to combat wildlife and timber trafficking in the region. In 2017, cooperation
between the two governments on environmental matters helped cut off the sale of
illegal wildlife products. This work led to a July 2017 commendation from the
Secretary-General of the Convention on International Trade in Endangered
Species of Wild Fauna and Flora, recognizing Singapore’s 2014 actions in
interdicting an illegal shipment of rosewood logs.
Top of the page
This chapter reviews U.S. bilateral trade relations with the
United States’ top trading partners in 2017: the European Union (EU), China,
Canada, Mexico, Japan, South Korea, India, and Taiwan (ordered according to the
value of their two-way merchandise trade). For each trading partner, the
chapter summarizes U.S. bilateral trade, including two-way merchandise and
private services trade, the U.S. trade balance, U.S. merchandise exports, and
U.S. merchandise imports. That description is followed by summaries of the
major developments in bilateral trade during 2017.
The EU as a single entity is the United States’ largest
two-way (exports plus imports) trading partner in terms of both goods and
services. The value of U.S. merchandise trade with the 28 member states of the
EU increased 4.7 percent, from $686.0 billion in 2016 to $718.5 billion in
2017. However, the EU share of U.S. trade declined slightly, from 18.9 percent
in 2016 to 18.5 percent in 2017, as total U.S. trade with the world increased
by more than U.S. trade with the EU. The U.S. trade deficit with the EU rose by
$4.7 billion, from $146.8 billion in 2016 to $151.4 billion in 2017, but was
still lower than the U.S. trade deficit with the EU in 2015 (figure 6.1).
The EU was the largest market for U.S. merchandise exports
in 2017 for the second year in a row, accounting for 18.3 percent of total U.S.
exports. U.S. exports to the EU increased 5.2 percent, from $269.6 billion in
2016 to $283.5 billion in 2017. Leading U.S. exports to the EU included
civilian aircraft, engines, and parts; medicaments (medicines); refined
petroleum products; crude petroleum; and certain immunological products.
Figure
6.1
U.S. merchandise trade
with the EU, 2013–17
Source:
USITC DataWeb/USDOC (accessed April 24, 2018).
Note:
Underlying data can be found in appendix table
B.5
.
Figure
6.2
U.S. cross-border trade in private services
with the EU, 2013–17
Source:
USDOC, BEA, U.S. International Transactions, Services, & IIP, International
Transactions data, tables 1.2 and 1.3, March 21, 2018.
Note:
Data for 2017 are preliminary.
U.S.
imports from the EU in 2017 are overstated because the data include government
goods and services n.i.e. Underlying data can be found in appendix table
B.7
.
The EU remained the second-largest source of U.S.
merchandise imports, following China, in 2017. The EU accounted for 18.6
percent of total U.S. imports in 2017. U.S. imports from the EU increased 4.5
percent, from $416.4 billion in 2016 to $434.9 billion in 2017. Leading U.S.
imports were passenger motor vehicles, medicaments, parts of turbojets and
turbopropellers, light oils, and airplanes and other aircraft. U.S.-EU
merchandise trade data are shown in appendix tables A.27 through A.30.
Two-way cross-border trade in services with the EU increased
7.2 percent to $426.9 billion in 2017 and accounted for 33.4 percent of total
U.S. trade in services that year. The United States continued to register a
trade surplus in services with the EU, but it declined $11.8 billion in 2017 to
$49.9 billion as U.S. imports increased more than U.S. exports (figure 6.2).
U.S. exports of private services to the EU increased 3.7 percent ($8.4 billion)
to $238.4 billion in 2017, while U.S. imports increased 12.0 percent ($20.2
billion) to $188.5 billion. The United Kingdom (UK) was the EU’s largest
services trader with the United States, with 28.5 percent of the EU total,
followed by Germany and France.
Among the important U.S.-EU trade developments in 2017 were
a bilateral agreement on insurance and reinsurance measures, the first annual
review of the functioning of the Privacy Shield, and a mutual recognition
agreement on good manufacturing practices in pharmaceutical products. Under the
framework of the Transatlantic Economic Council, the United States hosted the
eighth workshop for small and medium-sized enterprises in Wichita, Kansas. All
of these topics are described below.
In other developments, negotiations for the proposed
Transatlantic Trade and Investment Partnership (TTIP) agreement between the United
States and the EU remained dormant in 2017.
The UK continued to prepare for exiting the EU (Brexit) in March 2019. In May
2017, the Office of the U.S. Trade Representative (USTR) and the U.S.
Department of Agriculture (USDA) announced that the EU had lifted rules
requiring that U.S. citrus groves be surveyed for citrus canker before U.S.
citrus exports to the EU would be permitted.
According to USTR, the EU requirement had effectively eliminated EU market
access for a majority of Florida citrus groves.
USTR estimates that U.S. citrus producers will save $5.6 million annually with
the elimination of the EU rules.
During 2017, there were new developments in two long-running
World Trade Organization (WTO) dispute settlement cases on civil aircraft filed
by the EU against the United States. On June 9, 2017, the WTO compliance panel
issued a report in the complaint by the EU regarding U.S. measures affecting
trade in large civil aircraft (DS353). In the second case, on September 4, the
WTO Appellate Body circulated its report in the complaint by the EU relating to
U.S. conditional tax incentives for large civil aircraft (DS487). The
developments in these two cases are described in more detail in chapter 3.
Agreement on Insurance and Reinsurance Measures
On January 13, 2017, the United States and EU announced
conclusion of an agreement
on insurance and reinsurance measures.
Negotiations began in February 2016 following the implementation on January 1,
2016, of a new EU insurance regulatory regime
known as Solvency II.
Solvency II requires that U.S. prudential regulation be deemed equivalent to
that in the EU to prevent “disadvantageous treatment” of U.S. insurers and
reinsurers operating in the EU market.
To address this issue, on September 22, 2017, U.S. and EU officials signed a
“covered agreement” on prudential measures affecting insurance and reinsurance.
At the same time, the U.S. Government issued a policy statement that clarified
how the U.S. views implementation of certain provisions of the agreement.
Although some parts of the agreement will apply provisionally, the agreement is
expected to fully apply after 5 years from the date of signature.
According to a joint U.S.-EU statement issued at the
conclusion of negotiations, the new agreement will ensure “ongoing robust
insurance consumer protection” and will provide “enhanced regulatory certainty
for insurers and reinsurers operating in both the U.S. and the EU.”
The U.S. policy statement said that the agreement “affirms the U.S. system of
insurance regulation, including the role of state insurance regulators as the
primary supervisors of the business of insurance.”
The agreement covers three areas of insurance regulation:
(1) group supervision, (2) collateral and local presence requirements for U.S.
and EU reinsurers operating in the other’s market, and (3) exchange of
information between U.S. and EU supervisory authorities.
Under the new agreement, U.S. and EU insurance and
reinsurance groups active in both the U.S. and EU markets will not be subject
to certain requirements under Solvency II with respect to group supervision for
their worldwide activities. Instead, U.S. and EU groups operating in the other
jurisdiction will only be subject to worldwide prudential insurance group oversight
by the supervisors in their home jurisdiction.
As a result, U.S. insurance groups operating in the EU will not have to meet EU
worldwide group capital, reporting, or governance requirements.
With respect to reinsurance, the agreement eliminates collateral
and local presence requirements for EU and U.S. reinsurers operating in the
other jurisdiction’s market subject to certain conditions (i.e., specified
financial strength and market conduct requirements, such as a record of prompt
payments of claims).
As a result, relief from collateral requirements will reduce obstacles for EU
reinsurers operating in the U.S. market, and within 24 months of signature,
U.S. reinsurers will be fully able to operate in the EU without establishing a
branch or subsidiary.
The agreement also encourages U.S. and EU insurance
supervisory authorities to continue to share supervisory information on
insurers and reinsurers that operate in the U.S. and EU markets.
To facilitate this exchange of information, the agreement contains an annex
with model provisions for a possible future memorandum of understanding on
information exchange.
Privacy Shield
The first annual review of the U.S.-EU Privacy Shield was
held in September 2017. The Privacy Shield, which became operational on August
1, 2016, provides a mechanism for companies to transfer personal data from the
EU to the United States that is consistent with EU law.
Company participation is voluntary and requires a company to certify that it
will comply with a set of principles or obligations for the handling of data
transferred from the EU to the United States.
The Privacy Shield also contains obligations for the U.S. government if U.S.
government officials request access to this personal data for national security
or law enforcement purposes.
As of the date of the annual review, over 2,400 companies had joined the
Privacy Shield.
On September 18–19, U.S. and EU officials met for the first
annual review of the functioning of the Privacy Shield. The meeting addressed
the administration and enforcement of the Privacy Shield, and included Privacy
Shield participants and other stakeholders who shared their views with
government officials and informed the review process.
Based on the meeting, the EU released a report on October 18 that concluded
that “the United States continues to ensure an adequate level of protection for
personal data transferred under the Privacy Shield from the Union to
organisations in the United States.”
In addition, the report listed a number of recommendations for improving the
implementation of the Privacy Shield, including the following:
-
Increase proactive and regular monitoring of
companies’ compliance with the Privacy Shield as well as proactive searches for
false claims of company participation in the Privacy Shield by the U.S.
Department of Commerce.
-
Increase EU individuals’ awareness about how to
lodge complaints under the Privacy Shield by the U.S. Department of Commerce
and EU data protection authorities.
-
Improve cooperation between U.S. and EU enforcers,
including the U.S. Department of Commerce, the Federal Trade Commission, and
the EU data protection authorities, to develop guidance for companies and
enforcers on the interpretation of the Privacy Shield’s rules, which would
provide greater legal certainty for businesses.
-
Strengthen the privacy protections contained in
the U.S. Foreign Intelligence Surveillance Act.
-
As soon as possible, appoint a permanent Privacy
Shield Ombudsperson at the U.S. Department of State, where complaints will be
addressed about U.S. authorities accessing personal data for national security
purposes.
-
More proactive reporting by U.S. authorities of
developments related to the Privacy Shield.
U.S. officials welcomed the release of the report.
On November 29, 2017, in the first three enforcement actions under the Privacy
Shield framework, the Federal Trade Commission announced settlements with
companies that falsely claimed they had been certified to participate in the
Privacy Shield.
U.S.-EU Mutual Recognition Agreement on Pharmaceutical Inspections
On March 2, 2017, the United States and EU agreed to amend
the Pharmaceutical Annex to the 1998 U.S.-EU Mutual Recognition Agreement. The
purpose of amending the annex is to avoid duplicating good manufacturing
practice (GMP) inspections of pharmaceutical manufacturing facilities by
allowing each side to rely on the drug inspections conducted by the other’s
regulatory authority. The updated annex will also allow regulators to devote
more inspection resources to drug manufacturing facilities in other parts of
the world where there may be greater risk.
All drugs approved for use in the United States, regardless
of where they are made, must comply with U.S. regulations. Because some of
these drugs are either fully manufactured abroad or contain some foreign
ingredients, the U.S. Food and Drug Administration (FDA) routinely inspects
foreign as well as domestic drug manufacturing plants for compliance with
manufacturing standards that assure that the products meet quality and product
label requirements.
The agreement with the EU to amend the annex will permit the FDA to rely on EU
inspection reports, lowering inspection costs and enabling regulators to
redirect resources to other parts of the world.
Since May 2014, U.S. and EU authorities have been auditing
and assessing each other’s inspection systems to learn if they meet domestic
requirements. In June 2017, the European Commission determined that the FDA
“has the capability, capacity and procedures in place to carry out GMP
inspections at a level equivalent to the EU.”
In October 2017, the FDA stated that it would recognize the drug regulatory
authorities in 8 of the 28 EU member states (Austria, Croatia, France, Italy,
Malta, Spain, Sweden, and the UK) as capable of conducting inspections of
manufacturing facilities that meet FDA requirements.
This is the first time that the FDA has recognized another country’s inspection
authority.
FDA expects to finish evaluating the remaining EU countries by July 15, 2019.
Transatlantic Economic Council (TEC)
The Transatlantic Economic Council (TEC) was launched in
2007 to promote bilateral cooperation aimed at lowering transatlantic barriers
to trade and investment.
On October 19, 2017, under the TEC framework, the United States hosted the
eighth workshop for small and medium-sized enterprises (SMEs) in Wichita,
Kansas.
The purpose of these workshops is to expand trade and investment opportunities
for U.S. and EU SMEs and discuss trade topics of particular interest to SMEs.
The following topics were discussed at the workshop:
manufacturing SMEs in transatlantic trade, including export strategies,
regulatory issues, and barriers to trade; SME startups, innovation, and competitiveness;
transatlantic skills development for SMEs and best practices in apprenticeships
and vocational training; transatlantic foreign direct investment in
manufacturing; and SME export promotion resources in both the United States and
the EU.
Also, government officials provided an update on the 2015 U.S.-EU SME
Cooperation Arrangement,
which aims to makes it easier for regional innovation clusters and their member
businesses in the United States and EU to form strategic partnerships across
the Atlantic.
In 2017, China remained the United States’ largest
single-country trading partner based on two-way merchandise trade, accounting
for 16.4 percent of total U.S. merchandise trade. U.S. two-way merchandise
trade with China amounted to $635.9 billion in 2017, an increase of 10.0
percent over the $578.2 billion recorded in 2016. The U.S. merchandise trade
deficit with China remained higher than the U.S. trade deficit with any other
trading partner in 2017, amounting to $375.2 billion. Its $28.2 billion
increase relative to the year before reflected a $42.3 billion increase in U.S.
merchandise imports from China that outpaced a $14.8 billion increase in U.S.
merchandise exports to China in 2017 (figure 6.3).
China was the third-largest single-country destination for
U.S. merchandise exports in 2017, behind Canada and Mexico. U.S. merchandise
exports to China amounted to $130.4 billion in 2017, increasing by 12.8
percent, or $14.8 billion, relative to 2016. Leading U.S. exports to China in
2017 were civilian aircraft, engines, and parts, and soybeans. Other leading
U.S. exports to China included small passenger motor vehicles, petroleum, and
semiconductors.
In 2017, U.S. merchandise imports from China amounted to
$505.6 billion, representing 21.6 percent of total U.S. goods imports in that
year. This was more than imports from any other country, and U.S. merchandise
imports from China increased by 9.3 percent relative to the year before.
Leading 2017 U.S. imports from China were cellphones; portable computers and
tablets; telecommunications equipment; computer parts and accessories; and
tricycles, scooters, and related toys. U.S.-China merchandise trade data are
shown in appendix tables A.31 through A.34.
Services trade between the two countries was also
significant. In 2017, China continued to be the United States’ fourth-largest
single-country trading partner based on two-way cross-border services trade of
$73.0 billion. U.S. services trade with China amounted to 5.7 percent of total U.S.
cross-border services trade in 2017, compared to 5.7 percent in 2016 and 5.2
percent in 2015. The U.S. services trade surplus with China increased $600.0
million in 2017 to $38.2 billion, as a result of growing U.S. exports. In 2017,
U.S. services exports to China grew by $1.9 billion, or 3.6 percent, while U.S.
services imports from China grew by $1.4 billion, or 8.6 percent, relative to
the year before (figure 6.4).
Figure
6.3
U.S. merchandise trade with China, 2013–17
Source:
USITC DataWeb/USDOC (accessed April 24, 2018).
Note:
Underlying data can be found in appendix table
B.5
.
Figure
6.4
U.S. cross-border trade in private services
with China, 2013–17
Source:
USDOC, BEA, U.S. International Transactions, Services, & IIP, International
Transactions data, tables 1.2 and 1.3, March 21, 2018.
Note:
Data for 2017 are preliminary. Underlying data can be found in appendix table
B.7
.
Since China’s accession to the WTO in 2001, the United
States has filed 22 WTO complaints against China. Those complaints are more
than half of the total 40 worldwide complaints the United States filed during
that time using the dispute settlement mechanism. China has filed 12 such
complaints against the United States of the 17 it has filed since 2001.
In 2017, the United States filed 1 new complaint against China. Specifically,
on January 12, 2017, the United States requested consultations with China
concerning alleged subsidies that China provides to its producers of primary
aluminum.
In 2017, China did not file any complaints against the United States, though it
had filed 2 by April 4, 2018. Developments in these and other WTO dispute
settlement proceedings during 2017 are described in more detail in chapter 3
and appendix table A.25.
In 2017, the most prominent U.S.-China bilateral trade
issues were discussed in the context of a newly formed Comprehensive Economic
Dialogue (CED). The CED supplanted both the U.S.-China Joint Commission on
Commerce and Trade (JCCT) and the U.S.-China Strategic and Economic Dialogue
(ED)
,and the rmat changed, please
fix.es.ound. Please alphabetize under "ote or text. Reader may not know.
the United States?
. The JCCT had been the primary forum for high-level
trade dialogue since 2003, while the ED, established in 2009, had focused
on a wide range of bilateral and global political, strategic, security, and
economic issues. Major topics addressed by U.S. and Chinese officials in the
CED in 2017 included China’s protection and enforcement of intellectual
property rights (IPRs); Chinese policies and practices that require or pressure
the transfer of U.S. and other foreign technologies to China; and the
implementation of China’s new Cybersecurity Law, as well as a new draft
Standardization Law
.
In addition, a 100-day action plan was agreed upon by U.S.
President Donald Trump and China’s President Xi Jinping during their May 11,
2017, meeting. This plan called for the co-chairmen, which include U.S.
Treasury Secretary Stephen Mnuchin, U.S. Commerce Secretary Wilbur Ross, and China’s
Vice Premier Wang Yang, to jointly address and resolve several outstanding
agricultural trade, financial services, investment, and energy related issues.
According to the 100-day action plan, there were several notable results: (1)
China agreed to take steps to reopen its market to U.S. beef on conditions
consistent with international food safety and animal health standards; (2)
China agreed to allow wholly foreign-owned financial institutions from the
United States to provide credit-rating services in the Chinese market by July
2017; (3) both sides agreed to resolve outstanding issues to allow U.S. imports
of cooked poultry from China; and (4) the United States agreed to allow its
liquefied natural gas exports to China in volumes comparable to other trade
partners with which the United States has no free trade agreement (FTA).
Intellectual Property Rights
The United States and China have long held consultations on
IPRs, technology transfer, and innovation-related issues, particularly since
China’s WTO accession and its acceptance of the WTO Trade-Related Aspects of
Intellectual Property Rights (TRIPS) Agreement.
China has undertaken substantive legal and judicial reforms since 2001 aimed at
protecting IPRs of domestic and foreign entities, in accordance with TRIPS.
However, USTR continued to find China’s 2017 IPR protection and enforcement
regime to be insufficient in many regards.
USTR has also recommended that the Chinese government expand its efforts to
combat the scope and scale of IPR infringement in online and physical
marketplaces, including areas such as Beijing’s Silk Market and Hongqiao
Market, and numerous locations in Guangdong Province.
Given the scope and scale of its reported IPR infringement activities, China
remained on USTR’s Priority Watch List in its
2017 Special 301 Report
.
In its
2017 Special 301 Report
, USTR described
recent IPR-related policy developments in China as well as ongoing IPR-related
problems. The report noted some positive developments in 2017, including (1)
high-level government statements and official goals aimed at developing a
culture of innovation through strengthened intellectual property (IP) laws; (2)
incremental gains in IPR protection reported by U.S. rights holders in China;
and (3) judicial system reforms. Examples of China’s 2017 judicial system
reforms included the expansion of four new specialized IP courts and the
establishment of the Beijing IP Court as the base for the Supreme People’s
Court’s research on case guidance and precedent.
Despite these positive developments in 2017, issues remain
regarding China’s progress in protecting the IPRs of foreign rights holders.
According to the
2017 Special 301 Report
, the volume of counterfeited
products manufactured, sold, and exported from China continued to be a major
concern for U.S. businesses and posed health and safety risks to purchasers.
Moreover, difficulties associated with bad-faith trademark registrations in
China, and the lack of unified legislation on trade secret protection,
continued to be problematic in 2017. According to USTR, industry has continued
to identify trade secret misappropriation as one of their greatest concerns
about operating in China.
Technology Transfers
In 2017, USTR also expressed concern about requirements and
pressures faced by U.S. firms to transfer their technology to Chinese entities
in exchange for market access.
Such practices have reportedly affected U.S. IP holders in a number of sectors,
including information and communications technology, medical device, biotechnology,
semiconductor, new energy vehicles, aviation, and high-tech equipment.
On August 14, 2017, President Trump instructed U.S. Trade
Representative Robert Lighthizer to investigate whether China’s laws, policies,
practices, or actions may be considered unreasonable or discriminatory, or may
be harming U.S. IPRs, innovation, and technical development.
Three days later, USTR Lighthizer, upon consultation with U.S. governmental and
private sector advisory committees, launched an investigation of China under
Section 301 of the Trade Act of 1974.
This part of the Trade Act of 1974 gives USTR authority to respond to a foreign
country’s allegedly unfair trade practices. In the event of an affirmative
determination on the allegations of wrongdoing, USTR has the authority to take
“all appropriate and feasible action to obtain the elimination of the act,
policy, or practice, subject to the direction of the President.”
The results of USTR’s Section 301
Investigation were released in March 2018.
Cybersecurity Law
In 2017, China implemented a Cybersecurity Law drafted by
the Standing Committee of the National People’s Congress in 2016.
According to the U.S.-China Economic and Security Review Commission, this law
will tighten government control over information flows and technology products.
Before China’s new Cybersecurity Law went into effect, U.S. technology
companies expressed concern about being compelled to disclose trade secrets to
Chinese authorities.
Now that legislation has been implemented, U.S. stakeholders continue to
express concern, stating that ambiguities in the law may be used to pressure
them to disclose information about their most critical technologies. Examples
of their most critical technologies that they believe may be susceptible to
disclosure include source codes, design databases, behavioral and logic models,
and floor plans of central processing units.
China committed to keeping its Cybersecurity Law consistent
with WTO agreements in 2016.
At that time, it stated that this law would not impose nationality-based
conditions or restrictions on business’s purchase, sale, or use of information
and communications technology products.
USTR, however, has remained critical of the law, stating that the
cybersecurity-related restrictions on U.S. and foreign high technology products
and services are ultimately aimed at displacing foreign firms from the Chinese
market.
Standards
As in years past, U.S.-China engagement in 2017 included
standards as part of the bilateral dialogue. As part of its reforms in this
area, Chinese authorities allowed greater foreign participation in its
technical committees on related matters and also published a draft version of a
Standardization Law
in
September 2017.
USTR expressed concern about the draft
law
, noting that it would introduce preferences for Chinese
technologies in standards development in line with the government’s longer-term
efforts to leverage the power of the large Chinese market to promote or compel
the adoption of Chinese standards in global markets.
Despite such concerns, China’s September 2017 draft
Standardization Law
was finalized in November 2017 and put
into effect in January 2018.
With respect to technical standards committees, some
progress was made as U.S. and other foreign firms have been increasingly
allowed to participate in standards development and setting in China.
This greater participation has reportedly included voting in working groups on
specific standards development processes.
For the third year in a row, Canada was the second-largest
U.S. single-country trading partner in 2017 after China, having fallen from the
top position it held in 2014 and previous years. Nonetheless, the value of U.S.
merchandise trade with Canada rose 7.0 percent in 2017 to $582.4 billion,
accounting for 15.0 percent of total U.S. merchandise trade with the world—a
share unchanged from 2016. Both U.S. merchandise exports and imports with
Canada increased in 2017 from the previous year, but imports outpaced exports,
resulting in a $6.5 billion increase in the U.S. merchandise trade deficit with
Canada to $17.5 billion (figure 6.5).
Figure
6.5
U.S. merchandise trade with Canada, 2013–17
Source:
USITC DataWeb/USDOC (accessed April 24, 2018).
Note:
Underlying data can be found in appendix table
B.5
.
Figure
6.6
U.S. cross-border trade in private services
with Canada, 2013–17
Source:
USDOC, BEA, U.S. International Transactions, Services, & IIP, International
Transactions data, tables 1.2 and 1.3, March 21, 2018.
Note:
Underlying data can be found in appendix table
B.7
.
In 2017, Canada was the United States’ largest
single-country export market for goods, taking 18.3 percent of U.S. merchandise
exports. U.S. exports to Canada increased by 5.9 percent to $282.5 billion in
2017. Leading U.S. exports to Canada included motor vehicles––vehicles both for
passengers and for goods transport––as well as their parts and accessories;
civilian aircraft, engines, and parts; crude petroleum; and light oils.
In 2017, Canada remained the third-largest single-country
import source for the United States, after China and Mexico. U.S. imports from
Canada were $300.0 billion in 2017, up 8.0 percent from $277.8 billion in 2016.
Energy-related products and transportation equipment accounted for nearly half
of U.S. imports from Canada. Leading U.S. imports were crude petroleum,
passenger motor vehicles, natural gas, coniferous wood and products, and
refined petroleum products. U.S.-Canada merchandise trade data are shown in
appendix tables A.35 through A.38.
Canada remained the second-largest single-country
U.S. trading partner in services in 2017. It reached $90.8 billion in two-way
cross-border trade in services, ranked only behind the UK at $121.6 billion.
U.S. two-way trade in services with Canada grew 9.1 percent in 2017, accounting
for 7.1 percent of total U.S. services trade with the world. U.S. exports of
services to Canada increased 8.9 percent ($4.8 billion) to $58.3 billion in
2017, whereas U.S. services imports from Canada—while only about half the value
of U.S. services exports to Canada—also increased significantly in 2017, by 9.5
percent ($2.8 billion) to $32.5 billion. Overall, the U.S. cross-border trade
surplus in services with Canada grew in 2017 to $25.8 billion. While the
surplus was up from $23.8 billion in 2016, it was still below its recent peak
(2013) of $31.9 billion (figure 6.6).
Much of the U.S.-Canada trade relationship is governed by
the North American Free Trade Agreement (NAFTA). On May 18, 2017, the U.S.
Administration notified Congress of its intent to renegotiate NAFTA’s terms so
as to modernize and rebalance its provisions. Five negotiating rounds were held
by yearend 2017.
In other developments, several U.S. trade remedy cases involving
Canada were active in 2017. In addition, the Canada-United States Regulatory
Cooperation Council continued to meet in 2017 to address regulatory issues that
hinder cross-border trade and investment.
Softwood Lumber
The United States and Canada signed the Softwood Lumber
Agreement (SLA) on October 12, 2006. In it, Canada agreed to apply certain
export measures—notably export charges and volume limits—on its exports of
softwood lumber to the United States when the price of such products fell below
a certain level.
The 2006 SLA had a term originally of seven years; in 2013,
however, the two countries agreed to take advantage of an option to extend the
agreement for an additional two years.
After nine years, though, the 2006 SLA officially expired on October 12, 2015,
although the agreement contained a one-year grace period (“standstill” clause)
to allow renegotiation of a new agreement. During the grace period, the U.S.
lumber industry was not allowed to petition for any trade remedy investigation.
Absent a new agreement following the one-year standstill
period, on November 25, 2016, the U.S. lumber industry petitioned the U.S.
Department of Commerce (USDOC) and the Commission to initiate antidumping and
countervailing duty investigations on imports of certain softwood lumber
products from Canada.
On November 8, 2017, USDOC published its final determination
on antidumping and countervailing duties on U.S. imports of softwood lumber
from Canada.
Subsequently, on December 7, 2017, the Commission voted unanimously that
imports of softwood lumber from Canada had caused material injury to U.S.
softwood lumber producers.
On January 3, 2018, USDOC issued its amended final
affirmative determinations for antidumping and countervailing duty
investigations concerning certain softwood lumber products from Canada.
The amended antidumping duty rates published on four companies ranged between
3.20 percent and 7.28 percent, as well as an “all others” rate of 6.04 percent.
The published amended countervailing duty rates on four companies ranged from
3.34 percent to 17.99 percent, with an “all others” rate of 14.19 percent.
In response to these cases, on November 14, 2017, Canada
requested establishment of a panel under NAFTA to review the softwood lumber
duties issued in the case,
and initiated WTO dispute settlement consultations with the United States on
November 28, 2017.
Aircraft
In May 2005, the government of Canada first announced its support
for research and development into a family of larger commercial aircraft––the
Bombardier's C-series––with a C$350 million repayable contribution (US$275.2
million). The government signed contribution agreements with Bombardier in
2008. During this time, the government of Quebec contributed C$117 million
(US$89.7 million) and the UK government contributed £123 million (US$228.1
million) to the C-series project.
On February 7, 2017, the government of Canada announced it
was making additional repayable program contributions of C$372.5 million
(US$284 million) to Bombardier. These contributions support the development of
the Global 7000 business aircraft through Canada’s Strategic Aerospace and
Defence Initiative (SADI) as well as the Bombardier C-series aircraft. The
contributions will extend over four years, with the majority allocated to the
Global 7000 project.
SADI is a domestic support program for industrial research and pre-competitive
development projects in the aerospace, defense, space, and security industries
that are considered strategic.
On April 27, 2017, the Boeing Company filed antidumping duty
and countervailing duty petitions with the Commission and USDOC concerning
imports of 100- to 150-seat large civil aircraft from Canada. Boeing alleged
that imports of these aircraft from Canada are being, or are likely to be, sold
in the United States at less than fair value, and that such imports are
threatening material injury to the domestic aircraft industry in the United
States.
The USDOC made its preliminary determinations concerning these aircraft in fall
2017—on September 25 for countervailing duty subsidy rates and on October 4 for
antidumping margins.
On October 16, 2017, Airbus and Bombardier announced the
signing of an agreement to become partners on the C-series aircraft program.
Under the agreement, Airbus acquired a controlling interest of 50.01 percent in
the C-series program, with Bombardier holding about a 31 percent interest and
Quebec a 19 percent interest.
As part of the agreement, Airbus is to provide its expertise in procurement,
sales and marketing, and customer support.
On December 18, 2017, USDOC issued its final determinations
in the case, finding a dumping margin of 79.82 percent and a subsidy rate of
212.39 percent regarding Bombardier. At yearend 2017, these duties had not
entered into effect, pending a final injury determination by the Commission in
early 2018.
Canada-United States Regulatory Cooperation Council
In 2011, Canada and the United States established the Canada-United
States Regulatory Cooperation Council (RCC) to advance economic growth by
deepening regulatory cooperation and reducing unnecessary regulatory
differences while maintaining high health, safety, and environmental standards.
The RCC Secretariat—involving the United States Office of Management and Budget
and the Treasury Board of Canada—coordinates and monitors the Council’s work as
well as provides a forum for industry, consumers, and nongovernmental
organizations to discuss regulatory barriers and opportunities as stakeholders.
In 2016–17, the RCC developed 23 technical work plans that
currently contain over 100 initiatives that bring together regulators from both
U.S. and Canadian departments. These work plans cover issue areas addressing
agriculture and food, transportation, health and personal care products,
workplace chemicals, the environment, and various cross-sectoral issues. In
2017, U.S. and Canadian agencies worked together to publish these work plans,
implementing many of the initiatives included in these agencies’ joint
partnership statements.
In 2017, Mexico was the United States’ third-largest
single-country merchandise trading partner, following China and Canada.
Merchandise trade between the two countries increased 6.4 percent to $557.0
billion in 2017, accounting for 14.3 percent of U.S. trade with the world.
While both imports and exports increased in 2017, the U.S. merchandise trade
deficit with Mexico rose by $6.7 billion to $71.1 billion, since U.S. imports
from Mexico increased more than U.S. exports (figure 6.7).
Mexico remained the United States’ second-largest
single-country export market after Canada in 2017, accounting for 15.7 percent
of total U.S. exports to the world. U.S. merchandise exports to Mexico totaled
$243.0 billion, an increase of 5.8 percent from 2016. In 2017, the leading U.S.
exports to Mexico were light oils; computer parts and accessories; refined
petroleum products; processors and controllers; and internal combustion diesel
engines.
Figure
6.7
U.S. merchandise trade with Mexico, 2013–17
Source:
USITC DataWeb/USDOC (accessed April 24, 2018).
Note:
Underlying data can be found in appendix table
B.5
.
Figure
6.8
U.S. cross-border trade in private services
with Mexico, 2013–17

Source:
USDOC, BEA, U.S. International Transactions, Services, & IIP, International
Transactions data, tables 1.2 and 1.3, March 21, 2018.
Note:
Data for 2017 are preliminary. Underlying data can be found in appendix table
B.7
.
Mexico was the United States’ second-largest single-country
import source in 2017 after China and accounted for 20.3 percent of U.S. total
imports. In 2017, U.S. merchandise imports from Mexico increased by 6.8 percent
to $314.0 billion, driven mainly by the increased value of U.S. imports of
transportation equipment. Leading U.S. imports from Mexico included passenger
motor vehicles, computers, motor vehicles for goods transport, crude petroleum,
telecommunications equipment, and color TV reception apparatus. U.S.-Mexico
merchandise trade data are shown in appendix tables A.39 through A.42.
At the same time, the U.S. cross-border trade surplus in
services with Mexico shrank 6.5 percent to $6.6 billion in 2017, largely a
result of increasing U.S. services imports from Mexico (figure 6.8). U.S.
exports of services to Mexico increased 3.9 percent ($1.2 billion) to $32.8
billion in 2017 whereas U.S. services imports from Mexico increased 7.0 percent
($1.7 billion) to $26.2 billion. Mexico continued to be the United States’
sixth-largest single-country trading partner for services in 2017, after the
UK, Canada, Japan, China, and Germany.
Most of the trade relations between Mexico and the United
States are governed by NAFTA. On August 16, 2017, negotiations between the
United States, Canada, and Mexico to modernize NAFTA started in Washington, DC.
Other major U.S.-Mexico trade developments in 2017, including work to improve
U.S.-Mexico border crossings and recent results of NAFTA’s cross-border
trucking provisions, are described below.
Modern Borders
In 2017, the United States and Mexico continued to make
progress on cross-border improvements. On April 20, 2017, officials of U.S.
Customs and Border Protection (CBP) and Mexico’s Tax Administration Service
(SAT) met in Mexico City to advance the development of customs practices for
both the United States and Mexico.
At the meeting, Mexico’s SAT and the CBP expressed their intent to enhance
bilateral work in trade and travel facilitation; continue to cooperate on
innovative approaches to cargo inspection for faster goods flow; improve the
efficiency of their customs processes to manage risk and reduce processing
times and transactional costs; promote better international standards,
measures, and controls in order to enhance supply chain security; and keep
working towards harmonizing data requirements to make cargo processing easier.
On April 21, 2017, CBP Acting Commissioner Kevin McAleenan
traveled to Mexico City with a Department of Homeland Security delegation to
meet with Mexican officials. During their meetings, he praised the success of
the Unified Cargo Inspection Pilot
at the Mariposa port of entry in Nogales, Arizona, for significantly reducing
wait times for both U.S. and Mexican businesses.
On August 17, 2017, senior management from CBP and Mexico’s SAT, together with
executives from Kansas City Southern, a transportation holding company,
formally dedicated a railway processing building in Laredo, TX. Constructed by
Kansas City Southern, the building enables Mexico customs officers to work
collaboratively with CBP officers. According to the CBP, “The joint operations
allow Mexico Customs to complete their outbound inspections and CBP to perform
their inbound inspection processes simultaneously, eliminating unnecessary
delays and duplication while maintaining security and facilitating lawful
commerce.”
In addition, on September 20, 2017, U.S. CBP together with
Mexico’s SAT announced the piloting of their Unified Cargo Processing Program
at the Otay Mesa Cargo Facility. The joint cargo inspections are aimed at
ending separate inspections and reducing wait times at the border.
These efforts add to earlier cross-border projects and facilities undertaken in
previous years.
Cross-Border Trucking between the United States and Mexico
Under the cross-border trucking commitments in Chapter 12 of
NAFTA, Mexican trucks were allowed to provide cross-border truck services
throughout the United States beginning in 2000. However, the implementation of
these provisions was delayed because of U.S. safety concerns.
To address these concerns, the U.S. Department of Transportation and the
Federal Motor Carrier Safety Administration (FMCSA) launched the U.S.-Mexico
Cross-Border Long-Haul Trucking Pilot Program on October 14, 2011.
The program successfully concluded on October 10, 2014.
On January 15, 2015, the FMCSA began accepting applications from
Mexico-domiciled motor carriers interested in conducting long-haul operations
beyond the U.S. commercial zones.
In 2017, reports from the FMCSA indicated that Mexican-owned
or Mexico-domiciled motor carriers continued to operate more safely than U.S.
carriers on U.S. roads. For instance, FMCSA data from 2017 showed that roadside
inspections of Mexican-owned or Mexico-domiciled carriers resulted in driver
out-of-service rates—that is, rates of violations serious enough to halt
drivers’ trips immediately
—of
0.75 percent, compared with a rate of 5.08 percent for all motor carriers on
U.S. highways.
Those rates compare favorably with the 0.82 percent and 4.89 percent,
respectively, in 2016.
In March 2017, the International Brotherhood of Teamsters challenged
the FMCSA’s statutory authority to issue permits for U.S. long-haul operations
to Mexico-domiciled trucking companies, given that the FMCVSA’s inspector
general had found that the 13 drivers used in the pilot program were too few to
draw inferences about the safety of the entire population of Mexico-domiciled
carriers expected to receive long-haul authority within the United States. In
June 2017, a three-judge panel denied the petition on the grounds that the law
did not mandate any particular threshold of statistical validity.
In 2017, Japan remained the United States’ fourth-largest
single-country trading partner in terms of two- way trade, accounting for 5.3
percent of total U.S. merchandise trade. Specifically, U.S. merchandise trade
with Japan increased 4.6 percent, from $195.3 billion in 2016 to $204.2 billion
in 2017. At the same time, the U.S. merchandise trade deficit with Japan rose
by just $38 million in 2017 to $68.8 billion. The increase in the bilateral
merchandise trade deficit was attributable to a $4.46 billion increase in U.S.
exports to Japan, and a corresponding $4.49 billion increase in U.S. imports
(figure 6.9).
Japan remained the fourth-largest destination for U.S.
merchandise exports in 2017, accounting for 4.4 percent of global U.S. exports.
Between 2016 and 2017, U.S. exports to Japan increased 7.1 percent, from $63.2
billion in 2016 to $67.7 billion in 2017. Leading U.S. exports to Japan were
civilian aircraft, engines, and parts; liquefied propane; corn; semiconductor
manufacturing machines; and medicaments.
Japan remained the fourth-largest source of U.S. merchandise
imports in 2017, accounting for 5.8 percent of global U.S. imports. The value
of U.S. imports from Japan increased 3.4 percent in 2017, from $132.0 billion
in 2016 to $136.5 billion in 2017. Leading U.S. imports from Japan were
passenger motor vehicles, parts for airplanes or helicopters, motor vehicle
gearboxes, and parts for printers. U.S.-Japan merchandise trade data are shown
in appendix tables A.43–A.46.
In 2017, Japan was once again the United States’
third-largest single-country services trading partner, accounting for 5.8
percent of total U.S. two-way services trade. U.S. cross-border services
exports to Japan increased by $1.9 billion, or 4.2 percent, to $45.4 billion in
2017, while U.S. cross-border services imports from Japan increased by $0.8
billion, or 3.0 percent, to $28.4 billion. As a result, the U.S. surplus in
services trade with Japan grew to $17.1 billion from $16.0 billion the year
before (figure 6.10).
Figure
6.9
U.S. merchandise trade with Japan, 2013–17
Source:
USITC DataWeb/USDOC (accessed April 24, 2018).
Note:
Underlying data can be found in appendix table
B.5
.
Figure
6.10
U.S. cross-border trade in private services
with Japan, 2013–17
Source:
USDOC, BEA, U.S. International Transactions, Services, & IIP, International
Transactions data, tables 1.2 and 1.3, March 21, 2018.
Note:
Data for 2017 are preliminary. Underlying data can be found in appendix table
B.7
.
Economic dialogue between the United States and Japan in
2017 focused on a variety of trade issues, including agricultural trade
developments and the efficiency of the Japanese regulatory review process for
medical devices and pharmaceuticals. According to USTR, one of the
Administration’s top trade policy goals was to resolve Japanese import barriers
for U.S. lamb, beef, horticultural products, and processed foods.
These topics were discussed in a variety of bilateral and
international forums in 2017. In February, President Trump and Japanese Prime
Minister Abe agreed to hold regular bilateral discussions on trade-related
matters, which came to be called the “U.S. -Japan Economic Dialogue.”
Given the U.S. withdrawal from the Trans-Pacific Partnership, both leaders also
agreed to explore how best to accomplish their shared objectives, both
bilaterally and in light of Japan’s continuing efforts to advance progress on
regional economic interests.
In April 2017, Vice President Mike Pence and Deputy Prime Minister Taro Aso
officially started the U.S.-Japan Economic Dialogue in Tokyo and established
“trade and investment issues” as one of its three principal pillars.
(“Macroeconomic and financial policy” and “infrastructure and energy”
cooperation were the other two pillars of the dialogue.)
In October 2017, Vice President Pence and Deputy Prime
Minister Aso met for a second U.S.-Japan Economic Dialogue round, where they
agreed to lift Japanese import restrictions on potatoes from Idaho and to
streamline Japanese noise and emissions testing procedures for U.S. automobile
exports certified under Japan’s Preferential Handling Procedure system.
In that meeting, Japan also agreed to increase transparency in its system for
geographical indications and in its pharma-related reimbursement policies.
In November 2017, President Trump and Prime Minister Abe met again, and
reinforced their commitments to the bilateral trade negotiation process that
had already begun.
The United States and Japan worked together in a variety of
international forums to address common trade issues. For example, at the WTO
ministerial meeting in December 2017, the United States, Japan, and the EU
strengthened their commitment to address overcapacity and other
market-distorting practices of third countries. The United States and Japan
also worked closely together in the Asia-Pacific Economic Cooperation (APEC)
forum to advance common interests on such issues as digital trade.
Agricultural Products
Japan remained an important market for U.S. agricultural
exports in 2017. In that year, U.S. agricultural exports to Japan amounted to
$12.0 billion, making Japan the fourth-largest single-country market for these
goods. Bilateral agriculture trade negotiations focused on a variety of matters
in 2017, including market access issues affecting U.S. rice, beef, and potato
exports to Japan.
In particular, U.S. officials identified some continuing
market access issues connected with U.S. rice exports to Japan in 2017. For
many years, USTR has considered Japan’s importation and distribution system for
rice to be both highly regulated and nontransparent. This is largely due to the
administration of Japan’s 682,200-metric-ton WTO tariff-rate quota (TRQ) on
imported rice through a complex tendering system that is regulated by Japan’s
Ministry of Agriculture, Forestry, and Fisheries (MAFF). Following Japan’s
September 2017 revisions of administrative rules governing the sale, transfer,
and handover of imported rice under its official tendering system, the market
access issues were once again brought to the forefront of negotiations.
According to USTR, the implemented rule changes will prevent Japanese imported
rice from being distributed at prices below a government-imposed threshold
value. Despite the fact that Japan is the United States’ second-largest export
market for rice, only a small share of U.S. exported rice that reaches Japanese
consumers is labeled as U.S. rice.
[667]
U.S. officials have also called attention to increased
Japanese tariffs on frozen beef in 2017. Between April and June of that year,
Japanese duties on frozen beef from the United States increased from 38.5
percent to 50.0 percent ad valorem, following a Japanese safeguard action on
this commodity.
Since 1995, Japan has maintained a safeguard on beef to protect its domestic
industry from import surges. This safeguard is triggered when Japanese beef
import volumes increase by more than 17 percent year-on-year from all trading
partners as well as those from its non-FTA trading partners, including the
United States. As both of these conditions were met in 2017, Japanese import
tariffs increased to 50.0 percent. Nonetheless, in 2017, Japan remained the
largest export market for U.S. beef and beef products on a value basis. In that
year alone, the United States exported 303,762 metric tons of beef to Japan, or
$1.9 billion in value terms.
In 2017, the Japanese government lifted a previously imposed
ban on the importation of chipping potatoes from Idaho.
Chipping potatoes are a particular type of potato whose skin can be easily
rubbed off and whose low sugar content creates a gold coloration when fried
(rendering them attractive to chip manufacturers). Japan stopped importing such
potatoes from Idaho in 2006 after an outbreak of pests of the potato crops,
called pale cyst nematode (PCN), was detected in the southeastern part of the
state.
According to the USDA, its Animal and Plant Health Inspection Service worked
closely with the U.S. potato industry and the Idaho State Department of
Agriculture to eradicate PCN.
As a result, as of September 15, 2017, Japan reopened the market to chipping
potatoes from most Idaho counties (except Bingham and Bonneville, which remain
under quarantine for PCN). The lifting of this restriction represents the
resumption of these exports to Japan after 11 years.
The United States supplies Japan with the vast majority (98
percent) of its imported potatoes. While this will include chipping potatoes
from Idaho beginning in the 2018 agricultural season, Japanese imports of this
commodity will be allowed only for half the year (February to July). According
to USTR, such potato exports are still subject to a number of conditions,
including Japanese restrictions on overland transportation to chipping
facilities away from ports.
Medical Devices and Pharmaceuticals
Japan is a major market for U.S. medical devices and pharmaceutical
products. In 2017, the United States and Japan continued to address
longstanding barriers to U.S. medical device and pharmaceutical exports to
Japan. Some improvements have been made in the speed of Japan’s regulatory
review process for medical devices and pharmaceuticals in recent years. For
example, in 2017, the Japanese government initiated a “conditional early
approval system” for medical devices and pharmaceuticals targeting incurable or
other major diseases. With respect to medical devices, Japan has continued its
efforts to track performance goals to speed up its regulatory approval period
of medical devices, under its “New Collaborative Plan to Accelerated Review of
Medical Devices” program.
However, USTR has also encouraged Japan to improve its goals
on this program by ensuring that quality-focused audits are completed within
standard review periods. With respect to pharmaceuticals, Japan has brought its
approval periods within comparable U.S. and European norms (in some circumstances,
they are even faster). Nonetheless, USTR has continued to encourage Japan to
harmonize its regulatory agencies’ efforts to international standards in
clinical development, multiregional clinical trials, and risk management.
The Republic of Korea (South Korea) continued to be the
United States’ sixth-largest single-country merchandise trading partner in
2017. Two-way merchandise trade was valued at $119.4 billion, up from $112.2
billion in 2016. The share of U.S. trade with South Korea remained unchanged
from previous years, at 3.1 percent of U.S. trade with the world. The United
States recorded a trade deficit of $22.9 billion with South Korea in 2016, a
17.0 percent decrease from the $27.6 billion deficit in 2016, as U.S. exports
to South Korea increased more than U.S. imports from South Korea (figure 6.11).
U.S. merchandise exports to South Korea were valued at $48.3
billion in 2017, increasing 14.1 percent ($6.0 billion) from 2016. Leading U.S.
exports to South Korea were machines for the manufacture of semiconductor
devices or electronic integrated circuits, which jumped to $4.7 billion in 2017
from $1.9 billion in 2016 (a 147.5 percent increase). As in previous years,
other leading U.S. exports to South Korea included civilian aircraft, engines,
and parts, as well as processors or controllers. For the first time, however,
crude petroleum and liquefied propane were among the top U.S. exports to South
Korea (see below). Although U.S. exports of passenger motor vehicles to South
Korea declined slightly to $1.5 billion in 2017 from $1.6 billion in 2016,
exports of all passenger motor vehicles combined are the United States’
fourth-largest export to South Korea.
U.S. exports of beef to South Korea were the fifth-largest U.S. export to South
Korea, with a total value of $1.2 billion in 2017, up 13.9 percent from $1.1
billion in 2016.
South Korea is the second-largest export market for U.S. beef, after Japan,
accounting for approximately 16.9 percent of U.S. exports of beef.
U.S. merchandise imports from South Korea totaled $71.2
billion in 2017, increasing 1.8 percent ($1.3 billion) from 2016. U.S. imports
of passenger motor vehicles, the top import from South Korea, declined to $14.3
billion in 2017, down $1.8 billion (11.0 percent) from 2016.
Other top U.S. imports from South Korea included cellphones, computer parts and
accessories, refined petroleum products, and microchips. U.S.-South Korea
merchandise trade data are shown in appendix tables A.47 through A.50.
In 2017, South Korea became the United States’ 9th-largest
single-country services trading partner in terms of two-way trade, up from
10th-largest in 2016. U.S. cross-border services exports to South Korea
increased 10.0 percent in 2017 to reach a new high of $22.8 billion. U.S.
cross-border services imports from South Korea also increased in 2017, by 7.2
percent, to reach $9.4 billion. Because U.S. services exports increased more
than U.S. services imports, the U.S. services trade surplus with South Korea increased
from $12.0 billion in 2016 to $13.4 billion in 2017, an increase of 12.0
percent (figure 6.12).
Figure
6.11
U.S. merchandise trade with South Korea,
2013–17
Source:
USITC DataWeb/USDOC (accessed April 24, 2018).
Note:
Underlying data can be found in appendix table
B.5
.
Figure
6.12
U.S. cross-border trade in private services
with South Korea, 2013–17
Source:
USDOC, BEA, U.S. International Transactions, Services, & IIP, International
Transactions data, tables 1.2 and 1.3, March 21, 2018.
Note:
Data for 2017 are preliminary. Underlying data can be found in appendix table
B.7
.
In 2017, U.S. trade relations with South Korea occurred
within the framework of the U.S.-Korea Free Trade Agreement (KORUS FTA or
KORUS), as discussed below and in chapter 5. In June 2017, President Trump
hosted President Moon Jae-in in Washington, DC, and in November 2017, President
Trump traveled to South Korea for his third bilateral meeting with President
Moon.
Other trade developments included the WTO dispute regarding U.S. antidumping
measures on certain oil country tubular goods from South Korea, in which the
panel report was circulated on November 14, 2017.
In the dispute regarding U.S. antidumping and countervailing duty measures on
large residential washers from South Korea, the award of the arbitrator was
circulated on April 13, 2017.
U.S-Korea FTA
In 2017, the sixth round of tariff reductions under KORUS
was implemented.
As outlined in KORUS, as of March 2017, U.S. law firms are allowed to form
joint-venture law firms in South Korea and employ Korean-licensed lawyers.
Also as of March 2017, U.S. accounting firms are allowed to purchase less than
a 50 percent share of Korean accounting firms.
On July 12, 2017, USTR Lighthizer formally notified South
Korea that the United States was calling for a special session of the KORUS
Joint Committee to discuss possible amendments and modifications to KORUS.
This special session, which was held on August 22, 2017, in South Korea, was
the first special session held under KORUS.
The first special session was a daylong meeting that was attended by USTR
Lighthizer via teleconference.
The second special session took place on October 4, 2017, in Washington, DC,
and was co-chaired by Ambassador Lighthizer and Korean Trade Minister
Hyun-chong Kim.
Following that meeting, Korea began the procedures required to begin discussions
to amend the agreement.
These procedures were completed in December 2017, when it was announced that
negotiations on amendments and modifications to KORUS would begin on January 5,
2018.
For more information, please see chapter 5.
Oil-related Exports
In 2017, U.S. exports of oil and gas products increased
significantly, with South Korea becoming a major importer of these products.
U.S. exports of crude petroleum to South Korea became the United States’
fourth-largest export to South Korea, reaching $1.1 billion in 2017, up from
$181 million in 2016. At the same time, South Korea became the fifth-largest
importer of U.S. crude petroleum—after Canada, China, the UK, and the
Netherlands—purchasing 5.1 percent of these U.S. exports. Liquefied propane
exports to South Korea have also increased steadily in recent years, rising
from $227 million in 2015, to $556 million in 2016 and reaching $947 million in
2017 to become the fifth-largest U.S. export to South Korea. South Korea has
become the fourth-largest importer of U.S. liquefied propane—after Japan,
Mexico, and China—purchasing 7.8 percent of these U.S. exports. Additionally,
U.S. exports of natural gas to South Korea reached $596 million in 2017, up
from $22 million in 2016. South Korea became the second-largest importer of
U.S. liquefied natural gas after Mexico, purchasing 17.2 percent of total U.S.
exports.
[691]
The increase in U.S. exports of these products to South
Korea in 2017 resulted from a number of factors. These included a decline in
output from the Organization of the Petroleum Exporting Countries (OPEC) and
Russia in 2017; South Korea’s lack of domestic production, leading to an
ongoing demand for imports; the removal of U.S. restrictions on exports of
crude petroleum; and favorable spot pricing for U.S. products relative to other
suppliers.
[692]
In addition, U.S. facilities for exporting these products have recently
expanded or come online, allowing for an increase in U.S. exports to distant
destinations.
[693]
Finally, the government of South Korea has encouraged diversification of the
oil supply, providing Korean firms with tax rebates on transport costs for
purchases of crude produced outside of the Middle East.
[694]
In 2017, India was the United States’ ninth-largest
single-country trading partner based on two-way merchandise trade, a position
it has maintained since 2016. U.S. two-way merchandise trade with India
increased by 9.8 percent to $74.3 billion in 2017. At the same time, India’s
share of total U.S. merchandise trade with the world for 2017 was the same as
2016—1.9 percent. U.S. exports to India rose significantly in 2017, shrinking
the U.S. merchandise trade deficit with India by 5.9 percent to $22.9 billion
in 2017 (figure 6.13).
U.S. merchandise exports to India increased 18.7 percent
from $21.7 billion in 2016 to $25.7 billion in 2017. Leading U.S. exports to
India in 2017 were nonindustrial diamonds; nonmonetary gold; civilian aircraft,
engines, and parts; bituminous coal; and almonds. While U.S. exports of nonindustrial
diamonds (the leading U.S. export) decreased by $693 million (or 14.4 percent)
in 2017, most other U.S. exports increased.
U.S. merchandise imports from India increased by 5.6 percent
in 2017 to $48.6 billion. Leading U.S. imports from India in 2017 were
nonindustrial diamonds,
certain medicaments, frozen shrimp, light oils, and gold jewelry. U.S.-India
merchandise trade data are shown in appendix tables A.51 through A.54.
India is the United States’ seventh-largest single-country
services trading partner, based on two-way cross-border services trade, with
total services trade increasing 11.6 percent to $51.3 billion in 2017. India is
one of only two of the top 20 services trading partners with which the United
States had a services trade deficit in 2017 (the other was Italy).
While this trade deficit decreased in 2015 and 2016, it increased 5.3 percent
to $5.8 billion in 2017 (figure 6.14).
Figure
6.13
U.S. merchandise trade with India, 2013–17
Source:
USITC DataWeb/USDOC (accessed April 24, 2018).
Note:
Underlying data can be found in appendix table
B.5
.
Figure
6.14
U.S. cross-border trade in private services
with India, 2013–17
Source:
USDOC, BEA, U.S. International Transactions, Services, & IIP, International
Transactions data, tables 1.2 and 1.3, March 21, 2018.
Note:
Data for 2017 are preliminary. Underlying data can be found in appendix table
B.7
.
There were several active WTO dispute settlement proceedings
involving the United States and India in 2017. In March 2017, the Dispute
Settlement Body (DSB) established a panel in response to a request from India
in a case alleging imposition of domestic-content requirements in the renewable
energy sector by several U.S. states.
In May, the DSB established a compliance panel in response to a request by
India in a case concerning prohibitions by India on the importation of various
U.S. agricultural products because of concerns related to avian influenza.
India claims that it has complied with DSB rulings following arbitration
proceedings in 2016.
In December, in a case regarding certain measures that India has taken relating
to solar cells and solar modules, the United States requested authorization to
suspend concessions or obligations with respect to India, arguing that India
failed to comply with the DSB’s rulings and recommendations issued in 2016.
For more information on WTO dispute settlement cases, see chapter 3.
In 2017, the United States and India continued dialogue on
improving bilateral trade and investment, including the protection of IPRs and
manufactured goods exports. These are discussed in detail below.
India and U.S. Trade Policy Forum
On October 26, 2017, USTR Robert Lighthizer, and India’s
Minister of Commerce and Industry, Sri Suresh Prabhu, met in Washington, DC for
the 11th ministerial-level meeting of the India and United States Trade Policy
Forum (TPF). This meeting covered several topics, including non-science-based
barriers on agricultural trade, regulatory and technical barriers to trade in
technology and other products, market access for services, barriers to U.S.
exports of manufactured goods (including medical devices), high tariffs in
certain industrial and agricultural sectors, and IPRs.
Regarding digital trade, the United States expressed concern over India’s data
localization requirements.
According to USTR, the TPF “yielded limited progress” on U.S. areas of concern.
Intellectual Property
India remained on USTR’s Priority Watch List in the
2017
Special 301 Report
due to continuing concerns regarding weak protection
and enforcement of IPRs.
Of concern are patentability issues; inadequate trade secret protection; the
production, domestic distribution, and export of counterfeit pharmaceuticals;
and digital piracy. Patent issues that were noted as being particularly
burdensome for U.S. firms include an opposition procedure that allows any third
party to oppose a patent application, long wait times to receive patents, and
onerous reporting requirements.
The report also notes that products in the pharmaceutical and agricultural
chemicals sector are susceptible to the unfair commercial use of data generated
during the market approval process that are supposed to be protected from
disclosure.
USTR’s
2017 Out-of-Cycle Review of Notorious Markets
Report
highlighted several markets of concern in India, including markets
for counterfeit apparel and footwear, pirated media, and counterfeit and
illegal pharmaceuticals.
In 2017, Taiwan became the United States’ 11th-largest
single-country trading partner, dropping from its position as 10th largest in
2016. U.S. two-way merchandise trade with Taiwan grew 4.5 percent to $68.2
billion in 2017 from $65.2 billion in 2016, continuing to account for 1.8
percent of total merchandise trade with the world. The U.S. merchandise trade deficit
with Taiwan widened 26.7 percent to $16.7 billion in 2017, as U.S. imports rose
$3.2 billion while U.S. exports fell $0.3 billion (figure 6.15).
U.S. merchandise exports to Taiwan decreased from $26.0
billion in 2016 to $25.8 billion in 2017, a 1.1 percent fall. The top U.S.
exports to Taiwan during the year were civilian aircraft, engines and parts;
machines for semiconductor or integrated circuit manufacturing; processors or
controllers; computer memories; and machines for semiconductor boules or wafer
manufacturing. The top three U.S. exports all declined in 2017 and were
primarily responsible for the overall decline in U.S. exports to Taiwan.
U.S. merchandise imports from Taiwan increased from $39.2
billion in 2016 to $42.5 billion in 2017, an 8.3 percent rise. The top U.S.
imports from Taiwan in 2017 were microchips; telecommunications equipment;
processors or controllers; computer parts and accessories; and portable
computers and tablets. U.S.-Taiwan merchandise trade data are shown in appendix
tables A.55 through A.58.
From 2016 to 2017, total U.S.-Taiwan two-way services trade
fell 8.8 percent from $18.9 billion to $17.2 billion, accounting for 1.4
percent of all U.S. cross-border services trade in 2017. U.S. services exports
to Taiwan fell by 18.4 percent to $9.2 billion, while imports rose 5.5 percent
to $8.1 billion. These trends resulted in a sharp 68.6 percent decrease in the
U.S. services trade surplus, from $3.6 billion in 2016 to $1.1 billion in 2017
(figure 6.16).
Figure
6.15
U.S. merchandise trade with Taiwan, 2013–17
Source:
USITC DataWeb/USDOC (accessed April 24, 2018).
Note:
Underlying data can be found in appendix table
B.5
.
Figure
6.16
U.S. cross-border trade in private services
with Taiwan, 2013–17
Source:
USDOC, BEA, U.S. International Transactions, Services, & IIP, International
Transactions data, tables 1.2 and 1.3, March 21, 2018.
Note:
Data for 2017 are preliminary. Underlying data can be found in appendix table
B.7
.
The primary forum for bilateral discussions on trade and
investment issues is the U.S.-Taiwan Trade and Investment Framework Agreement
(TIFA).
In 2017, while there was no TIFA Council meeting, the U.S.-Taiwan trade
relationship continued under the TIFA framework as well as through
congressional and department-level exchanges. The key issues under discussion
were IPRs, market access for medical devices and pharmaceuticals, agriculture,
investment issues, and technical barriers in industries such as chemicals,
cosmetics, and consumer products.
U.S.-Taiwan TIFA
The most recent bilateral TIFA meeting was in October 2016,
where participants discussed IPRs, agriculture, medical devices, and
pharmaceuticals. In July 2017, under the auspices of the American Institute in
Taiwan (AIT) and the Taipei Economic and Cultural Representative Office in the
United States (TECRO), the two governments held follow-up meetings to the
October 2016 TIFA meetings in order to assess progress that had been made on
these issues.
Also, during July 2017, the two sides held the Second
Medical Devices Time-to-Market Dialogue and the Transparency and Procedural
Fairness Dialogue.
The first iterations of each of these two dialogues were held during the 2016
TIFA meetings.
There are three primary issues under discussion in the
Medical Devices Time-to-Market Dialogue involving product license approvals and
pricing review mechanisms. First, the Taiwan Food and Drug Administration
requires facilities that manufacture medical devices sold in Taiwan, regardless
of their location, to reapply for registration every three years. While the
renewal process can be expedited, the documentation required restricts the
availability of this option for U.S. companies to only a fraction of U.S.
manufacturers.
Second, Taiwan’s National Health Insurance Administration
(NHIA) causes delays in market availability for devices whose costs to the
patient are not covered by them in full. NHIA must issue a self-pay code for
these devices, which is only issued after a review of up to two months, which
delays patient access to new U.S. devices.
Finally, NHIA has also instituted ceilings on how much a
patient can self-pay on high-end devices or new items. There is little
methodological transparency in how the ceilings are set.
The Transparency and Procedural Fairness Dialogue focuses on
improving transparency and procedural fairness in trade and investment matters.
For example, the United States seeks increased transparency in Taiwan’s
investment review process.
Taiwan limits, and sometimes prohibits, investment in certain sectors, causing
lengthy and redundant review processes.
Intellectual Property Rights
IPRs remained a prominent issue during bilateral discussions
in 2017. On February 22, 2017, AIT and TECRO signed a memorandum of
understanding to combat IP infringement and trade fraud crimes.
The memorandum of understanding will facilitate cooperation between national
authorities from each country to investigate IPR violations and trade fraud and
share best practices and information.
The United States continues to share its views on amendments
to Taiwan’s Copyright Act, which were approved by the Executive Yuan in October
2017 and are currently under review by the Legislative Yuan.
Some of the key IPR issues with the Copyright Act that remain points of concern
for the United States are digital copyright protection and enforcement,
licensing, the role of collective management organizations, fair use
exceptions, and the use of copyrighted teaching materials.
Agriculture
Although Taiwan remains the seventh-largest export market
for U.S. agricultural goods,
the United States continues to see some of Taiwan’s agricultural policies as
concerning.
Taiwan notified the World Trade Organization of its intent to implement a
maximum residue limit on ractopamine in U.S. pork and some beef products in
2007, but it has not yet implemented one.
In the absence of a maximum residue limit, the subject U.S. pork and beef
products cannot be imported into Taiwan.
Taiwan also has barriers to U.S. beef offal products.
Taiwan’s biennial Agricultural Trade Goodwill Mission took
place in September 2017, led by the deputy minister of agriculture for Taiwan.
The mission included a signing ceremony for three letters of intent to buy
nearly $3 billion in U.S. soybeans, wheat, and grains.
Also in September 2017, U.S. Congressman Steve Daines led a mission to Taiwan,
where he met with President Tsai Ing-wen and Secretary General Joseph Wu
regarding expanding export markets.
Bibliography
Adduci, Mastriani
& Schaumberg. “8th U.S.-EU Small and Medium Enterprise (SME) Workshop,
Wichita State University Innovation Campus, Wichita, Kansas, Thursday, October
19, 2017, Draft Agenda.”
http://www.adduci.com/sites/default/files/INVITATION_AGENDA2017%20US-EU.pdf
.
Agence
France-Presse
.
“US Claims
Victory in Food Trade Dispute with Indonesia over Import Restrictions on Meat,
Fruits and Vegetables.” Coconuts Jakarta, November 10, 2017.
https://coconuts.co/jakarta/news/us-claims-victory-indonesia-food-trade-dispute-import-restrictions-meat-fruits-vegetables/
.
Airbus S.A.S.
“Airbus and Bombardier Announce C Series Partnership.” News release, October
16, 2017.
http://www.airbus.com/newsroom/press-releases/en/2017/10/airbus-bombardier-cseries-agreement.html
.
American
Institute in Taiwan (AIT). “AIT and TECRO Sign Memorandum of Understanding to
Strengthen Intellectual Property Rights Enforcement Cooperation.” Press
release, March 22, 2017.
https://www.ait.org.tw/ait-tecro-sign-memorandum-understanding-strengthen-intellectual-property-rights-enforcement-cooperation/
.
Asia-Pacific
Economic Cooperation (APEC).
2017
Leaders’ Declaration
, November 11, 2017.
https://www.apec.org/Meeting-Papers/Leaders-Declarations/2017/2017_aelm
.
Asia-Pacific
Economic Cooperation (APEC).
2016
Committee on Trade and Investment Annual
Report to Ministers
, November 2017.
https://www.apec.org/Publications/2017/11/CTI-Annual-Report-2017
.
Asia-Pacific
Economic Cooperation (APEC). “About APEC.”
https://www.apec.org/About-Us/About-APEC
(accessed March 19, 2018).
Asia-Pacific
Economic Cooperation (APEC). “APEC Initiative of Cooperation to Promote
Internet Economy,” 2014.
http://mddb.apec.org/Documents/2014/MM/AMM/14_amm_jms_anxf.pdf
.
Asia-Pacific
Economic Cooperation (APEC). “Events: 2017.”
https://www.apec.org/Events-Calendar?SelectedYear=2017&SelectedMonth=-1&SelectedGroup=all
(accessed March 19, 2018).
Asia-Pacific
Economic Cooperation (APEC).
Facilitating
Digital Trade for Inclusive Growth: Key Issues in Promoting Digital Trade in
APEC
, April 2017.
https://www.apec.org/Publications/2017/04/Facilitating-Digital-Trade-for-Inclusive-Growth-Key-Issues-in-Promoting-Digital-Trade-in-APEC
.
Asia-Pacific
Economic Cooperation (APEC). “How APEC Operates.”
https://www.apec.org/About-Us/How-APEC-Operates
(accessed March 19, 2018).
Asia-Pacific
Economic Cooperation (APEC). “Member Economies.”
https://www.apec.org/About-Us/About-APEC/Member-Economies.aspx
(accessed March 19, 2018).
Asia-Pacific
Economic Cooperation (APEC).
Promoting
E-Commerce to Globalize MSMEs
, November 2017.
https://www.apec.org/Publications/2017/11/Promoting-E-commerce-to-Globalize-MSMEs
.
Asia-Pacific
Economic Cooperation (APEC). “Updates by the Ad Hoc Steering Group on the
Internet Economy to APEC Senior Officials,” August 27–28, 2016.
http://mddb.apec.org/Documents/2016/SOM/SOM3/16_som3_013.pdf
.
Asia-Pacific
Economic Cooperation (APEC) Viet Nam 2017. “APEC 2017: Priorities.”
https://www.apec2017.vn/ap17-c/page/priorities
(accessed March 19, 2018).
Asia-Pacific
Economic Cooperation (APEC).
Work Plan
for Advancing “Facilitating Digital Trade for Inclusive Growth” As a Potential
Next Generation Trade and Investment Issue
, September 5–6, 2015.
http://mddb.apec.org/Documents/2015/SOM/SOM3/15_som3_021anx03.pdf
.
Bundesministerium für Wirtschaft und Energie (Federal
Ministry for Economic Affairs and Energy). “Factsheet—‘Global Forum on Steel
Excess Capacity,’” November 30, 2017.
https://www.bmwi.de/Redaktion/EN/Downloads/factsheet-global-forum-on-steel-excess-capacity.pdf?__blob=publicationFile
.
Castano Freeman,
Ivan. “Haiti Garment Industry Says Union Wage Claims Unrealistic.”
Just-style.com, August 3, 2017.
https://www.just-style.com/analysis/haiti-garment-industry-says-union-wage-claims-unrealistic-update_id131327.aspx
.
Commission for
Environmental Cooperation (CEC). “24th Regular Session of the CEC Council and
Meeting of the Joint Public Advisory Committee (JPAC).”
http://www.cec.org/news-and-outreach/events/24th-regular-session-cec-council-and-meeting-joint-public-advisory-committee-jpac
(accessed June 7, 2018).
Commission for
Environmental Cooperation (CEC). “About Submission on Enforcement Matters.”
http://www.cec.org/about-us/public-engagement-and-transparency/about-submissions-enforcement-matters
(accessed April 5, 2018).
Commission for
Environmental Cooperation (CEC). “About the CEC.”
http://www.cec.org/about-us/about-cec
(accessed April 5, 2018).
Commission for
Environmental Cooperation (CEC). “New Trilateral Environmental Initiatives
Announced by Commission for Environmental Cooperation (CEC).”
http://www.cec.org/news-and-outreach/press-releases/new-trilateral-environmental-initiatives-announced-commission-environmental-cooperation-cec
(accessed April 10, 2018).
Commission for
Environmental Cooperation (CEC). “North American Agreement on Environmental
Cooperation,”
http://www.cec.org/about-us/NAAEC
(accessed April 5, 2018).
Commission for
Environmental Cooperation (CEC).
Operational
Plan 2017–2018
, June 28, 2018.
http://www.cec.org/about-us/operational-plans/operational-plan-17-18
.
Commission for
Environmental Cooperation (CEC). Submission on Enforcement Matters Compliance
Tracker. “Active Submissions.”
http://www4.cec.org/sem-tracker/tracker.html
(accessed April 9, 2018).
Congressional
Research Service (CRS).
Free Trade
Agreements: Impact on U.S. Trade and Implications for U.S. Trade Policy
, by
William H. Cooper. CRS Report RL31356, February 26, 2014.
https://digitalcommons.ilr.cornell.edu/cgi/viewcontent.cgi?article=2252&context=key_workplace
.
Congressional
Research Service (CRS).
Overview of Labor
Enforcement Issues in Free Trade Agreements
, by Mary Jane Bolle. CRS Report
RS22823, February 22, 2016.
https://fas.org/sgp/crs/misc/RS22823.pdf
.
Congressional
Research Service (CRS).
Softwood Lumber
Imports from Canada: Current Issues
, by Katie Hoover and Ian F. Fergusson.
CRS Report R42789, April 12, 2018.
https://fas.org/sgp/crs/misc/R42789.pdf
.
Congressional
Research Service (CRS).
Trade Adjustment
Assistance for Firms
, by Rachel F. Fefer. CRS Report RS20210, August 30,
2017.
https://fas.org/sgp/crs/misc/RS20210.pdf
.
Congressional
Research Service (CRS).
Trade Adjustment
Assistance for Workers and the TAA Reauthorization Act of 2015,
by Benjamin
Collins. CRS Report R44153, September 14, 2016.
https://fas.org/sgp/crs/misc/R44153.pdf
.
Congressional
Research Service (CRS).
Trade in Services
Agreement (TiSA) Negotiations: Overview and Issues for Congress
, by Rachel
F. Fefer. CRS Report R44354, January 3, 2017.
https://fas.org/sgp/crs/misc/R44354.pdf
.
Congressional
Research Service (CRS).
U.S.
International Investment Agreements: Issues for Congress
, by Shayerah Ilias
Akhtar and Martin A. Weiss. CRS Report R43052, April 29, 2013.
https://fas.org/sgp/crs/row/R43052.pdf
.
Congressional
Research Service (CRS).
U.S. Trade in
Services: Trends and Policy Issues
, by Rachel F. Fefer. CRS Report R43291,
January 26, 2018.
https://fas.org/sgp/crs/misc/R43291.pdf
.
Congressional
Research Service (CRS).
U.S. Trade with
Free Trade Agreement (FTA) Partners
, by James K. Jackson. CRS Report
R44044, April 23, 2018.
https://fas.org/sgp/crs/misc/R44044.pdf
.
Convention on
International Trade in Endangered Species of Wild Fauna and Flora (CITES).
“Persistence Pays Off––Singapore Authorities’ Successful Prosecutions Against
Wildlife Crime Recognized by CITES Secretary-General Certificate of
Commendation.” Press release, July 22, 2017.
https://cites.org/sites/default/files/eng/com/sc/69/sum/E-SC69-SR.pdf
.
Convention on
International Trade in Endangered Species of Wild Fauna and Flora (CITES).
Convention on International Trade in
Endangered Species of Wild Fauna and Flora (CITES): Sixty-ninth Meeting of the
Standing Committee; Summary Record. Geneva (Switzerland), 27 November–1
December 2017
. CITES, SC69 SR Rev. 1, December 12, 2017.
https://cites.org/sites/default/files/eng/com/sc/69/sum/E-SC69-SR.pdf
.
Council of
Economic Advisers (CEA).
Economic Report
of the President: Together with the Annual Report of the Council of Economic
Advisors
, February 2018.
https://www.whitehouse.gov/wp-content/uploads/2018/02/ERP_2018_Final-FINAL.pdf
.
DR-CAFTA.
See
Tratado de Libre Comercio entre la
República Dominicana, Centroamérica y Estados Unidos (DR-CAFTA).
EIA.
See
U.S. Energy Information
Administration (EIA).
European
Commission (EC). “EU-US Agreement on Insurance and Reinsurance.” Fact sheet,
September 22, 2017.
http://europa.eu/rapid/press-release_MEMO-17-3426_en.htm?locale=en
.
European
Commission (EC). “EU-U.S. Privacy Shield: First Review Shows It Works but
Implementation Can Be Improved.” Press release, October 18, 2017.
http://europa.eu/rapid/press-release_IP-17-3966_en.htm
.
European
Commission (EC). “First Annual Review of the EU-U.S. Privacy Shield.” Fact
sheet, October 18, 2017.
http://europa.eu/rapid/press-release_MEMO-17-3967_en.htm
.
European
Commission (EC).
Report from the
Commission to the European Parliament and the Council on the First Annual
Review of the Functioning of the EU-U.S. Privacy Shield
. Staff working
document SWD (2017) 344 Final, October 18, 2017.
http://ec.europa.eu/newsroom/document.cfm?doc_id=47798
.
European
Commission (EC). “Solvency II Overview—Frequently Asked Questions.” Fact sheet,
January 12, 2015.
http://europa.eu/rapid/press-release_MEMO-15-3120_en.htm
.
European
Medicines Agency (EMA). “EU-US Mutual Recognition of Inspections of Medicines
Manufacturers Enters Operational Phase.” Press release, October 31, 2017.
http://www.ema.europa.eu/ema/index.jsp?curl=pages/news_and_events/news/2017/10/news_detail_002842.jsp&mid=WC0b01ac058004d5c1
.
Executive Office
of the President. “Addressing China's Laws, Policies, Practices, and Actions
Related to Intellectual Property, Innovation, and Technology.”
Federal Register
, August 14, 2017.
https://www.federalregister.gov/documents/2017/08/17/2017-17528/addressing-chinas-laws-policies-practices-and-actions-related-to-intellectual-property-innovation
.
Federal Reserve
System. “Foreign Exchange Rates—H.10,” n.d.
https://www.federalreserve.gov/datadownload/Choose.aspx?rel=H10
(accessed March 26, 2018).
Federal Reserve
System. “Foreign Exchange Rates—H.10: Historical Rates for the UK Pound*.” June
18, 2018.
https://www.federalreserve.gov/releases/h10/hist/dat00_uk.htm
.
Federal Reserve
System. “Real Trade Weighted U.S. Dollar Index: Broad,” n.d.
https://fred.stlouisfed.org/series/TWEXBPA
(accessed March 30, 2018).
Federal Trade
Commission (FTC). “FTC Gives Final Approval to Settlements with Companies That
Falsely Claimed Participation in Privacy Shield.” Press release, November 29,
2017.
https://www.ftc.gov/news-events/press-releases/2017/11/ftc-gives-final-approval-settlements-companies-falsely-claimed
.
Federal Trade
Commission (FTC). “Statement of Acting FTC Chairman Maureen K. Ohlhausen on
First Annual Review of EU-U.S.-Privacy Shield.” Press release, October 18,
2017.
https://www.ftc.gov/news-events/press-releases/2017/10/statement-acting-ftc-chairman-maureen-k-ohlhausen-first-annual
.
Food and Drug
Administration (FDA). “FDA takes Unprecedented Step toward More Efficient
Global Pharmaceutical Manufacturing Inspections.” News release, October 31,
2017.
https://www.fda.gov/NewsEvents/Newsroom/PressAnnouncements/ucm583057.htm
.
Food and Drug
Administration (FDA). “Mutual Recognition Promises New Framework for
Pharmaceutical Inspections for United States and European Union.” News release,
March 2, 2017.
https://www.fda.gov/NewsEvents/Newsroom/PressAnnouncements/ucm544357.htm
.
Friedman, Diana,
and Grace Kenneally. “U.S. Crude Petroleum Exports Expand to Asia.” Executive
Briefings on Trade, U.S. International Trade Commission, January 2018.
https://www.usitc.gov/sites/default/files/publications/332/executive_briefings/us_crude_exports_expand_to_asia_final.pdf
.
GAO.
See
U.S. Government Accountability
Office (GAO).
Goodman, Matthew
P., Michael J. Green, and Nicholas Szechenyi. “What to Expect from the
U.S.-Japan Economic Dialogue.” Center for Strategic and International Studies
(CSIS), April 14, 2017.
https://www.csis.org/analysis/what-expect-us-japan-economic-dialogue
.
Government of
Australia. Department of Foreign Affairs and Trade (DFAT). “Australia-United
States FTA: AUSFTA Joint Committee Meeting,” December 7, 2017.
http://dfat.gov.au/trade/agreements/in-force/ausfta/Pages/australia-united-states-fta.aspx
.
Government of
Australia. Department of Foreign Affairs and Trade (DFAT). “Trade in Services
Agreement––News,” n.d.
http://dfat.gov.au/trade/agreements/trade-in-services-agreement/news/Pages/news.aspx
(accessed March 23, 2018).
Government of
Burma (Myanmar). Directorate of Investment and Company Administration (DICA).
“U.S.-Myanmar TIFA Planning Meeting,” July 14, 2017.
https://dica.gov.mm/en/news/us-myanmar-tifa-planning-meeting
.
Government of
Canada. “Bombardier Contribution: Backgrounder.” Fact sheet, February 7, 2017.
https://www.canada.ca/en/innovation-science-economic-development/news/2017/02/bombardier_contribution.html?_ga=2.244267526.2030191289.1525301285-2310
.
Government of
Canada. Global Affairs Canada. “Address by the Minister of Foreign Affairs at
Round Seven of Negotiations on the Modernization of the North American Free
Trade Agreement (NAFTA).” News release, March 5, 2018.
https://www.canada.ca/en/global-affairs/news/2018/03/address-by-the-minister-of-foreign-affairs-at-round-seven-of-negotiations-on-the-modernization-of-the-north-american-free-trade-agreement-nafta.html
.
Government of
Canada. Global Affairs Canada. “Canada Requests WTO Consultations on U.S.
Duties on Canadian Softwood Lumber.” Press release, November 28, 2017.
https://www.canada.ca/en/global-affairs/news/2017/11/canada_requests_wtoconsultationsonusdutiesagainstcanadiansoftwoo.html
.
Government of
Canada. Global Affairs Canada. “Statement by Canada on U.S. Duties on Canadian
Softwood Lumber.” Press release, November 2, 2017.
https://www.canada.ca/en/global-affairs/news/2017/11/statement_by_canadaonusdutiesoncanadiansoftwoodlumber.html
.
Government of
Canada. Global Affairs Canada. “Statement by Canada on U.S. International Trade
Commission Vote on Duties on Canadian Softwood Lumber.” Press release, December
7, 2017.
https://www.canada.ca/en/global-affairs/news/2017/12/statement_by_canadaonusinternationaltradecommissionvoteondutieso.html
.
Government of
Canada. Global Affairs Canada. “Statement by Minister of Foreign Affairs on
Bombardier C Series Aircraft.” Press release, January 26, 2018.
https://www.canada.ca/en/global-affairs/news/2018/01/statement_by_ministerofforeignaffairsonusinternationaltradecommi.html
.
Government of
Canada. Global Affairs Canada. “Statement by the Minister of Foreign Affairs on
Final U.S. Duties on Canadian Softwood Lumber.” Press release, January 3, 2018.
https://www.canada.ca/en/global-affairs/news/2018/01/statement_by_theministerofforeignaffairsonfinalusdutiesoncanadia.html
.
Government of
Canada. Global Affairs Canada. “WTO Environmental Goods Agreement (EGA),”
modified December 14, 2016.
http://www.international.gc.ca/trade-agreements-accords-commerciaux/topics-domaines/env/plurilateral.aspx?lang=eng
.
Government of
Canada. Treasury Board of Canada Secretariat (TBS). “Learn More about
Regulatory Cooperation––Canada’s Regulatory Cooperation Activities––Canada-U.S.
Regulatory Cooperation Council,” modified February 21, 2018.
https://www.canada.ca/en/treasury-board-secretariat/services/regulatory-cooperation/learn-about-regulatory-cooperation.html
.
Government of
Mexico. Secretaría de Economía (Ministry of the Economy). “Concluye la Sexta
Ronda de Negociaciones para la Modernización del TLCAN.” [The sixth round of
NAFTA negotiations concludes].
News
release, January 29, 2018.
https://www.gob.mx/se/prensa/concluye-la-sexta-ronda-de-negociaciones-para-la-modernizacion-del-tlcan
.
Government of
Morocco. Ministry of Culture and Communication. Department of Communication.
“Morocco-USA Joint Committee in Charge of Following Up FTA Meets in
Washington.” News release, October 19, 2017.
http://www.maroc.ma/en/news/morocco-usa-joint-committee-charge-following-fta-meets-washington
.
Government of New
Zealand. Ministry of Foreign Affairs and Trade (MFAT). “Trade in Services
Agreement (TiSA).”
https://www.mfat.govt.nz/en/trade/free-trade-agreements/agreements-under-negotiation/tisa/
(accessed March 23, 2018).
Government of
South Korea. Ministry of Trade, Industry, and Energy (MOTIE). “2nd Special
Session of KORUS FTA Joint Committee Held in Washington, DC.” Press release,
October 5, 2017.
http://english.motie.go.kr/en/pc/pressreleases/bbs/bbsView.do?bbs_seq_n=593&bbs_cd_n=2¤tPage=41&search_key_n=&search_val_v=&cate_n
.
Government of
South Korea. Ministry of Trade, Industry, and Energy (MOTIE). “Korea, U.S. Host
4th KORUS FTA Joint Committee Meeting in Seoul.” Press release, January 31,
2017.
http://english.motie.go.kr/en/pc/pressreleases/bbs/bbsView.do?bbs_cd_n=2&bbs_seq_n=494
.
Government of
South Korea. Ministry of Trade, Industry, and Energy (MOTIE). “Korean, US Trade
Ministers Meet in Washington, DC.” Press release, September 20, 2017.
http://english.motie.go.kr/en/pc/pressreleases/bbs/bbsView.do?bbs_cd_n=2&bbs_seq_n=586
.
Government of
South Korea. Ministry of Trade, Industry, and Energy (MOTIE). “Letter from
Minister of Trade, Industry and Energy Hyun Chong Kim to Ambassador Robert E.
Lighthizer.” September 21, 2017.
https://insidetrade.com/sites/insidetrade.com/files/documents/sep2017/wto09212017_KORUS_FTA_Letter.pdf
.
Harper, Gregg,
Gerald E. Connolly, Mario Diaz-Balart, and Albio Sires. “Congressional Taiwan
Caucus Co-chairs Release Statement on the 106th National Day of Taiwan.” Press
release, October 3, 2017.
https://harper.house.gov/congressional-taiwan-caucus-co-chairs-release-statement-on-the-106th-national-day-of-taiwan/
.
Hasselback, Drew.
“IMF Predicts Canada Will Pass the U.S. to Top G7 Growth This Year.”
Financial Post
(Toronto), July 24, 2017.
http://business.financialpost.com/news/economy/imf-predicts-canada-will-pass-the-u-s-to-top-g7-growth-this-year
.
International
Centre for Trade and Sustainable Development (ICTSD).
Advancing Multilateral Trade Negotiations on Fisheries Subsidies
.
Policy brief, March 2018.
https://www.ictsd.org/sites/default/files/event/fisheries_subsidies_negotiations-ictsd_policy_brief_2018.pdf
.
International
Monetary Fund (IMF).
World Economic
Outlook, October 2017—Seeking Sustainable Growth: Short-Term Recovery,
Long-Term Challenges
, October 2017.
https://www.imf.org/en/Publications/WEO/Issues/2017/09/19/world-economic-outlook-october-2017
.
International
Monetary Fund (IMF).
World Economic
Outlook Update––Brighter Prospects, Optimistic Markets, Challenges Ahead
,
January 22, 2018.
http://www.imf.org/~/media/Files/Publications/WEO/2018/Update/January/0118.ashx
.
J.P. Morgan.
“Dollar Declines as Global Growth Takes Off,” February 8, 2018.
https://commercial.jpmorganchase.com/pages/commercial-banking/executive-connect/fx-dollar-declines
(accessed June 28, 2018).
Maghreb Times
. “
New
Algeria-US Discussions on TIFA April 24 in Algiers
,” April 20,
2017.
https://themaghrebtimes.com/04/20/new-algeria-us-discussions-on-tifa-april-24-in-algiers/
.
Mcfarlane, Cody.
“Chile: Chilean Labour Reform Now In Force.” Harris Gómez Group newsletter in
Mondaq, April 13, 2017.
http://www.mondaq.com/x/585726/employee+rights+labour+relations/Chilean+Labour+Reform+Now+In+Force
.
Morgan Stanley,
“Gauging the U.S. Dollar Drop,” n.d.
https://www.morganstanley.com/spc/knowledge/managing-wealth/research/gauging-the-u-s-dollardrop/
(accessed June 28, 2018).
NAFTA
Secretariat. “Overview of the Dispute Settlement Provisions.”
https://www.nafta-sec-alena.org/Home/Dispute-Settlement/Overview-of-the-Dispute-Settlement-Provisions
(accessed April 9, 2018).
NAFTA
Secretariat. “Status Report of Panel Proceedings—Chapter 19 Active Cases.”
https://www.nafta-sec-alena.org/Home/Dispute-Settlement/Status-Report-of-Panel-Proceedings
(accessed April 9, 2018).
North American
Development Bank (NADB). “About Us: Origins.”
http://www.nadbank.org/~nadborg/index.php?acc=contest&tpl=origins
(accessed April 10, 2018).
North American
Development Bank (NADB). “Summary of Project Implementation Activities: Active
Projects,” December 31, 2017.
http://www.nadb.org/pdfs/FreqUpdates/ProjectMatrix.pdf
.
Organisation for
Economic Co-operation and Development (OECD). “2017 Ministerial Council
Statement—Making Globalisation Work: Better Lives for All,” June 8, 2017.
http://www.oecd.org/mcm/documents/2017-ministerial-council-statement.htm
.
Organization for
Economic Cooperation and Development (OECD).
Economic Outlook no. 102: Statistics and Projections, (Edition 2017/2)
.
Paris, OECD: November 2017.
https://www.oecd-ilibrary.org/economics/data/oecd-economic-outlook-statistics-and-projections/oecd-economic-outlook-no-102-edition-2017-2_05b705e7-en
.
Organisation for
Economic Co-operation and Development (OECD). “List of OECD Member
Countries—Ratification of the Convention on the OECD,” n.d. (accessed February
28, 2018).
http://www.oecd.org/about/membersandpartners/list-oecd-member-countries.htm
.
Organisation for
Economic Co-operation and Development (OECD). “Meeting of the OECD Council at
Ministerial Level: Chair’s Statement,” June 8, 2017.
http://www.oecd.org/mcm/documents/C-MIM-2017-18-EN.pdf
.
Organization of
American States (OAS). Sistema de Información sobre Comercio Exterior/ Foreign
Trade Information System (SICE) database. “Trade Policy Developments:
Canada-Mexico-United States (NAFTA).”
http://www.sice.oas.org/TPD/NAFTA/NAFTA_e.ASP
(accessed April 5, 2018).
Organization of
American States (OAS). Sistema de Información sobre Comercio Exterior/ Foreign
Trade Information System (SICE) database. “Sixth Meeting of the AUSFTA Joint
Committee.” News release, December 7, 2017.
http://www.sice.oas.org/TPD/USA_AUS/Implementation/Committee_December_2017_e.pdf
.
Rogoff, Kenneth. “India’s
Currency Exchange: Will Modi’s Plan Work?” World Economic Forum, November 22,
2016.
https://www.weforum.org/agenda/2016/11/indias-currency-exchange-will-modis-plan-work
.
RSM International
Association. “Approved Labor Reform Bill in the House of Representatives,” by
Marcelo Sampaio and Leonardo Biar. News release, April 28, 2017.
https://www.rsm.global/brazil/en/news/approved-labor-reform-bill-house-representatives
.
P Global
Platts. “APPEC Analysis: South Korea Aims to Reduce Dependence on Middle
Eastern Crudes,” September 27, 2017.
https://www.platts.com/latest-news/oil/singapore/appec-analysis-south-korea-aims-to-reduce-dependence-27875129
.
Sonapi Parc
Industriel de Caracol.
Sonapi Parc Industriel de Caracol 2017 Year End
Report
, n.d. Copy supplied by Mark D’Sa Consulting Services, LLC (accessed
February 20, 2018).
Taipei Economic
and Cultural Representative Office in the U.S. “The 2017 Republic of China
(Taiwan) Agricultural Trade Goodwill Mission Signed Three Letters of Intent
on Capitol Hill with U.S. Exporters for the
Purchase of Grains with a Total Value Near US$ 3 Billion
,” September 14,
2017.
https://www.roc-taiwan.org/us_en/post/6467.html
.
Tratado de Libre
Comercio entre la República Dominicana, Centroamérica y Estados Unidos [DR-CAFTA].
Consejo de Asuntos Ambientales [Environmental Affairs Council]. “Undécima
Reunión del Consejo de Asuntos Ambientales––San José, Costa Rica––Junio 21–22,
2017––Comunicado Conjunto.” [Eleventh Meeting of the Environmental Affairs
Council—Dominican Republic-Central America-United States Free Trade Agreement
(CAFTA-DR)—San José, Costa Rica—June 21–22, 2017—Joint Communiqué]. EAC Final,
June 21, 2017.
http://www.caftadr-environment.org/wp-content/uploads/2017/10/Comunicado-Conjunto-de-la-Und%C3%A9cima-Reuni%C3%B3n-del-Consejo-de-Asuntos-Ambien.pdf
.
U.S.-China
Economic and Security Review Commission (USCC). “Economics and Trade Bulletin,”
December 6, 2016.
https://www.uscc.gov/Research/december-2016-trade-bulletin
.
U.S. Customs and
Border Protection (U.S. Customs). “CBP Announces Unified Cargo Inspection Pilot
Program at the Otay Mesa Cargo Facility.” Press release, September 20, 2017.
https://www.cbp.gov/newsroom/local-media-release/cbp-announces-unified-cargo-inspection-pilot-program-otay-mesa-cargo
.
U.S. Customs and
Border Protection (U.S. Customs). “CBP, SAT/Aduana Mexico, Kansas City Southern
Dedicated Unified Rail Cargo Processing Facility.” Press release, August 17,
2017.
https://www.cbp.gov/newsroom/local-media-release/cbp-sataduana-mexico-kansas-city-southern-dedicate-unified-rail-cargo
.
U.S. Customs and
Border Protection (U.S. Customs). “Readout of Acting Commissioner Kevin
McAleeman’s Trip to Mexico City.” Press release, April 21, 2017.
https://www.cbp.gov/newsroom/speeches-and-statements/readout-acting-commissioner-kevin-mcaleenan-s-trip-mexico-city
.
U.S. Customs and
Border Protection (U.S. Customs). “United States and Mexico Hold Official
Meeting to Strengthen Economic Competitiveness and Security.” Press release,
April 20, 2017.
https://www.cbp.gov/newsroom/national-media-release/united-states-and-mexico-hold-official-meeting-strengthen-economic-0
.
U.S. Customs and
Border Protection (U.S. Customs). “U. S. Customs and Border Protection
Announces Unified Cargo Inspection Pilot and Participates in Building Strong
Border Communities Event with Government of Mexico.” Press release, August 5,
2016.
https://www.cbp.gov/newsroom/speeches-and-statements/us-customs-and-border-protection-announces-unified-cargo-inspection
.
U.S. Department
of Agriculture (USDA). “South Korea Lifts U.S. Poultry Ban.” Press release,
August 17, 2017.
https://www.usda.gov/media/press-releases/2017/08/17/south-korea-lifts-us-poultry-ban
.
U.S. Department
of Agriculture (USDA). “USDA Announces Regionalization Agreement with South
Korea to Help Protect U.S. Trade during HPAI Detections.” Press release, March
15, 2018.
https://www.usda.gov/media/press-releases/2018/03/15/usda-announces-regionalization-agreement-south-korea-help-protect
.
U.S. Department
of Agriculture (USDA). Foreign Agricultural Service (FAS
). Fragile Trade—A Year in Egg Exports to Korea
, by Amanda F.
Hinkle. GAIN Report no. KS1809, March 9, 2018.
https://www.fas.usda.gov/data/south-korea-fragile-trade-year-egg-exports-korea
.
U.S. Department
of Agriculture (USDA). Foreign Agricultural Service (FAS). “Japan Expands
Market Access for U.S. Chipping Potatoes.” News release, September 15, 2017.
https://www.fas.usda.gov/newsroom/japan-expands-market-access-us-chipping-potatoes
.
U.S. Department
of Agriculture (USDA). Foreign Agricultural Service (FAS).
Morocco: US Common Wheat TRQ Fully Allocated in 2017
. GAIN Report
Number MO 1709, November 16, 2017.
https://gain.fas.usda.gov/Recent%20GAIN%20Publications/US%20Common%20Wheat%20TRQ%20Fully%20Allocated%20in%202017_Rabat_Morocco_11-13-2017.pdf
.
U.S. Department
of Agriculture (USDA). Foreign Agricultural Service (FAS). “Statement of
Secretary Perdue Regarding Japan’s Planned Increase of Tariff on U.S. Beef.”
Press release, July 28, 2017.
https://www.usda.gov/media/press-releases/2017/07/28/statement-secretary-perdue-regarding-japans-planned-increase-tariff
.
U.S. Department
of Agriculture (USDA). Foreign Agricultural Service (FAS). “USDA, USTR Announce
Expanded Access for U.S. Rice Exports to Colombia.” News release USDA 0084.17,
August 17, 2017.
https://www.fas.usda.gov/newsroom/usda-ustr-announce-expanded-access-us-rice-exports-colombia
.
U.S.
Department of Agriculture (USDA). Foreign Agricultural Service (FAS). Global
Agricultural Trade System Online (GATS).
https://apps.fas.usda.gov/GATS/Default.aspx
(accessed March 14, 2018).
U.S.
Department of Commerce (USDOC). “
Fact Sheet: Commerce Preliminarily
Finds Dumping of Imports of Common Alloy Aluminum Sheet from China.” June 2018.
https://enforcement.trade.gov/download/factsheets/factsheet-prc-common-alloy-aluminum-sheet-ad-prelim-061818.pdf
.
U.S. Department
of Commerce (USDOC). “Joint Press Statement from Secretary Ross and
Commissioner Jourova on the Privacy Shield Review.” Press release, September
20, 2017.
https://www.commerce.gov/news/press-releases/2017/09/joint-press-statement-secretary-ross-and-commissioner-jourova-privacy
.
U.S. Department
of Commerce (USDOC). “Joint Release: Initial Results of the 100-Day Action Plan
of the U.S.-China Comprehensive Economic Dialogue.” Press release, May 11,
2017.
https://www.commerce.gov/news/press-releases/2017/05/joint-release-initial-results-100-day-action-plan-us-china-comprehensive
.
U.S. Department
of Commerce (USDOC). “New Agreement with the European Union Will Strengthen
Partnerships Across Atlantic.”
The
Commerce Blog
, April 23, 2015.
https://www.commerce.gov/news/blog/2015/04/new-agreement-european-union-will-strengthen-partnerships-across-atlantic
.
U.S. Department
of Commerce (USDOC). “Section 232 Investigation on the Effect of Imports of
Aluminum on U.S. National Security,” updated March 18, 2018.
https://www.commerce.gov/page/section-232-investigation-effect-imports-aluminum-us-national-security
.
U.S. Department
of Commerce (USDOC).
The Effect of
Imports of Aluminum on the National Security: An Investigation Conducted under
Section 232 of the Trade Expansion Act of 1962, as Amended
, January 17,
2018.
https://www.commerce.gov/sites/commerce.gov/files/the_effect_of_imports_of_aluminum_on_the_national_security_-_with_redactions_-_20180117.pdf
.
U.S. Department
of Commerce (USDOC).
The Effect of
Imports of Steel on the National Security: An Investigation Conducted under
Section 232 of the Trade Expansion Act of 1962, as Amended
, January 11,
2018.
https://www.commerce.gov/sites/commerce.gov/files/the_effect_of_imports_of_steel_on_the_national_security_-_with_redactions_-_20180111.pdf
.
U.S. Department of Commerce
(USDOC). “U.S. Department of Commerce Self-Initiates Historic Antidumping and
Countervailing Duty Investigations on Common Alloy Aluminum Sheet from China,” Press
release, November 28, 2017.
https://www.commerce.gov/news/press-releases/2017/11/us-department-commerce-self-initiates-historic-antidumping-and
.
U.S. Department
of Commerce (USDOC). “U.S. Secretary of Commerce Wilbur Ross Welcomes Release
of the European Commission’s Report on the EU-U.S. Privacy Shield.” Press
release, October 18, 2017.
https://www.commerce.gov/news/press-releases/2017/10/us-secretary-commerce-wilbur-ross-welcomes-release-european-commissions
.
U.S. Department
of Commerce (USDOC). Bureau of Economic Analysis (BEA). “Annual Update of the
U.S. International Transactions Accounts.”
Survey
of Current Business
97, no. 7 (July 2017).
https://www.bea.gov/scb/pdf/2017/07%20July/0717_annual_update_of_international_transactions_accounts.pdf
.
U.S. Department
of Commerce (USDOC). Bureau of Economic Analysis (BEA). “Contributions to
Percent Change in Real Gross Domestic Product by Industry,” April 19, 2018.
https://www.bea.gov/iTable/iTable.cfm?ReqID=51&step=1#reqid=51&step=51&isuri=1&5114=a&5102=13
.
U.S. Department
of Commerce (USDOC). Bureau of Economic Analysis (BEA). “Gross Domestic
Product: Fourth Quarter and Annual 2017 (Second Estimate).” News release,
February 28, 2018.
https://www.bea.gov/newsreleases/national/gdp/2018/pdf/tech4q17_2nd.pdf
.
U.S. Department
of Commerce (USDOC). Bureau of Economic Analysis (BEA). “Information on Goods
and Services.” News release, February 6, 2018.
https://www.bea.gov/newsreleases/international/trade/2018/info1217.htm
.
U.S. Department
of Commerce (USDOC). Bureau of Economic Analysis (BEA). Interactive data:
International Transactions, Services, & International Investment Position
(IIP), International Transactions, tables 1.2 and 1.3, U.S. International Trade
in Services, March 21, 2018.
https://bea.gov/iTable/index_ita.cfm
(accessed March 28, 2018).
U.S. Department
of Commerce (USDOC). Bureau of Economic Analysis (BEA). Interactive data:
International Transactions, Services, and International Investment Position
(IIP), International Transactions, table 3.1, “U.S. International Trade in
Services,” March 21, 2018.
https://bea.gov/iTable/index_ita.cfm
(accessed April 2, 2018).
U.S. Department
of Commerce (USDOC). Bureau of Economic Analysis (BEA). Interactive data: table
2.3, U.S. Trade in Services, by Country or Affiliation and by Type of Service,
India, October 24, 2017.
https://bea.gov/iTable/index_ita.cfm
(accessed March 28, 2018).
U.S. Department
of Commerce (USDOC). Bureau of Economic Analysis (BEA). Quarterly Survey of
Transactions in Selected Services and Intellectual Property with Foreign
Persons, Form BE-125 (September 2016).
https://www.bea.gov/surveys/pdf/be125.pdf
.
U.S. Department
of Commerce (USDOC). Economic Development Administration (EDA).
Fiscal Year 2016 Annual Report to Congress:
Trade Adjustment Assistance for Firms Program
, n.d. (accessed March 29,
2018).
https://www.eda.gov/pdf/annual-reports/taaf/FY16-TAAF-Annual-Report-to-Congress.pdf
.
U.S. Department
of Commerce (USDOC). Economic Development Administration (EDA). “Trade
Adjustment Assistance for Firms.”
https://www.eda.gov/pdf/about/TAAF-Program-1-Pager.pdf
(accessed March 29, 2018).
U.S. Department
of Commerce (USDOC). International Trade Administration (ITA). “Subject: Issues
and Decision Memorandum for the Final Determination in the Countervailing Duty
Investigation of 100- to 150-Seat Large Civil Aircraft from Canada.”
Investigation C-122-860, December 18, 2017.
https://enforcement.trade.gov/frn/summary/canada/2017-27875-1.pdf
.
U.S. Department
of Commerce (USDOC). International Trade Administration (ITA). “U.S.-Canada
Regulatory Cooperation Council––United States and Canada Announce the 2016
Annual Work Plans,” n.d.
https://www.trade.gov/rcc/
(accessed March 28, 2018).
U.S. Department
of Commerce (USDOC). International Trade Administration (ITA). Enforcement and
Compliance. “Commerce Finds Dumping and Subsidization of Imports of 100- to
150-Seat Large Civil Aircraft from Canada.” Fact sheet, n.d.
https://www.commerce.gov/sites/commerce.gov/files/fact_sheet_commerce_finds_dumping_and_subsidization_of_imports_of_100-_to_150-seat_large_civil_aircraft_from_canada.pdf
(accessed March 29, 2018).
U.S. Department
of Commerce (USDOC). Office of Public Affairs (OPA). “Presidential Memorandum
Prioritizes Commerce Steel Investigation.” Press release, April 20, 2017.
https://www.commerce.gov/news/press-releases/2017/04/presidential-memorandum-prioritizes-commerce-steel-investigation
.
U.S. Department
of Commerce (USDOC). Office of Public Affairs (OPA). “U.S. Department of
Commerce Finds Dumping and Subsidization of Imports of 100- to 150-Seat Large
Civil Aircraft from Canada.” Press release, December 20, 2017.
https://www.commerce.gov/news/press-releases/2017/12/us-department-commerce-finds-dumping-and-subsidization-imports-100-150
.
U.S. Department of
Commerce (USDOC). Office of Textiles and Apparel (OTEXA). “Trade and
Development Act of 2002: Haitian Hemispheric Opportunity through Partnership
for Encouragement Act (HAITI HOPE).”
http://otexa.trade.gov/agoa-cbtpa/agoa-cbtpa.htm
(accessed February 12, 2018).
U.S. Department
of Commerce (USDOC). Office of Textiles and Apparel (OTEXA). “U.S. General
Imports by Country: Major Shippers Report.”
http://otexa.trade.gov/msrcty/v2450.htm
(accessed February 21, 2018).
U.S. Department
of Commerce (USDOC). Office of Textiles and Apparel (OTEXA). “U.S. Imports
under Trade Preference Programs.”
http://otexa.trade.gov/agoa-cbtpa/catv0.htm
(accessed February 12, 2018).
U.S. Department
of Labor (USDOL). “Second Periodic Review of Progress to Address Issues
Identified in the U.S. Department of Labor’s Public Report of Review of
Submission 2015-01 (Peru),” April 20, 2018.
https://www.dol.gov/sites/default/files/documents/ilab/Peru%20FTA%20Submission%20Second%20Review%20Statement%20Final.pdf
.
U.S. Department
of Labor (USDOL). “US Labor Department Report Identifies Labor Concerns In
Colombia––Responds to Submission Filed under the US-Colombia Trade Promotion
Agreement.” News release, January 11, 2017.
https://www.dol.gov/newsroom/releases/ilab/ilab20170111-0
.
U.S. Department
of Labor (USDOL). Employment and Training Administration (ETA). “TAA Program
Benefits and Services under the 2015 Amendments.”
https://www.doleta.gov/tradeact/2015_amend_benfits.cfm
(accessed March 30, 2018).
U.S. Department
of Labor (USDOL). Employment and Training Administration (ETA).
Trade Adjustment Assistance for Workers
Program, Fiscal Year 2016
, 2017.
https://doleta.gov/tradeact/docs/AnnualReport16.pdf
.
U.S. Department
of Labor (USDOL). Employment and Training Administration (ETA).
U.S. Department of Labor’s Report of the
Study of Domestic Industry under Section 224 of the Trade Act of 1974:
Crystalline Silicon Photovoltaic Cells (Whether or Not Partially or Fully
Assembled into Other Products)
, November 2017.
https://www.doleta.gov/tradeact/docs/CSPV_Study.pdf
.
U.S. Department
of Labor (USDOL). Employment and Training Administration (ETA).
U.S. Department of Labor’s Report of the
Study of Domestic Industry under Section 224 of the Trade Act of 1974: Large
Residential Washers
, December 2017.
https://www.doleta.gov/tradeact/docs/LRW_Study.pdf
.
U.S. Department
of Labor (USDOL). Bureau of International Labor Affairs (ILAB). “Submissions
under the Labor Provisions of Free Trade Agreements,” n.d.
https://www.dol.gov/agencies/ilab/our-work/trade/fta-submissions
(accessed April 26, 2018).
U.S. Department
of Labor (USDOL). Bureau of International Labor Affairs (ILAB). U.S. National
Administrative Office (NAO). “North American Agreement on Labor Cooperation: A
Guide.”
https://www.dol.gov/ilab/trade/agreements/naalcgd.htm
(accessed April 5, 2018).
U.S. Department
of Labor (USDOL). Bureau of International Labor Affairs (ILAB). Office of Trade
and Labor Affairs (OTLA). “North American Agreement on Labor Cooperation.”
https://www.dol.gov/ilab/reports/pdf/naalc.htm
(accessed April 5, 2018).
U.S. Department
of Labor (USDOL). Bureau of International Labor Affairs (ILAB). Office of Trade
and Labor Affairs (OTLA). “Submission under the North American Agreement on
Labor Cooperation: Currently under Review.”
https://www.dol.gov/ilab/trade/agreements/naalc.htm
(accessed April 5, 2018).
U.S. Department
of Labor (USDOL). Bureau of International Labor Affairs (ILAB). Office of Trade
and Labor Affairs (OTLA). “Submissions under the North American Agreement on
Labor Cooperation: U.S. Currently under Review.”
https://www.dol.gov/ilab/trade/agreements/naalc.htm
(accessed April 5, 2018).
U.S. Department
of State (USDOS). “Eleventh Meeting of the Environmental Affairs
Council––Dominican Republic-Central America-United States Free Trade Agreement
(CAFTA-DR)––San José, Costa Rica––June 21–22, 2017––Joint Communiqué.” Jun 21
2017-EAC Final, June 21, 2017.
https://www.state.gov/documents/organization/275544.pdf
.
U.S. Department
of State (USDOS). “Joint Press Statement: U.S.-Philippines Bilateral Strategic
Dialogue 2017,” December 1, 2017.
https://www.state.gov/r/pa/prs/ps/2017/12/276161.htm
.
U.S. Department
of State (USDOS). “United States-Jordan 2018–2021 Work Program for
Environmental Technical Cooperation,” n.d.
https://www.state.gov/documents/organization/279492.pdf
(accessed April 6, 2018).
U.S. Department
of State (USDOS). Bureau of Economic and Business Affairs (EB). “Outcomes of
Current U.S. Trade Agreements,” n.d.
https://www.state.gov/e/eb/tpn/bta/fta/c76143.htm
(accessed April 6, 2018).
U.S. Department
of State (USDOS). Bureau of European and Eurasian Affairs (EUR). “Framework for
Advancing Transatlantic Economic Integration between the United States of
America and the European Union (EU),” April 30, 2007.
https://www.state.gov/p/eur/rls/or/130772.htm
.
U.S. Department
of State (USDOS). Bureau of European and Eurasian Affairs (EUR). “Joint
Statement from the 8th U.S.-EU SME Workshop in the Framework of the
Transatlantic Economic Council,” October 19, 2017.
https://www.state.gov/p/eur/rt/eu/tec/276419.htm
.
U.S. Department
of State (USDOS). Bureau of European and Eurasian Affairs (EUR). “Transatlantic
Economic Council Facilitators’ Report to Stakeholders,” November 30, 2016.
https://www.state.gov/p/eur/rls/or/2016/265818.htm
.
U.S. Department
of State (USDOS). Bureau of Oceans and International Environmental and
Scientific Affairs (OES). “2018–2019 Plan of Action for Environmental
Cooperation under the U.S.-Singapore Memorandum of Intent on Environmental
Cooperation.” News release, January 19, 2018.
https://www.state.gov/e/oes/eqt/trade/singapore/278254.htm
.
U.S. Department
of State (USDOS). Bureau of Oceans and International Environmental and
Scientific Affairs (OES). “Joint Communiqué of the United States-Bahrain Joint
Forum on Environmental Cooperation and Free Trade Agreement Subcommittee on
Environmental Affairs.” News release, March 7, 2018.
https://www.state.gov/e/oes/eqt/trade/bahrain/280257.htm
.
U.S. Department
of State (USDOS). Bureau of Oceans and International Environmental and
Scientific Affairs (OES). “Joint Communiqué of the United States-Jordan Joint
Forum on Environmental Technical Cooperation.” News release, February 12, 2018.
https://www.state.gov/e/oes/eqt/trade/jordan/279252.htm
.
U.S. Department
of State (USDOS). Bureau of Oceans and International Environmental and
Scientific Affairs (OES). “Joint Communiqué for United States-Singapore 5th
Biennial Review Meeting.” News release, January 19, 2018.
https://www.state.gov/e/oes/eqt/trade/singapore/277677.htm
.
U.S. Department
of State (USDOS). Office of the Legal Adviser. International Claims and
Investment Disputes (L/CID). “NAFTA Investor-State Arbitrations: Cases Filed
against the Government of Canada.”
https://www.state.gov/s/l/c3740.htm
(accessed April 10, 2018).
U.S. Department
of State (USDOS). Office of the Legal Adviser. International Claims and
Investment Disputes (L/CID). “NAFTA Investor-State Arbitrations: Cases Filed
against the United Mexican States.”
https://www.state.gov/s/l/c3742.htm
(accessed April 10, 2018).
U.S. Department
of State (USDOS). Office of the Legal Adviser. International Claims and
Investment Disputes (L/CID). “NAFTA Investor-State Arbitrations: Cases Filed
against the United States of America.”
https://www.state.gov/s/l/c3741.htm
(accessed April 10, 2018).
U.S. Department
of State (USDOS). United States-Panama Trade Promotion Agreement (TPA). Chapter
10 in “Submission of the United States of America re: Bridgestone Licensing
Services, Inc., and Bridgestone Americas, Inc., Claimants, and The Republic of
Panama, Respondent.” ICSID Convention Case No. Arb/16/34, August 28, 2017.
U.S. Department
of State (USDOS). United States-Panama Trade Promotion Agreement (TPA). Chapter
10 in “Supplemental Submission of the United States.” ICSID Convention Case No.
Arb/16/34, September 25, 2017.
https://www.italaw.com/sites/default/files/case-documents/italaw9341.pdf
.
U.S. Department
of State (USDOS). U.S. Embassy and Consulates in Turkey. “U.S.-Turkey Trade and
Investment Framework Agreement,” October 2, 2017.
https://tr.usembassy.gov/u-s-turkey-trade-investment-framework-agreement/
.
U.S. Department
of State (USDOS). U.S. Embassy in Ukraine. “Joint Statement on the United
States-Ukraine Trade and Investment Council,” October 5, 2017.
https://ua.usembassy.gov/joint-statement-united-states-ukraine-trade-investment-council/
.
U.S. Department
of Transportation (USDOT). Federal Motor Carrier Safety Administration (FMCSA).
“Out-of-Service (OOS) Rates (Mexican-Owned or Mexico-Domiciled Carriers),”
April 13, 2018.
https://ai.fmcsa.dot.gov/SafetyProgram/spRptMex.aspx?rpt=MXOOS
.
U.S. Department
of Transportation (USDOT). Federal Motor Carrier Safety Administration (FMCSA).
“Roadside Inspection Out-of-Service (OOS) Rates,” April 13, 2018.
https://ai.fmcsa.dot.gov/SafetyProgram/spRptRoadside.aspx?rpt=RDOOS
.
U.S. Department
of Transportation (USDOT). Federal Motor Carrier Safety Administration (FMCSA).
United States-Mexico Cross-Border
Long-Haul Trucking Pilot Program: Report to Congress
, January, 2015.
https://www.fmcsa.dot.gov/sites/fmcsa.dot.gov/files/docs/US-Mexico%20Cross-Border%20Long-Haul%20Trucking%20Pilot%20Program%20Report%20FINAL%20January%202015.pdf
.
U.S. Department
of the Treasury (U.S. Treasury). “Bilateral Agreement between the European
Union and the United States of America on Prudential Measures Regarding
Insurance and Reinsurance [U.S.–EU Covered Agreement].” Fact sheet, January 18,
2017.
https://www.treasury.gov/initiatives/fio/reports-and-notices/Documents/Covered-Agreement-Fact-Sheet-(011317)-FINAL.PDF
.
U.S. Department
of the Treasury (U.S. Treasury). “Joint Press Release: Initial Results of the
100-Day Action Plan of the U.S.-China Comprehensive Economic Dialogue.” Press
release, May 11, 2017.
https://www.treasury.gov/press-center/press-releases/Pages/sm0082.aspx
.
U.S. Department
of the Treasury (U.S. Treasury). “Joint Statement on the U.S.-EU Negotiations
for a Bilateral Agreement on Insurance and Reinsurance Measures.” Press
release, January 13, 2017.
https://www.treasury.gov/press-center/press-releases/Pages/jl0706.aspx
.
U.S. Department
of the Treasury (U.S. Treasury). “Statement of the United States on the Covered
Agreement with the European Union,” September 22, 2017.
https://www.treasury.gov/initiatives/fio/reports-and-notices/Documents/US_Covered_Agreement_Policy_Statement_Issued_September_2017.pdf
.
U.S. Energy
Information Administration (EIA). “Short-Term Energy Outlook,” March 2018.
https://www.eia.gov/outlooks/steo/pdf/steo_full.pdf
.
U.S. Energy
Information Administration (EIA). Spot Prices for Crude Oil and Petroleum
Products, Official Statistics, Summary Statistics database.
https://www.eia.gov/dnav/pet/pet_pri_spt_s1_a.htm
(accessed April 17, 2018).
U.S. Energy
Information Administration (EIA). “Today in Energy: U.S. Crude Oil Exports
Increased and Reached More Destinations in 2017,” March 15, 2018.
https://www.eia.gov/todayinenergy/detail.php?id=35352
.
U.S. Energy
Information Administration (EIA). “Today in Energy: U.S. Liquefied Natural Gas
Exports Have Increased as New Facilities Come Online,” December 7, 2017.
https://www.eia.gov/todayinenergy/detail.php?id=34032
.
U.S. Energy
Information Administration (EIA). “Today in Energy: U.S. Liquefied Natural Gas
Exports Quadrupled in 2017,” March 27, 2018.
https://www.eia.gov/todayinenergy/detail.php?id=35512
.
U.S. Energy
Information Administration (EIA). U.S. Exports database.
https://www.eia.gov/dnav/pet/pet_move_expc_a_EP00_EEX_mbbl_a.htm
(accessed April 17, 2018).
U.S. Energy
Information Administration (EIA). U.S. Imports by Country of Origin database.
https://www.eia.gov/dnav/pet/pet_move_impcus_a2_nus_ep00_im0_mbbl_a.htm
(accessed April 17, 2018).
U.S. Government
Accountability Office (GAO). “Letter to the Honorable Max Baucus and the
Honorable Dave Camp Concerning the Follow-up on the Haiti Earned Import
Allowance Program,” December 14, 2012.
https://www.gao.gov/assets/660/650894.txt
.
U.S.
International Trade Commission (USITC).
Caribbean
Basin Economic Recovery Act, 23nd Report 2015–1
6.
USITC Publication 4728.
Washington, DC: USITC, September 2017.
https://www.usitc.gov/publications/332/pub4728.pdf
.
U.S.
International Trade Commission (USITC).
China:
Effects of Intellectual Property Infringement and Indigenous Innovation
Policies on the U.S. Economy
. USITC Publication 4226. Washington, DC:
USITC, May 2011.
https://www.usitc.gov/publications/332/pub4226.pdf
.
U.S.
International Trade Commission (USITC).
China:
Intellectual Property Infringement, Indigenous Innovation Policies, and
Frameworks for Measuring the Effects on the U.S. Economy
. USITC Publication
4199. Washington, DC: USITC, November 2010.
https://www.usitc.gov/publications/332/pub4199.pdf
.
U.S.
International Trade Commission (USITC).
Crystalline
Silicon Photovoltaic Cells (Whether or Not Partially or Fully Assembled into
Other Products), Investigation No. TA-201-75
. USITC Publication 4739.
Washington, DC: USITC, November 2017.
https://www.usitc.gov/publications/safeguards/pub4739-vol_i.pdf
(volume 1) and
https://www.usitc.gov/publications/safeguards/pub4739-vol_ii.pdf
(volume 2).
U.S.
International Trade Commission (USITC). “Frequently Asked Questions.”
Shifts in U.S. Merchandise Trade, 2016
.
USITC Publication 4723. Washington, DC: USITC, September 2017.
https://www.usitc.gov/research_and_analysis/trade_shifts_2016/faqs.htm
.
U.S.
International Trade Commission (USITC).
Global
Digital Trade 1: Market Opportunities and Key Foreign Trade Restrictions
.
USITC Publication 4176. Washington, DC: USITC, August 2017.
https://www.usitc.gov/publications/332/pub4716_0.pdf
.
U.S.
International Trade Commission (USITC). Interactive Tariff and Trade DataWeb
(DataWeb). Based on official trade statistics of the U.S. Department of
Commerce (USDOC).
http://dataweb.usitc.gov
(accessed various dates).
U.S.
International Trade Commission (USITC).
Large
Residential Washers, Investigation No. TA-201-76
. USITC Publication 4745.
Washington, DC: USITC, December 2017.
https://www.usitc.gov/publications/safeguards/pub4745.pdf
.
U.S.
International Trade Commission (USITC).
Nepal:
Advice Concerning Whether Certain Textile and Apparel Articles Are Import
Sensitive
. USITC Publication 4640. Washington, DC: USITC, October 2016.
https://www.usitc.gov/publications/332/pub4640.pdf
.
U.S.
International Trade Commission (USITC).
Softwood
Lumber Products from Canada––Investigation Nos. 701-TA-566 and 731-TA-1342
(Final).
USITC Publication 4749. Washington, DC: USITC, December 2017.
https://www.usitc.gov/investigations/701731/2017/softwood_lumber_canada/final.htm
.
U.S.
International Trade Commission (USITC).
Textiles
and Apparel: Effects of Special Rules for Haiti on Trade, Markets, and
Industries.
USITC Publication 4016. Washington, DC: USITC, June 2008.
https://www.usitc.gov/publications/332/pub4016.pdf
.
U.S.
International Trade Commission (USITC).
The
Year in Trade 2016: Operation of the Trade Agreement Program, 68th Report
.
USITC Publication 4711. Washington, DC: USITC, July 2017.
https://usitc.gov/publications/332/pub4711.pdf
.
U.S.
International Trade Commission (USITC).
The
Year in Trade in 2015: Operation of the Trade Agreement Program, 67th Report
.
USITC Publication 4627. Washington, DC: USITC, July 2016.
https://www.usitc.gov/publications/332/pub4627.pdf
.
U.S.
International Trade Commission (USITC).
The
Year in Trade 2014: Operation of the Trade Agreement Program, 66th Report
.
USITC Publication 4543. Washington, DC: USITC, July 2015.
http://www.usitc.gov/publications/332/pub4543.pdf
(accessed April 13, 2018).
U.S. International
Trade Commission (USITC).
The Year in
Trade 2011: Operation of the Trade Agreements Program, 63rd Report.
USITC
Publication 4336. Washington, DC: USITC, July 2012.
https://www.usitc.gov/sites/default/files/publications/332/pub4336.pdf
.
U.S.
International Trade Commission (USITC).
The
Year in Trade 2010: Operation of the Trade Agreements Program, 62nd Report.
USITC
Publication 4247. Washington, DC: USITC, July 2011.
https://www.usitc.gov/sites/default/files/publications/332/pub4247_0.pdf
.
U.S. International
Trade Commission (USITC).
The Year in
Trade 2008: Operation of the Trade Agreements Program, 60th Report
. USITC,
Publication 4091. Washington, DC: USITC, July 2009.
https://www.usitc.gov/sites/default/files/publications/332/pub4091_0.pdf
.
U.S. Permanent
Mission to the World Trade Organization (U.S. Mission to the WTO). “Statement
by the United States at the Meeting of the WTO Dispute Settlement Body, Geneva,
January 22, 2018.”
https://geneva.usmission.gov/wp-content/uploads/2018/01/Jan22.DSB_.Stmt_.as-delivered.fin_.public.pdf
.
U.S. Permanent Mission
to the World Trade Organization (U.S. Mission to the WTO). “Statement by the
United States at the Meeting of the WTO Dispute Settlement Body, Geneva,
November 22, 2017.”
https://geneva.usmission.gov/wp-content/uploads/2017/11/Nov22.DSB_.pdf
.
U.S.
Permanent Mission to the World Trade Organization (U.S. Mission to the WTO).
“Statement by the United States at the Meeting of the WTO Dispute Settlement
Body, Geneva, August 31, 2017.”
https://geneva.usmission.gov/wp-content/uploads/2017/08/Aug31.DSB_.Stmt_.as-delivered.fin_.public.pdf
.
U.S. Senate.
Office of Senator Steve Daines. “Daines Returns from Security, Trade Mission to
South Korea, Taiwan.” Press release, September 24, 2017.
https://www.daines.senate.gov/news/press-releases/daines-returns-from-security-trade-mission-to-south-korea-taiwan
.
U.S. Trade
Representative (USTR).
2018 National
Trade Estimate Report on Foreign Trade Barriers
. Washington, DC: USTR,
March 2018.
https://ustr.gov/sites/default/files/files/Press/Reports/2018%20National%20Trade%20Estimate%20Report.pdf
.
U.S. Trade
Representative (USTR).
2018 Trade Policy
Agenda and 2017 Annual Report of the President of the United States on the
Trade Agreements Program
. Washington, DC: USTR, March 2018.
https://ustr.gov/sites/default/files/files/Press/Reports/2018/AR/2018
Annual Report FINAL.PDF
.
U.S. Trade
Representative (USTR).
2017 National
Trade Estimate Report on Foreign Trade Barriers.
Washington, DC: USTR,
March 2017.
https://ustr.gov/sites/default/files/files/reports/2017/NTE/2017%20NTE.pdf
.
U.S. Trade
Representative (USTR).
2017 Out-of-Cycle
Review of Notorious Markets
. Washington, DC: USTR, January 2018.
https://ustr.gov/sites/default/files/files/Press/Reports/2017%20Notorious%20Markets%20List%201.11.18.pdf
.
U.S. Trade
Representative (USTR).
2017 Report to
Congress on China’s WTO Compliance
. Washington, DC: USTR, January, 2017.
https://ustr.gov/sites/default/files/files/Press/Reports/China%202017%20WTO%20Report.pdf
.
U.S. Trade
Representative (USTR).
2017 Special 301
Report to Congress
. Washington, DC: USTR, April 2017.
https://ustr.gov/sites/default/files/301/2017%20Special%20301%20Report%20FINAL.PDF
.
U.S. Trade
Representative (USTR).
2017 Trade Policy
Agenda and 2016 Annual Report
. Washington DC: USTR, March 1, 2017.
https://ustr.gov/sites/default/files/files/reports/2017/AnnualReport/AnnualReport2017.pdf
.
U.S. Trade
Representative (USTR).
2016 Report to
Congress on China’s WTO Compliance.
Washington, DC: USTR, January 2017.
https://ustr.gov/sites/default/files/2016-China-Report-to-Congress.pdf
.
U.S. Trade
Representative (USTR).
2014 Trade Policy
Agenda and 2013 Annual Report
. Washington DC: USTR, March 3, 2015.
https://ustr.gov/sites/default/files/2014%20Trade%20Policy%20Agenda%20and%202013%20Annual%20Report.pdf
.
U.S. Trade
Representative (USTR). “Agriculture Secretary Perdue and Acting U.S. Trade
Representative Vaughn Announce Major EU Trade Breakthrough for U.S. Citrus
Producers.” Press release, May 3, 2017.
https://ustr.gov/about-us/policy-offices/press-office/press-releases/2017/may/agriculture-secretary-perdue-and-acting
.
U.S. Trade
Representative (USTR). “Closing Statement of USTR Robert Lighthizer at the
Sixth Round of NAFTA Renegotiations.” Press release, January 29, 2018.
https://ustr.gov/about-us/policy-offices/press-office/fact-sheets/2018/january/closing-statement-ustr-robert
.
U.S. Trade
Representative (USTR). “Closing Statement of USTR Robert Lighthizer at the
Third Round of NAFTA Renegotiations.” Press release, September 27, 2017.
https://ustr.gov/about-us/policy-offices/press-office/press-releases/2017/september/closing-statement-ustr-robert-0
.
U.S. Trade
Representative (USTR).
Findings of the
Investigation into China’s Acts, Policies, and Practices Related to Technology
Transfer, Intellectual Property, and Innovations under Section 301 of the Trade
Act of 1974
, March 22, 2018.
https://ustr.gov/sites/default/files/Section%20301%20FINAL.PDF
.
U.S. Trade
Representative (USTR). “Joint Statement of the United States-Tunisia Trade and
Investment Council.” Press release, April 21, 2017.
https://ustr.gov/about-us/policy-offices/press-office/press-releases/2017/april/joint-statement-united-states-tunisia
.
U.S. Trade Representative
(USTR). “Joint Statement of the United States-Turkey Trade and Investment
Council.” Press release, September 29, 2017.
https://ustr.gov/about-us/policy-offices/press-office/press-releases/2017/september/joint-statement-united-states
.
U.S. Trade
Representative (USTR). “Joint Statement on the Council Meeting of the
U.S.-Central Asian Trade and Investment Framework Agreement.” Press release,
December 13, 2017.
https://ustr.gov/about-us/policy-offices/press-office/press-releases/2017/december/joint-statement-council-meeting-us
.
U.S. Trade
Representative (USTR). “Joint Statement on the United States-Singapore Free
Trade Agreement Environment Chapter Meeting.” Press release, October 4, 2017.
https://ustr.gov/about-us/policy-offices/press-office/press-releases/2017/october/joint-statement-united-states-1
.
U.S. Trade
Representative (USTR). “Joint Statement on Upcoming Signature of the Bilateral
Agreement between the European Union and the United States of America on
Prudential Measures Regarding Insurance and Reinsurance.” Press release, September
22, 2017.
https://ustr.gov/about-us/policy-offices/press-office/press-releases/2017/september/joint-statement-upcoming
.
U.S. Trade
Representative (USTR). “Letter from Ambassador Robert E. Lighthizer to Minister
of Trade, Industry, and Energy Dr. Joo Hunghwan.” Press release, July 12, 2017.
https://ustr.gov/sites/default/files/files/Press/Releases/USTR%20KORUS.pdf
.
U.S. Trade
Representative (USTR). “Letter to Congressional Leadership, May 18, 2017.”
https://ustr.gov/sites/default/files/files/Press/Releases/NAFTA%20Notification.pdf
.
U.S. Trade
Representative (USTR). “Opening Statement of USTR Robert Lighthizer at the
First Round of NAFTA Renegotiations.” Press release, August 16, 2017.
https://ustr.gov/about-us/policy-offices/press-office/press-releases/2017/august/opening-statement-ustr-robert-0
.
U.S. Trade
Representative (USTR). “President Trump Determines Trade Preference Eligibility
for Rwanda, Tanzania, and Uganda.” Press release, March 29, 2018.
https://ustr.gov/about-us/policy-offices/press-office/fact-sheets/2018/march/title#
.
U.S. Trade
Representative (USTR). “Public Hearings on the Renegotiation of NAFTA.” Press
release, June 27, 2017.
https://ustr.gov/about-us/policy-offices/press-office/press-releases/2017/june/public-hearing-nafta-renegotiation
.
U.S. Trade
Representative (USTR). “Results of the 2015/2016 Generalized System of
Preferences (GSP) Annual Review,” 2016.
https://ustr.gov/sites/default/files/Outcomes-2015-2016-GSP-Annual-Review.pdf
.
U.S. Trade
Representative (USTR). “Statement of USTR Robert Lighthizer at the Closing of
the Seventh Round of NAFTA Renegotiations.” Press release, March 3, 2018.
https://ustr.gov/about-us/policy-offices/press-office/press-releases/2018/february/statement-ustr-robert-lighthizer
.
U.S. Trade
Representative (USTR). “Summary of Objectives for the NAFTA Renegotiation,”
November 17, 2017.
https://ustr.gov/sites/default/files/files/Press/Releases/Nov%20Objectives%20Update.pdf
.
U.S. Trade
Representative (USTR). “Trilateral Statement on the Conclusion of NAFTA Round
One.” Press release, August 16, 2017.
https://ustr.gov/about-us/policy-offices/press-office/press-releases/2017/august/trilateral-statement-conclusion
.
U.S. Trade
Representative (USTR). “United States and Afghanistan Hold Annual Meeting under
the U.S.-Afghanistan Trade and Investment Framework Agreement (TIFA).” Press
release, March 28, 2017.
https://ustr.gov/about-us/policy-offices/press-office/press-releases/2017/march/us-and-afghanistan-hold-annual
.
U.S. Trade
Representative (USTR). “United States and Australia Meet to Review
Implementation of Bilateral Free Trade Agreement.” Press release, December 6,
2017.
https://ustr.gov/about-us/policy-offices/press-office/press-releases/2017/december/united-states-and-australia-meet
.
U.S. Trade
Representative (USTR). “
United States
and Bangladesh Hold 3rd Trade and Investment Cooperation Forum Agreement
Council Meeting
.” Press release, May 17, 2017.
https://ustr.gov/about-us/policy-offices/press-office/press-releases/2017/may/us-and-bangladesh-hold-3rd-trade-and
.
U.S. Trade Representative
(USTR). “United States and Cambodia Discuss Intensified Work Program.” Press
release, August 9, 2017.
https://ustr.gov/about-us/policy-offices/press-office/press-releases/2017/august/united-states-and-cambodia-discuss
.
U.S. Trade
Representative (USTR). “United States and Egypt Agree to Further Trade
Cooperation.” Press release, December 5, 2017.
https://ustr.gov/about-us/policy-offices/press-office/press-releases/2017/december/united-states-and-egypt-agree
.
U.S. Trade
Representative (USTR), “United States and Indonesia Agree to Step Up Work to
Expand Trade.” Press release, June 14, 2017.
https://ustr.gov/about-us/policy-offices/press-office/press-releases/2017/june/united-states-and-indonesia-agree-step
.
U.S. Trade
Representative (USTR). “United States and Laos Hold Inaugural Meeting under the
U.S.-Laos Trade and Investment Framework Agreement (TIFA).” Press release,
March 23, 2017.
https://ustr.gov/about-us/policy-offices/press-office/press-releases/2017/march/us-and-laos-hold-inaugural-meeting
.
U.S. Trade
Representative (USTR). “United States and Malaysia Meet under Trade and
Investment Framework Agreement.” Press release, July 17, 2017.
https://ustr.gov/about-us/policy-offices/press-office/press-releases/2017/july/united-states-and-malaysia-meet-under
.
U.S. Trade
Representative (USTR). “United States and Paraguay Sign Trade and Investment
Framework Agreement.” Press release, January 13, 2017.
https://ustr.gov/about-us/policy-offices/press-office/press-releases/2017/january/united-states-and-paraguay-sign
.
U.S. Trade
Representative (USTR). “United States and Philippines Strengthen Engagement on
Trade.” Press release, July 11, 2017.
https://ustr.gov/about-us/policy-offices/press-office/press-releases/2017/july/united-states-and-philippines
.
U.S. Trade
Representative (USTR). “United States and Taiwan Hold Dialogue on Trade and
Investment Priorities.” Press release, October 6, 2016.
https://ustr.gov/about-us/policy-offices/press-office/press-releases/2016/october/united-states-and-taiwan-hold
.
U.S. Trade
Representative (USTR). “United States and Thailand Discuss Trade Agenda under
Trade and Investment Framework Agreement.” Press release, April 3, 2017.
https://ustr.gov/about-us/policy-offices/press-office/press-releases/2017/april/united-states-and-thailand-discuss
.
U.S. Trade
Representative (USTR). “United States and Vietnam Renew Trade Dialogue during Trade
and Investment Framework Agreement (TIFA) Meetings.” Press release, March 28,
2017.
https://ustr.gov/about-us/policy-offices/press-office/press-releases/2017/march/us-and-vietnam-renew-trade-dialogue
.
U.S. Trade
Representative (USTR). “United States, Korea to Hold Amendment Negotiations on
KORUS FTA.” Press release, December 28, 2017.
https://ustr.gov/about-us/policy-offices/press-office/press-releases/2017/december/titleunited-states-korea-hold
.
U.S. Trade
Representative (USTR). “U.S. Announces Compliance in World Trade Organization
‘Dolphin-Safe’ Labeling Dispute.” Press release, July 12, 2013.
https://ustr.gov/about-us/policy-offices/press-office/press-releases/2013/july/US-complies-tuna-dolphin
.
U.S. Trade
Representative (USTR). “USDA Secretary Sonny Perdue and USTR Robert Lighthizer
Announce Expanded Access for U.S. Rice Exports to Colombia.” Press release,
August 17, 2017.
https://www.usda.gov/media/press-releases/2017/08/17/usda-secretary-sonny-perdue-and-ustr-robert-lighthizer-announce
.
U.S. Trade
Representative (USTR). “U.S.-EU Joint Report on T-TIP Progress to Date.” Press
release, January 17, 2017.
https://ustr.gov/about-us/policy-offices/press-office/press-releases/2017/january/us-eu-joint-report-t-tip-progress-0
.
U.S. Trade
Representative (USTR).
U.S. Generalized
System of Preferences (GSP) Guidebook
, August 2017.
https://ustr.gov/sites/default/files/files/gsp/GSP%20Guidebook%20August%202017_1.pdf
.
U.S. Trade
Representative (USTR). “U.S.-Nepal Joint Statement on 3rd Trade and Investment
Framework Council Meeting.” Press release, April 20, 2017.
https://ustr.gov/about-us/policy-offices/press-office/press-releases/2017/april/us-nepal-joint-statement-3rd-trade
.
U.S. Trade
Representative (USTR). “U.S. Trade Representative Ron Kirk Notifies Congress of
Intent to Negotiate New International Trade Agreement on Services.” Press
release, January 15, 2013.
https://ustr.gov/about-us/policy-offices/press-office/press-releases/2013/january/ustr-kirk-notifies-congress-new-itas-negotiationshttps://ustr.gov/about-us/policy-offices/press-office/press-releases/2013/january/ustr-kirk-notifies-congress-new-itas-negotiations
.
U.S. Trade
Representative (USTR). “USTR Announces Initiation of Section 301 Investigation
of China.” Press release, August 2017.
https://ustr.gov/sites/default/files/Section%20301%20FINAL.PDF
.
U.S. Trade
Representative (USTR). “USTR Announces New GSP Eligibility Reviews of India,
Indonesia, and Kazakhstan.” Press release, April 2018.
https://ustr.gov/about-us/policy-offices/press-office/press-releases/2018/april/ustr-announces-new-gsp-eligibility
.
U.S. Trade
Representative (USTR). “USTR Announces Unprecedented Action to Block Illegal
Timber Imports from Peru.” Press release, October 19, 2017.
https://ustr.gov/about-us/policy-offices/press-office/press-releases/2017/october/ustr-announces-unprecedented-action
.
U.S. Trade
Representative (USTR). “USTR Calls a Special Session under the U.S.-Korea Free
Trade Agreement.” Press release, July 12, 2017.
https://ustr.gov/about-us/policy-offices/press-office/press-releases/2017/july/ustr-calls-special-session-under-us
.
U.S. Trade
Representative (USTR). “USTR Extends Public Comment Period for NAFTA Renegotiations
Objectives.” Press release, June 13, 2017.
https://ustr.gov/about-us/policy-offices/press-office/press-releases/2017/june/ustr-extends-public-comment-period
.
U.S. Trade
Representative (USTR). “USTR Lighthizer Announces Results of Special 301
Out-of-Cycle Review of Thailand.” Press release, December 15, 2017.
https://ustr.gov/about-us/policy-offices/press-office/press-releases/2017/december/ustr-lighthizer-announces-results#
.
U.S. Trade
Representative (USTR). “USTR Lighthizer Statement on the Conclusion of the
Second Special Session of the U.S.-Korea FTA Joint Committee.” Press release,
October 4, 2017.
https://ustr.gov/about-us/policy-offices/press-office/press-releases/2017/october/ustr-lighthizer-statement
.
U.S. Trade
Representative (USTR). “USTR Lighthizer Statement on the Conclusion of the
Special Session of the US-Korea FTA Joint Committee.” Press release, August 22,
2017.
https://ustr.gov/about-us/policy-offices/press-office/press-releases/2017/august/ustr-lighthizer-statement-conclusion
.
U.S. Trade
Representative (USTR). “USTR Lighthizer Statement on the President’s New
Paradigm for US-Indo-Pacific Trade.” Press release, November 10, 2017.
https://ustr.gov/about-us/policy-offices/press-office/press-releases/2017/november/ustr-lighthizer-statement
.
U.S. Trade
Representative (USTR). “USTR Releases 2017 Special 301 Report on Intellectual
Property Rights.” Press release, April 28, 2017.
https://ustr.gov/about-us/policy-offices/press-office/press-releases/2017/april/ustr-releases-2017-special-301-report
.
U.S. Trade
Representative (USTR). “USTR: Trump Administration Announces Intent to
Renegotiate the North American Free Trade Agreement.” Press release, May 18,
2017.
https://ustr.gov/about-us/policy-offices/press-office/press-releases/2017/may/ustr-trump-administration-announces
.
VietNamNet.
“Vietnam, US hold Trade Meeting in Washington,” May 31, 2017.
http://english.vietnamnet.vn/fms/business/179444/vietnam--us-hold-trade-meeting-in-washington.html
.
Wall, Anne, and
Mike Harney. Letters (identical) to Richard Shelby, Sherrod Brown, Orrin Hatch,
Ron Wyden, Jeb Hensarling, Maxine Waters, Kevin Brady, and Sander Levin
(members of the Senate Finance Committee and of the U. S. House of
Representatives Committee on Ways and Means) from the Department of the
Treasury (U.S. Treasury) and the Office of the U.S. Trade Representative
(USTR), November 20, 2015.
https://www.treasury.gov/initiatives/fio/reports-and-notices/Documents/Covered%20Agreement%20Letters%20to%20Congress.pdf
.
Washington Trade Daily
. “Buenos Aires a
Bust.” Vol. 26, no. 249, December 14, 2017.
White House.
“Joint Press Release by the United States of America and the Republic of
Korea.” Press release, November 8, 2017.
https://www.whitehouse.gov/briefings-statements/joint-press-release-united-states-america-republic-korea/
.
White House.
“Joint Statement between the United States and the Republic of Korea.” Press
release, June 30, 2017.
https://www.whitehouse.gov/briefings-statements/joint-statement-united-states-republic-korea/
.
White House.
“Joint Statement from President Donald J. Trump and Prime Minister Shinzo Abe.”
Press release, February 10, 2017.
https://www.whitehouse.gov/briefings-statements/joint-statement-president-donald-j-trump-prime-minister-shinzo-abe/
.
White House.
“Joint Statement from Vice President Mike Pence and Deputy Prime Minister Taro
Aso on the Second Round of the U.S.-Japan Economic Dialogue.” Press release,
October 16, 2017.
https://www.whitehouse.gov/briefings-statements/joint-press-release-vice-president-mike-pence-deputy-prime-minister-taro-aso-second-round-u-s-japan-economic-dialogue/
.
White House.
“President Donald J. Trump’s Visit to Asia Advanced America First Priorities.”
Press release, November 15, 2017.
https://www.whitehouse.gov/briefings-statements/president-donald-j-trumps-visit-asia-advanced-america-first-priorities/
.
World Trade
Online. “Lighthizer: TISA an ‘Important’ Agreement Now under Review.”
Inside U.S. Trade
, vol. 35, no. 25, June
22, 2017.
https://insidetrade.com/inside-us-trade/lighthizer-tisa-important-agreement-now-under-review
.
World Trade
Online. “U.S. Remains Silent as WTO Members Look for Ways to Resume EGA Talks.”
Inside U.S. Trade
, vol. 35, no. 25,
June 22, 2017.
https://insidetrade.com/inside-us-trade/us-remains-silent-wto-members-look-ways-resume-ega-talks
.
World Trade
Online. “USTR to Request First-ever KORUS Joint Committee Special Session to
Amend Agreement.” Daily News, July 3, 2017.
https://insidetrade.com/daily-news/ustr-request-first-ever-korus-joint-committee-special-session-amend-agreement
.
World Trade
Organization (WTO). “3. Protocol Amending the Marrakesh Agreement Establishing
the World Trade Organization––Agreement on Trade Facilitation.” WT/GC/M/166,
May 3, 2017.
https://docs.wto.org/dol2fe/Pages/SS/directdoc.aspx?filename=q:/WT/GC/M166.pdf
.
World Trade
Organization (
WTO).
“About the Facility,” n.d.
http://www.tfafacility.org/about-the-facility
(accessed June 26, 2018).
World Trade
Organization (WTO). “Agreement on Trade in Civil Aircraft,” n.d.
https://www.wto.org/english/tratop_e/civair_e/civair_e.htm
(accessed February 28, 2018).
World Trade
Organization (WTO). “Briefing Note: The Expansion of Trade in Information
Technology Products (ITA Expansion),” December 16, 2015.
https://www.wto.org/english/news_e/news15_e/itabriefingnotes161215_e.pdf
.
World Trade
Organization (WTO). “Dispute Settlement: Chronological List of Dispute
Settlement Cases.” Trade Topics.
https://www.wto.org/english/Tratop_e/dispu_e/dispu_status_e.htm
(accessed April 8, 2018).
World Trade
Organization (WTO). “Dispute Settlement: DS26; European Communities—Measures
Concerning Meat and Meat Products.” Trade Topics.
https://www.wto.org/english/tratop_e/dispu_e/cases_e/ds26_e.htm
(accessed March 6, 2017).
World Trade
Organization (WTO). “Dispute Settlement: DS381; United States—Measures
Concerning the Importation, Marketing and Sale of Tuna and Tuna Products.”
Trade Topics.
https://www.wto.org/english/tratop_e/dispu_e/cases_e/ds381_e.htm
(accessed May 8, 2018).
World Trade Organization (WTO). “Dispute
Settlement: DS427; China—Anti-Dumping and Countervailing Duty Measures on
Broiler Products from the United States.” Trade Topics.
https://www.wto.org/english/tratop_e/dispu_e/cases_e/ds427_e.htm
(accessed May 30, 2018).
World Trade
Organization (WTO). “Dispute Settlement: DS430; India—Measures Concerning the
Importation of Certain Agricultural Products.” Trade Topics.
https://www.wto.org/english/tratop_e/dispu_e/cases_e/ds430_e.htm
(accessed March 23, 2018).
World Trade
Organization (WTO). “Dispute Settlement: DS456; India—Certain Measures Relating
to Solar Cells and Solar Modules.” Trade Topics.
https://www.wto.org/english/tratop_e/dispu_e/cases_e/ds456_e.htm
(accessed March 23, 2018).
World Trade
Organization (WTO). “Dispute Settlement: DS464; United States—Anti-dumping and
Countervailing Measures on Large Residential Washers from Korea.” Trade Topics.
https://www.wto.org/english/tratop_e/dispu_e/cases_e/ds464_e.htm
(accessed April 9, 2018).
World Trade Organization (WTO). “Dispute Settlement:
DS471; United States—Certain Methodologies and their Application to
Anti-dumping Proceedings Involving China.” Trade Topics.
https://www.wto.org/english/tratop_e/dispu_e/cases_e/ds471_e.htm
(accessed May 2, 2018).
World Trade Organization (WTO). “Dispute
Settlement: DS478; Indonesia—Importation of Horticultural Products, Animals and
Animal Products.” Trade Topics.
https://www.wto.org/english/tratop_e/dispu_e/cases_e/ds478_e.htm
(accessed May 2, 2018).
World Trade Organization (WTO). “Dispute
Settlement: DS487; United States—Conditional Tax Incentives for Large Civil
Aircraft.” Trade Topics.
https://www.wto.org/english/tratop_e/dispu_e/cases_e/ds487_e.htm
(accessed May 2, 2018).
World Trade
Organization (WTO). “Dispute Settlement: DS488; United States—Anti-dumping
Measures on Certain Oil Country Tubular Goods from Korea.” Trade Topics.
https://www.wto.org/english/tratop_e/dispu_e/cases_e/ds488_e.htm
(accessed April 9, 2018).
World Trade
Organization (WTO). “Dispute Settlement: DS491; United States—Anti-Dumping and
Countervailing Measures on Certain Coated Paper from Indonesia.” Trade Topics.
https://www.wto.org/english/tratop_e/dispu_e/cases_e/ds491_e.htm
(accessed May 19, 2018).
World Trade
Organization (WTO). “Dispute Settlement: DS503; United States—Measures
Concerning Non-Immigrant Visas.” Trade Topics.
https://www.wto.org/english/tratop_e/dispu_e/cases_e/ds503_e.htm
(accessed May 2, 2018).
World Trade
Organization (WTO). “Dispute Settlement: DS505; United States—Countervailing
Measures on Supercalendered Paper from Canada.” Trade Topics.
https://www.wto.org/english/tratop_e/dispu_e/cases_e/ds505_e.htm
(accessed May 2, 2018).
World Trade
Organization (WTO). “Dispute Settlement: DS510; United States—Certain Measures
Relating to the Renewable Energy Sector.” Trade Topics.
https://www.wto.org/english/tratop_e/dispu_e/cases_e/ds510_e.htm
(accessed March 23, 2018).
World Trade Organization (WTO). “Dispute
Settlement: DS511; China―Domestic Support for Agricultural Producers.”
Trade Topics.
https://www.wto.org/english/tratop_e/dispu_e/cases_e/ds511_e.htm
(accessed May 19, 2018).
World Trade Organization (WTO). “Dispute
Settlement: DS514; United States—Countervailing Measures on Cold- and
Hot-Rolled Steel Flat Products from Brazil.” Trade Topics.
https://www.wto.org/english/tratop_e/dispu_e/cases_e/ds514_e.htm
(accessed May 8, 2018).
World Trade
Organization (WTO). “Dispute Settlement: DS517; China―Tariff Rate Quotas
for Certain Agricultural Products.” Trade Topics.
https://www.wto.org/english/tratop_e/dispu_e/cases_e/ds517_e.htm
(accessed May 19, 2018).
World Trade
Organization (WTO). “Dispute Settlement: DS519; China―Subsidies to
Producers of Primary Aluminum.” Trade Topics.
https://www.wto.org/english/tratop_e/dispu_e/cases_e/ds519_e.htm
(accessed March 1, 2018).
World Trade
Organization (WTO). “Dispute Settlement: DS520; Canada—Measures Governing the
Sale of Wine in Grocery Stores.” Trade Topics.
https://www.wto.org/english/tratop_e/dispu_e/cases_e/ds520_e.htm
(accessed May 2, 2018).
World Trade
Organization (WTO). “Dispute Settlement: DS523; United States—Countervailing
Measures on Certain Pipe and Tube Products (Turkey).” Trade Topics.
https://www.wto.org/english/tratop_e/dispu_e/cases_e/ds523_e.htm
(accessed May 2, 2018).
World Trade
Organization (WTO). “Dispute Settlement: DS531; Canada—Measures Governing the
Sale of Wine in Grocery Stores (second complaint).” Trade Topics.
https://www.wto.org/english/tratop_e/dispu_e/cases_e/ds531_e.htm
(accessed May 2, 2018).
World Trade
Organization (WTO). “Dispute Settlement: DS533; United States—Countervailing
Measures on Softwood Lumber from Canada.” Trade Topics.
https://www.wto.org/english/tratop_e/dispu_e/cases_e/ds533_e.htm
(accessed May 2, 2018).
World Trade
Organization (WTO). “Dispute Settlement: DS534; United States—Anti-Dumping
Measures Applying Differential Pricing Methodology to Softwood Lumber from
Canada.” Trade Topics.
https://www.wto.org/english/tratop_e/dispu_e/cases_e/ds534_e.htm
(accessed May 2, 2018).
World Trade
Organization (WTO). “Dispute Settlement: DS535; United States—Certain Systemic
Trade Remedies Measures.” Trade Topics.
https://www.wto.org/english/tratop_e/dispu_e/cases_e/ds535_e.htm
(accessed May 2, 2018).
World Trade
Organization (WTO). “Draft Decision Agreed on “Non-violation” Cases in
Intellectual Property.” News release, November 23, 2015.
https://www.wto.org/english/news_e/news15_e/trip_ss_23nov15_e.htm
.
World Trade Organization (WTO). “Eleventh Ministerial
Conference—Closing Statement by the Chairperson.” WT/MIN(17)/67, December 20,
2017.
https://www.wto.org/english/thewto_e/minist_e/mc11_e/documents_e.htm
.
World Trade
Organization (WTO). “Eleventh Session of the Ministerial
Conference––Ministerial Ends with Decisions on Fish Subsidies, E-commerce
Duties; Ongoing Work Continues.” News release, December 13, 2017.
https://www.wto.org/english/news_e/news17_e/mc11_13dec17_e.htm
.
World Trade
Organization (WTO). “Eleventh Session of the Ministerial Conference––Request
for Observer Status by the Republic of South Sudan.” WT/L/1022, November 16,
2017.
https://docs.wto.org/dol2fe/Pages/FE_Search/FE_S_S005.aspx
.
World Trade
Organization (WTO). “Environmental Goods Agreement (EGA).” Trade Topics.
https://www.wto.org/english/tratop_e/envir_e/ega_e.htm
(accessed February 28, 2018).
World Trade
Organization (WTO). “Government Procurement––Agreement on Government
Procurement.” Trade Topics.
https://www.wto.org/english/tratop_e/gproc_e/gp_gpa_e.htm
(accessed February 28, 2018).
World Trade
Organization (WTO). “Information Technology.”
https://www.wto.org/english/tratop_e/inftec_e/inftec_e.htm
(accessed February 28, 2018).
World Trade
Organization (WTO). “Information Technology Agreement––Majority of Participants
Have Now Implemented ITA Expansion Commitments.” News release, November 1,
2016.
https://www.wto.org/english/news_e/news16_e/ita_01nov16_e.htm
.
World Trade
Organization (WTO). “Information Technology: Introduction; Information
Technology Agreement––An Explanation.” Trade Topics.
https://www.wto.org/english/tratop_e/inftec_e/itaintro_e.htm
(accessed February 28, 2018).
World Trade
Organization (WTO). “MC11 in Brief––Electronic Commerce.” Briefing note.
https://www.wto.org/english/thewto_e/minist_e/mc11_e/briefing_notes_e/bfecom_e.htm
(accessed February 28, 2018).
World Trade
Organization (WTO). “MC11 in Brief––Negotiations on Fisheries Subsidies.”
Briefing note.
https://www.wto.org/english/thewto_e/minist_e/mc11_e/briefing_notes_e/bffish_e.htm
(accessed February 28, 2018).
World Trade
Organization (
WTO). “
Members
Accepting the Protocol of Amendment to Insert the WTO Trade Facilitation
Agreement into Annex 1A of the WTO Agreement,”
n.d.
https://www.wto.org/english/tratop_e/tradfa_e/tradfa_agreeacc_e.htm
(accessed July 25, 2018).
World Trade Organization (WTO). “Message from
Director-General Roberto Azevêdo.”
Annual
Report—2018
, May 31, 2018.
https://www.wto.org/english/res_e/publications_e/anrep18_e.htm
.
World Trade
Organization (WTO). “Ministerial Conferences.”
https://www.wto.org/english/thewto_e/minist_e/minist_e.htm
(accessed February 28, 2018).
World Trade
Organization (WTO). “Ministerial Conferences––Eleventh WTO Ministerial
Conference.” Briefing note.
https://www.wto.org/english/thewto_e/minist_e/mc11_e/mc11_e.htm
(accessed February 28, 2018)
.
World Trade
Organization (WTO). “Ministerial Ends with Decisions on Fish Subsidies,
E-commerce Duties; Ongoing Work Continues.” News release, December 13, 2017.
https://www.wto.org/english/news_e/news17_e/mc11_13dec17_e.htm
.
World Trade
Organization (WTO). “Tenth WTO Ministerial Conference, Nairobi, 2015––Briefing
Note: WTO Agreement on Government Procurement.” Briefing note.
https://www.wto.org/english/thewto_e/minist_e/mc10_e/briefing_notes_e/brief_gpa_e.htm
(accessed February 28, 2018).
World Trade
Organization (WTO). “Trade Facilitation.”
https://www.wto.org/english/tratop_e/tradfa_e/tradfa_e.htm
(accessed March 20, 2018).
World Trade
Organization (WTO). “Trade Facilitation: Agreement––Members Accepting the
Protocol of Amendment to Insert the WTO Trade Facilitation Agreement into Annex
1A of the WTO Agreement.”
https://www.wto.org/english/tratop_e/tradfa_e/tradfa_agreeacc_e.htm
(accessed February 1, 2018).
World Trade
Organization (WTO).
Trade Policy Review:
Report by the Secretariat; Republic of Korea
. WTO report WT/TPR/S/346,
September 6, 2016.
https://www.wto.org/english/tratop_e/tpr_e/s346_e.pdf
.
World Trade
Organization (WTO). “Trade Topics: GATS Training Module; Chapter 1; Basic
Purpose and Concepts.”
https://www.wto.org/english/tratop_e/serv_e/cbt_course_e/c1s4p1_e.htm
(accessed May 7, 2018).
World Trade
Organization (WTO). “TRIPS: Reviews, Article 27.3(b) and Related Issues;
Background and the Current Situation.”
https://www.wto.org/english/Tratop_e/trips_e/art27_3b_background_e.htm
(accessed June 19, 2018).
World Trade
Organization (WTO). “Understanding the WTO: The Organization––Members and
Observers,”
https://www.wto.org/english/thewto_e/whatis_e/tif_e/org6_e.htm
(accessed February 28, 2018).
World Trade
Organization (WTO). “Work Programme on Electronic Commerce––Adopted by the
General Council on 25 September 1998.” WT/L/274, September 30, 1998.
https://www.wto.org/english/tratop_e/ecom_e/wkprog_e.htm
.
World Trade
Organization (WTO). “WTO: 2015 News Items––Information Technology
Agreement––WTO Members Conclude Landmark $1.3 trillion IT Trade Deal.” News
release, December 16, 2015.
https://www.wto.org/english/news_e/news15_e/ita_16dec15_e.htm
.
World
Trade Organization (WTO). “WTO Trade Facilitation Agreement.” Factsheet, n.d.
https://www.wto.org/english/tratop_e/tradfa_e/tfa_factsheet2017_e.pdf
(accessed March 29, 2018).
World Trade
Organization (WTO). Committee of Participants on the Expansion of Trade in
Information Technology Products. “Status of Implementation––Note by the Secretariat––Revision.”
G/IT/1/Rev.56, May 19, 2017.
https://docs.wto.org/dol2fe/Pages/SS/directdoc.aspx?filename=q:/G/IT/1R56.pdf
.
World Trade
Organization (WTO). Committee on Trade and Environment (CTE). “Report (2017) of
the Committee on Trade and Environment.” WT/CTE/24, November 28, 2017.
https://docs.wto.org/dol2fe/Pages/SS/directdoc.aspx?filename=q:/WT/CTE/24.pdf
.
World Trade
Organization (WTO). Committee on Trade and Environment (CTE). “Report of the
Meeting Held on 1 November 2017––Note by the Secretariat.” WT/CTE/M/64, January
17, 2018.
https://docs.wto.org/dol2fe/Pages/SS/directdoc.aspx?filename=q:/WT/CTE/M64.pdf
.
World
Trade Organization (
WTO). Committee on Trade Facilitation. “Draft— Report
(2017) of the Committee on Trade Facilitation to the Council for Trade in
Goods––Revision.” G/TFA/W/3/Rev.1, November 2, 2017.
https://docs.wto.org/dol2fe/Pages/FE_Search/FE_S_S009-DP.aspx?language=E&CatalogueIdList=239890&CurrentCatalogueIdIndex=0&FullTextHash=371857150&HasEnglishRecord=True&HasFrenchRecord=True&HasSpanishRecord=True
.
World Trade
Organization (WTO). Committee on Trade in Civil Aircraft. “Committee on Trade
in Civil Aircraft––Unofficial Room Document––Meeting to Be Held on 1 November
2017––Draft Annual Report.” RD/TCA/5, October 25, 2017.
https://docs.wto.org/dol2fe/Pages/FE_Search/FE_S_S006.aspx?Language=ENGLISH&SourcePage=FE_B_009&Context=Script&DataSource=Cat&Query=%40Symbol%3D%22RD%2FTCA%2F*%22&DisplayContext=popup&languageUIChanged=true#
.
World Trade
Organization (WTO). Committee on Trade in Civil Aircraft. “Report (2016) of the
Committee on Trade in Civil Aircraft––(Adopted 3 November 2016).”
WT/L/992––TCA/12, November 7, 2016.
https://docs.wto.org/dol2fe/Pages/FE_Search/DDFDocuments/232459/q/WT/L/992.pdf
.
World Trade
Organization (WTO). General Council––30 November–1 December 2017. “Draft Annual
Report (2017).” WT/GC/W/736, November 16, 2017.
https://docs.wto.org/dol2fe/Pages/FE_Search/DDFDocuments/240220/q/WT/GC/W736.pdf
.
World Trade
Organization (WTO). Ministerial Conference. Eleventh Session. Buenos Aires,
December 10–13, 2017. “Work Programme on Electronic Commerce––Ministerial
Decision of 13 December 2017.” WT/MIN(17)/65––WT/L/1032, December 18, 2017.
https://docs.wto.org/dol2fe/Pages/SS/directdoc.aspx?filename=q:/WT/MIN17/65.pdf
.
World Trade
Organization (WTO). Ministerial Conference. Singapore, December 9–13, 1996.
“Ministerial Declaration on Trade in Information Technology
Products––Singapore, 13 December 1996.” WT/MIN(96)/16, December 13, 1996.
https://www.wto.org/english/thewto_e/minist_e/min96_e/wtodec_e.htm
.
World Trade
Organization (WTO). Ministerial Conference. Tenth Session. Nairobi, December
15–18, 2015. “Work Programme on Electronic Commerce––Ministerial Decision of 19
December 2015.” WT/MIN(15)/42––WT/L/977, December 21, 2015.
https://docs.wto.org/dol2fe/Pages/SS/directdoc.aspx?filename=q:/WT/MIN15/42.pdf
.
Appendix A
Data Tables
Table
A.1
U.S. total exports to the world, by USITC
digest sector, 2015–17
|
Sector
|
Description
|
2015
|
2016
|
2017
|
2016–17
|
|
|
|
|
Million $
|
|
% change
|
|
1
|
Agricultural
products
|
146,644
|
148,683
|
153,116
|
3.0
|
|
2
|
Forest products
|
39,059
|
37,707
|
39,698
|
5.3
|
|
3
|
Chemicals
and related products
|
227,676
|
218,089
|
227,270
|
4.2
|
|
4
|
Energy-related products
|
110,225
|
98,418
|
143,236
|
45.5
|
|
5
|
Textiles
and apparel
|
23,272
|
21,656
|
22,082
|
2.0
|
|
6
|
Footwear
|
1,464
|
1,368
|
1,430
|
4.5
|
|
7
|
Minerals
and metals
|
135,667
|
128,684
|
136,452
|
6.0
|
|
8
|
Machinery
|
138,765
|
128,097
|
135,945
|
6.1
|
|
9
|
Transportation
equipment
|
327,401
|
320,022
|
325,434
|
1.7
|
|
10
|
Electronic products
|
264,119
|
260,407
|
268,278
|
3.0
|
|
11 |
Miscellaneous
manufactures
|
47,366
|
47,754
|
49,138
|
2.9
|
|
12
|
Special provisions
|
41,444
|
40,125
|
44,655
|
11.3
|
|
|
Total
|
1,503,101
|
1,451,011
|
1,546,733
|
6.6
|
Source:
USITC DataWeb/USDOC (accessed March 14, 2018).
Note:
Because of rounding, figures may not add up to totals shown.
Table
A.2
U.S. general imports from the world, by
USITC digest sector, 2015–17
|
Sector
|
Description
|
2015
|
2016
|
2017
|
2016–17
|
|
|
|
|
Million $
|
|
% change
|
|
1
|
Agricultural
products
|
136,947
|
139,153
|
147,406
|
5.9
|
|
2
|
Forest products
|
42,383
|
43,118
|
44,856
|
4.0
|
|
3
|
Chemicals
and related products
|
260,293
|
259,846
|
268,112
|
3.2
|
|
4
|
Energy-related products
|
194,132
|
157,826
|
198,096
|
25.5
|
|
5
|
Textiles
and apparel
|
126,538
|
120,265
|
121,423
|
1.0
|
|
6
|
Footwear
|
27,650
|
25,634
|
25,654
|
0.1
|
|
7
|
Minerals
and metals
|
189,230
|
183,522
|
200,714
|
9.4
|
|
8
|
Machinery
|
185,884
|
179,537
|
196,414
|
9.4
|
|
9
|
Transportation
equipment
|
426,225
|
418,286
|
434,894
|
4.0
|
|
10
|
Electronic products
|
449,793
|
449,951
|
484,271
|
7.6
|
|
11
|
Miscellaneous
manufactures
|
124,817
|
124,973
|
130,453
|
4.4
|
|
12
|
Special provisions
|
84,291
|
85,695
|
90,610
|
5.7
|
|
|
Total
|
2,248,183
|
2,187,805
|
2,342,905
|
7.1
|
Source:
USITC DataWeb/USDOC (accessed March 14, 2018).
Note:
Because of rounding, figures may not add up to totals shown.
Table
A.3
Leading U.S. total exports to the world, by
HTS 6-digit subheading, 2015–17
|
HTS 6
|
Description
|
2015
|
2016
|
2017
|
2016–17
|
|
|
|
|
Million $
|
|
% change
|
|
8800.00
|
Civilian
aircraft, engines, and parts
|
119,487
|
120,945
|
121,120
|
0.1
|
|
2710.19
|
Petroleum oils, oils from bituminous minerals (other
than crude) and products containing by weight 70% or more of these oils, not
biodiesel or waste
|
47,341
|
37,652
|
48,033
|
27.6
|
|
2710.12
|
Light
oils and preparations containing 70% by weight petroleum oils or oils from
bituminous minerals, not containing biodiesel, not waste oils
|
25,774
|
24,268
|
29,754
|
22.6
|
|
2709.00
|
Petroleum oils and oils from bituminous minerals,
crude
|
8,821
|
9,423
|
21,825
|
131.6
|
|
1201.90
|
Soybeans,
other than seed
|
18,878
|
22,821
|
21,591
|
-5.4
|
|
7108.12
|
Gold, nonmonetary, unwrought n.e.s.o.i. (other than
powder)
|
19,077
|
17,516
|
19,610
|
12.0
|
|
8703.24
|
Passenger
motor vehicles with spark-ignition internal combustion reciprocating piston
engine, cylinder capacity over 3,000 cc
|
20,671
|
18,605
|
19,168
|
3.0
|
|
8542.31
|
Processors and controllers, electronic integrated
circuits
|
18,153
|
19,849
|
18,962
|
-4.5
|
|
8703.23
|
Passenger
motor vehicles with spark-ignition internal combustion reciprocating piston
engine, cylinder capacity over 1,500 cc but not over 3,000 cc
|
21,754
|
21,928
|
18,664
|
-14.9
|
|
7102.39
|
Diamonds, nonindustrial, worked, including polished
or drilled
|
18,323
|
18,845
|
18,019
|
-4.4
|
|
8517.62
|
Machines
for the reception, conversion and transmission or regeneration of voice,
images or other data, including switching and routing apparatus
|
18,506
|
18,856
|
17,572
|
-6.8
|
|
3004.90
|
Medicaments, in measured doses, etc. (excluding
vaccines, etc., coated bandages etc., and pharmaceutical goods), n.e.s.o.i.
|
20,684
|
19,174
|
17,066
|
-11.0
|
|
8473.30
|
Parts
and accessories for automatic data processing machines and units thereof,
magnetic or optical readers, transcribing machines, etc., n.e.s.o.i.
|
15,699
|
15,501
|
15,542
|
0.3
|
|
8486.20
|
Machines and apparatus for the manufacture of
semiconductor devices or of electronic integrates circuits
|
8,237
|
8,830
|
12,489
|
41.4
|
|
9018.90
|
Instruments
and appliances for medical, surgical or veterinary sciences, n.e.s.o.i., and
parts and accessories thereof
|
11,864
|
12,333
|
12,340
|
0.1
|
|
|
Total of
items shown
|
393,269
|
386,545
|
411,755
|
6.5
|
|
|
All
other products
|
1,109,832
|
1,064,465
|
1,134,977
|
6.6
|
|
|
Total of
all commodities
|
1,503,101
|
1,451,011
|
1,546,733
|
6.6
|
Source:
USITC DataWeb/USDOC (accessed March 14, 2018).
Note:
Data reflect shipments under HTS chapters 1–97. Because of rounding, figures
may not add up to totals shown. N.e.s.o.i. = not elsewhere specified or
included; cc = cubic centimeter.
Table
A.4
Leading U.S. general imports from the
world, by HTS subheading, 2015–17
|
HTS 6
|
Description
|
2015
|
2016
|
2017
|
2016–17
|
|
|
|
|
Million $
|
|
% change
|
|
2709.00
|
Petroleum
oils and oils from bituminous minerals, crude
|
126,073
|
101,841
|
132,945
|
30.5
|
|
8703.23
|
Passenger motor vehicles with spark-ignition
internal combustion reciprocating piston engine, cylinder capacity over 1,500
cc but not over 3,000 cc
|
97,427
|
106,342
|
101,620
|
-4.4
|
|
8517.12
|
Telephones
for cellular networks or for other wireless networks
|
52,707
|
49,795
|
55,944
|
12.3
|
|
3004.90
|
Medicaments, in measured doses, etc. (excluding
vaccines, etc., coated bandages etc., and pharmaceutical goods), n.e.s.o.i.
|
47,880
|
51,062
|
50,270
|
-1.5
|
|
8517.62
|
Machines
for the reception, conversion and transmission or regeneration of voice,
images or other data, including switching and routing apparatus
|
40,015
|
45,393
|
47,373
|
4.4
|
|
8703.24
|
Passenger motor vehicles with spark-ignition
internal combustion reciprocating piston engine, cylinder capacity over 3,000
cc
|
57,659
|
50,088
|
47,117
|
-5.9
|
|
8471.30
|
Portable
automatic data processing machines, weight not more than 10 kg, consisting of
at least a central processing unit, keyboard & a display
|
39,244
|
35,861
|
39,990
|
11.5
|
|
2710.19
|
Petroleum oils, oils from bituminous minerals (other
than crude) and products containing by weight 70% or more of these oils, not
biodiesel or waste
|
29,319
|
21,830
|
27,003
|
23.7
|
|
8471.50
|
Digital
processing units other than those of 8471.41 and 8471.49, n.e.s.o.i.
|
17,837
|
19,630
|
23,423
|
19.3
|
|
8473.30
|
Parts and accessories for automatic data processing
machines and units thereof, magnetic or optical readers, transcribing
machines, etc., n.e.s.o.i.
|
16,617
|
15,198
|
21,946
|
44.4
|
|
7102.39
|
Diamonds,
nonindustrial, worked, including polished or drilled
|
23,086
|
23,024
|
21,624
|
-6.1
|
|
8542.31
|
Processors and controllers, electronic integrated
circuits
|
18,171
|
20,887
|
21,079
|
0.9
|
|
2710.12
|
Light
oils and preparations containing 70% by weight petroleum oils or oils from
bituminous minerals, not containing biodiesel, not waste oils
|
19,684
|
17,307
|
19,057
|
10.1
|
|
8703.22
|
Passenger motor vehicles with spark-ignition
internal combustion reciprocating piston engine, cylinder capacity over 1,000
cc but not over 1,500 cc
|
7,016
|
10,962
|
15,994
|
45.9
|
|
8704.31
|
Motor
vehicles for goods transport n.e.s.o.i., with spark-ignition internal
combustion piston engine, gvw not over 5 metric tons
|
13,516 |
15,889
|
15,826
|
-0.4
|
|
|
Total of
items shown
|
606,252
|
585,111
|
641,210
|
9.6
|
|
|
All
other products
|
1,641,931
|
1,602,693
|
1,701,695
|
6.2
|
|
|
Total of
all commodities
|
2,248,183
|
2,187,805
|
2,342,905
|
7.1
|
Source:
USITC DataWeb/USDOC (accessed March 14, 2018).
Note: Data reflect shipments under HTS chapters 1–97.
Because of rounding, figures may not add up to totals shown. N.e.s.o.i. = not
elsewhere specified or included; cc = cubic centimeter; GVW = gross vehicle
weight.
Table
A.5
U.S. merchandise trade with top 15
single-country trading partners, 2017
|
Rank
|
Country
|
Total exports
|
General imports
|
Total
|
% of total trade
|
|
|
|
|
Million $
|
|
|
|
1
|
China
|
130,370
|
505,597
|
635,967
|
16.4
|
|
2
|
Canada
|
282,472
|
299,975
|
582,447
|
15.0
|
|
3 |
Mexico
|
242,989
|
314,045
|
557,034
|
14.3
|
|
4
|
Japan
|
67,696
|
136,544
|
204,239
|
5.3
|
|
5
|
Germany
|
53,493
|
117,745
|
171,238
|
4.4
|
|
6
|
South Korea
|
48,277
|
71,164
|
119,441
|
3.1
|
|
7
|
United
Kingdom
|
56,329
|
53,075
|
109,404
|
2.8
|
|
8
|
France
|
33,582
|
48,888
|
82,469
|
2.1
|
|
9
|
India
|
25,700
|
48,631
|
74,332
|
1.9
|
|
10
|
Italy
|
18,323
|
49,963
|
68,286
|
1.8
|
|
11
|
Taiwan
|
25,754
|
42,492
|
68,246
|
1.8
|
|
12
|
Ireland
|
10,737
|
48,844
|
59,580
|
1.5
|
|
13
|
Switzerland
|
21,694
|
36,002
|
57,696
|
1.5
|
|
14
|
Vietnam
|
8,164
|
46,483
|
54,647
|
1.4
|
|
15
|
Malaysia
|
12,826
|
37,409
|
50,235
|
1.3
|
|
|
Top 15
countries
|
1,038,404
|
1,856,857
|
2,895,261
|
74.4
|
|
|
All
others |
508,329
|
486,048
|
994,377
|
25.6
|
|
|
Total
|
1,546,733
|
2,342,905
|
3,889,638
|
100.0
|
Source:
USITC DataWeb/USDOC (accessed March 14, 2018).
Note:
Because of rounding, figures may not add up to totals shown.
Table
A.6
Top 15 U.S. single-country merchandise
export markets, 2017
|
Rank
|
Country
|
Million $
|
% of total exports
|
|
1
|
Canada
|
282,472
|
18.3
|
|
2
|
Mexico
|
242,989
|
15.7
|
|
3
|
China
|
130,370
|
8.4
|
|
4
|
Japan
|
67,696
|
4.4
|
|
5
|
United Kingdom
|
56,329
|
3.6
|
|
6
|
Germany
|
53,493
|
3.5
|
|
7
|
South Korea
|
48,277
|
3.1
|
|
8
|
Netherlands
|
42,230
|
2.7
|
|
9
|
Hong Kong
|
40,024
|
2.6
|
|
10
|
Brazil
|
37,077
|
2.4
|
|
11
|
France
|
33,582
|
2.2
|
|
12
|
Belgium
|
29,911
|
1.9
|
|
13
|
Singapore
|
29,753
|
1.9
|
|
14
|
Taiwan
|
25,754
|
1.7
|
|
15
|
India
|
25,700
|
1.7
|
|
|
Top 15 countries
|
1,145,656
|
74.1
|
|
|
All others
|
401,077
|
25.9
|
|
|
Total
|
1,546,733
|
100.0
|
Source:
USITC DataWeb/USDOC (accessed March 14, 2018).
Note:
Because of rounding, figures may not add up to totals shown.
Table
A.7
Top 15 U.S. single-country merchandise
import sources, 2017
|
Rank
|
Country
|
Million $
|
% of total imports
|
|
1
|
China
|
505,597
|
21.6
|
|
2
|
Mexico
|
314,045
|
13.4
|
|
3
|
Canada
|
299,975
|
12.8
|
|
4
|
Japan
|
136,544
|
5.8
|
|
5
|
Germany
|
117,745
|
5.0
|
|
6
|
South Korea
|
71,164
|
3.0
|
|
7
|
United Kingdom
|
53,075
|
2.3
|
|
8
|
Italy
|
49,963
|
2.1
|
|
9
|
France
|
48,888
|
2.1
|
|
10
|
Ireland
|
48,844
|
2.1
|
|
11
|
India
|
48,631
|
2.1
|
|
12
|
Vietnam
|
46,483
|
2.0
|
|
13
|
Taiwan
|
42,492
|
1.8
|
|
14
|
Malaysia
|
37,409
|
1.6
|
|
15
|
Switzerland
|
36,002
|
1.5
|
|
|
Top 15 countries
|
1,856,857
|
79.3
|
|
|
All others
|
486,048
|
20.8
|
|
|
Total
|
2,342,905
|
100.0
|
Source:
USITC DataWeb/USDOC (accessed March 14, 2018).
Note:
Because of rounding, figures may not add up to totals shown.
Table
A.8
U.S. private services exports to the world,
by category, 2015–17
|
Service industry
|
2015
|
2016
|
2017
|
2016–17
|
|
|
|
Million $
|
|
% change
|
|
Travel
|
205,418
|
205,940
|
203,696
|
-1.1
|
|
Charges for the use of intellectual property n.i.e.
|
124,442
|
124,453
|
127,935
|
2.8
|
|
Financial
services
|
102,595
|
98,180
|
106,424
|
8.4
|
|
Professional and management consulting services
|
66,784
|
74,021
|
78,732
|
6.4
|
|
Air
passenger fares
|
41,976
|
38,770
|
39,104
|
0.9
|
|
Research and development services
|
34,539
|
37,176
|
42,763
|
15.0
|
|
Technical,
trade-related, and other business services
|
35,299
|
31,034
|
32,964
|
6.2
|
|
Maintenance and repair services, n.i.e.
|
23,406
|
25,628
|
25,916
|
1.1
|
|
Air
transport
|
22,968
|
22,778
|
24,061
|
5.6
|
|
Sea transport
|
18,044
|
18,078
|
18,738
|
3.7
|
|
Insurance
services
|
16,229
|
16,348
|
17,815
|
9.0
|
|
Other
|
40,285
|
41,148
|
43,581
|
5.9
|
|
Total
|
731,985
|
733,554
|
761,729
|
3.8
|
Source:
USDOC, BEA, Interactive data, International Transactions, Services, & IIP,
International Transactions Data, “Table 3.1 U.S. International Trade in
Services,” March 21, 2018.
Note:
Data for 2017 are preliminary. N.i.e. = not indicated elsewhere. Because of
rounding, figures may not add up to totals shown.
Air
transport includes airport and air freight services.
Sea
transport includes sea port and sea freight services.
Table
A.9
U.S. private services imports from the
world, by category, 2015–17
|
Service industry
|
2015
|
2016
|
2017
|
2016–17
|
|
|
|
Million $
|
|
% change
|
|
Travel
|
114,723
|
123,618
|
135,209
|
9.4
|
|
Insurance services
|
47,822
|
48,077
|
49,698
|
3.4
|
|
Charges
for the use of intellectual property n.i.e.
|
39,858
|
44,392
|
48,354
|
8.9
|
|
Professional and management consulting services
|
40,423
|
40,169
|
42,906
|
6.8
|
|
Air
passenger fares
|
35,494
|
37,198
|
38,629
|
3.8
|
|
Sea transport
|
37,295
|
35,097
|
37,085
|
5.7
|
|
Research
and development services
|
32,202
|
34,243
|
34,922
|
2.0
|
|
Computer services
|
27,507
|
28,989
|
31,642
|
9.2
|
|
Financial
services
|
25,740
|
25,629
|
27,986
|
9.2
|
|
Technical, trade-related, and other business
services
|
27,040
|
24,510
|
26,945
|
9.9
|
|
Other
|
42,046
|
41,204
|
42,639
|
3.5
|
|
Travel
|
114,723
|
123,618
|
135,209
|
9.4
|
|
Total
|
470,148
|
483,126
|
516,015
|
6.8
|
Source:
USDOC, BEA, Interactive data, International Transactions, Services, & IIP,
International Transactions Data, “Table 3.1 U.S. International Trade in
Services,” March 21, 2018.
Note:
Data for 2017 are preliminary. N.i.e. = not indicated elsewhere. Because of
rounding, figures may not add up to totals shown.
Sea
transport includes sea port and sea freight services.
Table
A.10
Antidumping cases active in 2017, by USITC
investigation number
|
USITC investigation number
|
Product
|
Country of origin
|
Date of institution
|
USITC prelim
|
ITA
prelim
|
ITA final
|
USITC final
|
Date of final action
|
|
|
|
|
|
Affirmative = A; Negative = N
|
|
|
731-TA-1306
|
Large
residential washers
|
China
|
12/16/2015
|
A
|
A
|
A
|
A
|
1/30/2017
|
|
731-TA-1308
|
Pneumatic off-the-road (OTR) tires
|
India
|
1/8/2016
|
A
|
A
|
A
|
A
|
2/23/2017
|
|
731-TA-1309
|
Biaxial
integral geogrid products
|
China
|
1/13/2016
|
A
|
A
|
A
|
A
|
2/24/2017
|
|
731-TA-1310
|
Amorphous silica fabric
|
China
|
1/20/2016
|
A
|
A
|
A
|
A
|
3/10/2017
|
|
731-TA-1311
|
Truck
and bus tires
|
China
|
1/29/2016
|
A
|
A
|
A
|
N
|
3/13/2017
|
|
731-TA-1312
|
Stainless steel sheet and strip
|
China
|
2/12/2016
|
A
|
A
|
A
|
A
|
3/24/2017
|
|
731-TA-1313
|
1,1,1,2-Tetrafluoroethane
(R-134a)
|
China
|
3/3/2016
|
A
|
A
|
A
|
A
|
4/5/2017
|
|
731-TA-1314
|
Phosphor copper
|
South Korea
|
3/9/2016
|
A
|
A
|
A
|
A
|
4/17/2017
|
|
731-TA-1315
|
Ferrovanadium
|
South
Korea
|
3/28/2016
|
A
|
A
|
A
|
A
|
5/8/2017
|
|
731-TA-1316
|
1-hydroxyethylidene-1, 1-diphosphonic acid (HEDP)
|
China
|
3/31/2016
|
A
|
A
|
A
|
A
|
5/8/2017
|
|
731-TA-1317
|
Carbon
and alloy steel cut-to-length plate
|
Austria
|
4/8/2016
|
A
|
A
|
A
|
A
|
5/18/2017
|
|
731-TA-1318
|
Carbon and alloy steel cut-to-length plate
|
Belgium
|
4/8/2016
|
A
|
A
|
A
|
A
|
5/18/2017
|
|
731-TA-1319
|
Carbon
and alloy steel cut-to-length plate
|
Brazil
|
4/8/2016
|
A
|
A
|
A
|
A
|
1/19/2017
|
|
731-TA-1320
|
Carbon and alloy steel cut-to-length plate
|
China
|
4/8/2016
|
A
|
A
|
A
|
A
|
3/13/2017
|
|
731-TA-1321
|
Carbon
and alloy steel cut-to-length plate
|
France
|
4/8/2016
|
A
|
A
|
A
|
A
|
5/18/2017
|
|
731-TA-1322
|
Carbon and alloy steel cut-to-length plate
|
Germany
|
4/8/2016
|
A
|
A
|
A
|
A
|
5/18/2017
|
|
731-TA-1323
|
Carbon
and alloy steel cut-to-length plate
|
Italy
|
4/8/2016
|
A
|
A
|
A
|
A
|
5/18/2017
|
|
731-TA-1324
|
Carbon and alloy steel cut-to-length plate
|
Japan
|
4/8/2016
|
A
|
A
|
A
|
A
|
5/18/2017
|
|
731-TA-1325
|
Carbon
and alloy steel cut-to-length plate
|
South
Korea
|
4/8/2016
|
A
|
A
|
A
|
A
|
5/18/2017
|
|
731-TA-1326
|
Carbon and alloy steel cut-to-length plate
|
South Africa
|
4/8/2016
|
A
|
A
|
A
|
A
|
1/19/2017
|
|
731-TA-1327
|
Carbon
and alloy steel cut-to-length plate
|
Taiwan
|
4/8/2016
|
A
|
A
|
A
|
A
|
5/18/2017
|
|
731-TA-1328
|
Carbon and alloy steel cut-to-length plate
|
Turkey
|
4/8/2016
|
A
|
A
|
A
|
A
|
1/19/2017
|
|
731-TA-1329
|
Ammonium
sulfate
|
China
|
5/25/2016
|
A
|
A
|
A
|
A
|
3/2/2017
|
|
731-TA-1330
|
Dioctyl terephthalate (DOTP)
|
South Korea
|
6/30/2016
|
A
|
A
|
A
|
A
|
8/9/2017
|
|
731-TA-1331
|
Finished
carbon steel flanges
|
India
|
6/30/2016
|
A
|
A
|
A
|
A
|
8/14/2017
|
|
731-TA-1332
|
Finished carbon steel flanges
|
Italy
|
6/30/2016
|
A
|
A
|
A
|
A
|
8/14/2017
|
|
731-TA-1333
|
Finished
carbon steel flanges
|
Spain
|
6/30/2016
|
A
|
A
|
A
|
A
|
6/7/2017
|
|
731-TA-1334
|
Emulsion styrene-butadiene rubber
|
Brazil
|
7/21/2016
|
A
|
A
|
A
|
A
|
8/25/2017
|
|
731-TA-1335
|
Emulsion
styrene-butadiene rubber
|
South Korea
|
7/21/2016
|
A
|
A
|
A
|
A
|
8/25/2017
|
|
731-TA-1336
|
Emulsion styrene-butadiene rubber
|
Mexico
|
7/21/2016
|
A
|
A
|
A
|
A
|
8/25/2017
|
|
731-TA-1337
|
Emulsion
styrene-butadiene rubber
|
Poland
|
7/21/2016
|
A
|
A
|
A
|
A
|
8/25/2017
|
|
731-TA-1338
|
Steel concrete reinforcing bar (rebar)
|
Japan
|
9/20/2016
|
A
|
A
|
A
|
A
|
6/30/2017
|
|
731-TA-1339
|
Steel
concrete reinforcing bar (rebar)
|
Taiwan
|
9/20/2016
|
A
|
A
|
A
|
A
|
9/11/2017
|
|
731-TA-1340
|
Steel concrete reinforcing bar (rebar)
|
Turkey
|
9/20/2016
|
A
|
A
|
A
|
A
|
6/30/2017
|
|
731-TA-1341
|
Hardwood
plywood
|
China
|
11/18/2016
|
A
|
A
|
A
|
A
|
12/20/2017
|
|
731-TA-1342
|
Softwood lumber
|
Canada
|
11/25/2016
|
A
|
A
|
A
|
A
|
12/22/2017
|
|
731-TA-1343
|
Silicon
metal
|
Australia
|
3/8/2017
|
A
|
A
|
(
)
|
(
)
|
(
)
|
|
731-TA-1344
|
Silicon metal
|
Brazil
|
3/8/2017
|
A
|
A
|
(
)
|
(
)
|
(
)
|
|
731-TA-1345
|
Silicon
metal
|
Norway
|
3/8/2017
|
A
|
A
|
(
)
|
(
)
|
(
)
|
|
731-TA-1346
|
Aluminum foil
|
China
|
3/9/2017
|
A
|
A
|
(
)
|
(
)
|
(
)
|
|
731-TA-1347
|
Biodiesel
|
Argentina
|
3/23/2017
|
A
|
A
|
(
)
|
(
)
|
(
)
|
|
731-TA-1348
|
Biodiesel
|
Indonesia
|
3/23/2017
|
A
|
A
|
(
)
|
(
)
|
(
)
|
|
731-TA-1349
|
Wire
rod
|
Belarus
|
3/28/2017
|
A
|
A
|
A
|
(
)
|
(
)
|
|
731-TA-1350
|
Wire rod
|
Italy
|
3/28/2017
|
A
|
A
|
(
)
|
(
)
|
(
)
|
|
731-TA-1351
|
Wire
rod
|
South
Korea
|
3/28/2017
|
A
|
A
|
(
)
|
(
)
|
(
)
|
|
731-TA-1352
|
Wire rod
|
Russia
|
3/28/2017
|
A
|
A
|
A
|
(
)
|
(
)
|
|
731-TA-1353
|
Wire
rod
|
South
Africa
|
3/28/2017
|
A
|
A
|
(
)
|
(
)
|
(
)
|
|
731-TA-1354
|
Wire rod
|
Spain
|
3/28/2017
|
A
|
A
|
(
)
|
(
)
|
(
)
|
|
731-TA-1355
|
Wire
rod
|
Turkey
|
3/28/2017
|
A
|
A
|
(
)
|
(
)
|
(
)
|
|
731-TA-1356
|
Wire rod
|
Ukraine
|
3/28/2017
|
A
|
A
|
(
)
|
(
)
|
(
)
|
|
731-TA-1357
|
Wire
rod
|
United
Arab Emirates
|
3/28/2017
|
A
|
A
|
A
|
(
)
|
(
)
|
|
731-TA-1358
|
Wire rod
|
United Kingdom
|
3/28/2017
|
A
|
A
|
(
)
|
(
)
|
(
)
|
|
731-TA-1359
|
Carton
closing staples
|
China
|
3/31/2017
|
A
|
A
|
(
)
|
(
)
|
(
)
|
|
731-TA-1360
|
Tool chests
|
China
|
4/11/2017
|
A
|
A
|
(
)
|
(
)
|
(
)
|
|
731-TA-1361
|
Tool
chests
|
Vietnam
|
4/11/2017
|
A
|
A
|
(
)
|
(
)
|
(
)
|
|
731-TA-1362
|
Cold-drawn mechanical tubing
|
China
|
4/19/2017
|
A
|
A
|
(
)
|
(
)
|
(
)
|
|
731-TA-1363
|
Cold-drawn
mechanical tubing
|
Germany
|
4/19/2017
|
A
|
A
|
(
)
|
(
)
|
(
)
|
|
731-TA-1364
|
Cold-drawn mechanical tubing
|
India
|
4/19/2017
|
A
|
A
|
(
)
|
(
)
|
(
)
|
|
731-TA-1365
|
Cold-drawn
mechanical tubing
|
Italy
|
4/19/2017
|
A
|
A
|
(
)
|
(
)
|
(
)
|
|
731-TA-1366
|
Cold-drawn mechanical tubing
|
South Korea
|
4/19/2017
|
A
|
A
|
(
)
|
(
)
|
(
)
|
|
731-TA-1367
|
Cold-drawn
mechanical tubing
|
Switzerland
|
4/19/2017
|
A
|
A
|
(
)
|
(
)
|
(
)
|
|
731-TA-1368
|
100- to 150-seat large civil aircraft
|
Canada
|
4/27/2017
|
A
|
A
|
A
|
(
)
|
(
)
|
|
731-TA-1369
|
Fine
denier polyester staple fiber
|
China
|
5/31/2017
|
A
|
(
)
|
(
)
|
(
)
|
(
)
|
|
731-TA-1370
|
Fine denier polyester staple fiber
|
India
|
5/31/2017
|
A
|
(
)
|
(
)
|
(
)
|
(
)
|
|
731-TA-1371
|
Fine
denier polyester staple fiber
|
South
Korea
|
5/31/2017
|
A
|
(
)
|
(
)
|
(
)
|
(
)
|
|
731-TA-1372
|
Fine denier polyester staple fiber
|
Taiwan
|
5/31/2017
|
A
|
(
)
|
(
)
|
(
)
|
(
)
|
|
731-TA-1373
|
Fine
denier polyester staple fiber
|
Vietnam
|
5/31/2017
|
(
)
|
(
)
|
(
)
|
(
)
|
(
)
|
|
731-TA-1374
|
Citric acid and certain citrate salts
|
Belgium
|
6/2/2017
|
A
|
(
)
|
(
)
|
(
)
|
(
)
|
|
731-TA-1375
|
Citric
acid and certain citrate salts
|
Colombia
|
6/2/2017
|
A
|
(
)
|
(
)
|
(
)
|
(
)
|
|
731-TA-1376
|
Citric acid and certain citrate salts
|
Thailand
|
6/2/2017
|
A
|
(
)
|
(
)
|
(
)
|
(
)
|
|
731-TA-1377
|
Ripe
olives
|
Spain
|
6/22/2017
|
A
|
(
)
|
(
)
|
(
)
|
(
)
|
|
731-TA-1378
|
Low melt polyester staple fiber
|
South Korea
|
6/27/2017
|
A
|
(
)
|
(
)
|
(
)
|
(
)
|
|
731-TA-1379
|
Low
melt polyester staple fiber
|
Taiwan
|
6/27/2017
|
A
|
(
)
|
(
)
|
(
)
|
(
)
|
|
731-TA-1380
|
Tapered roller bearings
|
South Korea
|
6/28/2017
|
A
|
(
)
|
(
)
|
(
)
|
(
)
|
|
731-TA-1381
|
Cast
iron soil pipe fittings
|
China
|
7/13/2017
|
A
|
(
)
|
(
)
|
(
)
|
(
)
|
|
731-TA-1382
|
Uncoated groundwood paper
|
Canada
|
8/9/2017
|
A
|
(
)
|
(
)
|
(
)
|
(
)
|
|
731-TA-1383
|
Stainless
steel flanges
|
China
|
8/16/2017
|
A
|
(
)
|
(
)
|
(
)
|
(
)
|
|
731-TA-1384
|
Stainless steel flanges
|
India
|
8/16/2017
|
A
|
(
)
|
(
)
|
(
)
|
(
)
|
|
731-TA-1385
|
Titanium
sponge
|
Japan
|
8/24/2017
|
N
|
(
)
|
(
)
|
(
)
|
10/10/2017
|
|
731-TA-1386
|
Titanium sponge
|
Kazakhstan
|
8/24/2017
|
N
|
(
)
|
(
)
|
(
)
|
10/10/2017
|
|
731-TA-1387
|
PET
resin
|
Brazil
|
9/26/2017
|
A
|
(
)
|
(
)
|
(
)
|
(
)
|
|
731-TA-1388
|
PET resin
|
Indonesia
|
9/26/2017
|
A
|
(
)
|
(
)
|
(
)
|
(
)
|
|
731-TA-1389
|
PET
resin
|
South
Korea
|
9/26/2017
|
A
|
(
)
|
(
)
|
(
)
|
(
)
|
|
731-TA-1390
|
PET resin
|
Pakistan
|
9/26/2017
|
A
|
(
)
|
(
)
|
(
)
|
(
)
|
|
731-TA-1391
|
PET
resin
|
Taiwan
|
9/26/2017
|
A
|
(
)
|
(
)
|
(
)
|
(
)
|
|
731-TA-1392
|
PFTE resin
|
China
|
9/28/2017
|
A
|
(
)
|
(
)
|
(
)
|
(
)
|
|
731-TA-1393
|
PFTE
resin
|
India
|
9/28/2017
|
A
|
(
)
|
(
)
|
(
)
|
(
)
|
|
731-TA-1394
|
Forged steel fittings
|
China
|
10/5/2017
|
A
|
(
)
|
(
)
|
(
)
|
(
)
|
|
731-TA-1395
|
Forged
steel fittings
|
Italy
|
10/5/2017
|
A
|
(
)
|
(
)
|
(
)
|
(
)
|
|
731-TA-1396
|
Forged steel fittings
|
Taiwan
|
10/5/2017
|
A
|
(
)
|
(
)
|
(
)
|
(
)
|
|
731-TA-1397
|
Sodium
gluconate
|
China
|
11/30/2017
|
(
)
|
(
)
|
(
)
|
(
)
|
(
)
|
|
731-TA-1398
|
Sodium gluconate
|
France
|
11/30/2017
|
(
)
|
(
)
|
(
)
|
(
)
|
(
)
|
|
731-TA-1399
|
Common
alloy aluminum sheet
|
China
|
12/1/2017
|
(
)
|
(
)
|
(
)
|
(
)
|
(
)
|
|
731-TA-1400
|
Plastic decorative ribbon
|
China
|
12/27/2017
|
(
)
|
(
)
|
(
)
|
(
)
|
(
)
|
Source:
U.S. International Trade Commission.
“ITA” is
the International Trade Administration of the U.S. Department of Commerce
(USDOC).
For cases
in which the final action was taken by the ITA, the date shown is the
Federal
Register
notice date of that action. For cases in which the final action
was taken by USITC, the date of the USITC notification of USDOC is shown.
Pending
or not applicable as of December 31, 2017.
Withdrawn
by petitioning firm(s). Investigation terminated.
Table
A.11
Antidumping duty orders and suspension
agreements in effect as of December 31, 2017
|
Country
|
Commodity
|
Effective date of original action
|
|
Argentina
|
Lemon juice (suspended)
|
September 10, 2007
|
|
Austria
|
Carbon
and alloy steel cut-to-length plate
|
May 25,
2017
|
|
Australia
|
Uncoated paper
|
March 5, 2016
|
|
|
Hot-rolled
carbon steel flat products
|
October
3, 2016
|
|
Belarus
|
Steel concrete reinforcing bar
|
September 7, 2001
|
|
Belgium
|
Stainless
steel plate in coils
|
May 21,
1999
|
|
|
Carbon and alloy steel cut-to-length plate
|
May 25, 2017
|
|
Brazil
|
Iron
construction castings
|
May 9,
1986
|
|
|
Carbon steel butt-weld pipe fittings
|
December 17, 1986
|
|
|
Circular
welded nonalloy steel pipe
|
November
2, 1992
|
|
|
Stainless steel bar
|
February 21, 1995
|
|
|
Carbon
steel wire rod
|
October
29, 2002
|
|
|
Prestressed concrete steel wire strand
|
January 28, 2004
|
|
|
Frozen
warm-water shrimp and prawns
|
February
1, 2005
|
|
|
Uncoated paper
|
March 5, 2016
|
|
|
Cold-rolled
steel flat products
|
September
20, 2016
|
|
|
Hot-rolled carbon steel flat products
|
October 3, 2016
|
|
|
Carbon
and alloy steel cut-to-length plate
|
January
26, 2017
|
|
|
Emulsion styrene-butadiene rubber
|
September 12, 2017
|
|
Canada
|
Iron
construction castings
|
March
5, 1986
|
|
|
Citric acid and certain citrate
|
May 29, 2009
|
|
|
Polyethylene
terephthalate resin
|
May 6,
2016
|
|
Chile
|
Preserved mushrooms
|
December 2, 1998
|
|
China
|
Potassium
permanganate
|
January
31, 1984
|
|
|
Chloropicrin
|
March 22, 1984
|
|
|
Barium
chloride
|
October
17, 1984
|
|
|
Iron construction castings
|
May 9, 1986
|
|
|
Petroleum
wax candles
|
August
28, 1986
|
|
|
Porcelain-on-steel cooking ware
|
December 2, 1986
|
|
|
Tapered
roller bearings
|
June
15, 1987
|
|
|
Heavy forged hand tools - axes & adzes
|
February 19, 1991
|
|
|
Heavy
forged hand tools - bars & wedges
|
February
19, 1991
|
|
|
Heavy forged hand tools - hammers & sledges
|
February 19, 1991
|
|
|
Heavy
forged hand tools - picks & mattocks
|
February
19, 1991
|
|
|
Silicon metal
|
June 10, 1991
|
|
|
Carbon
steel butt-weld pipe fittings
|
July 6,
1992
|
|
|
Sulfanilic acid
|
August 19, 1992
|
|
|
Helical
spring lock washers
|
October
19, 1993
|
|
|
Fresh garlic
|
November 16, 1994
|
|
|
Paper clips
|
November
25, 1994
|
|
|
Silicomanganese
|
December 22, 1994
|
|
|
Cased
pencils
|
December
28, 1994
|
|
|
Glycine
|
March 29, 1995
|
|
|
Pure
magnesium (ingot)
|
May 12,
1995
|
|
|
Furfuryl alcohol
|
June 21, 1995
|
|
|
Persulfates
|
July 7,
1997
|
|
|
Crawfish tail meat
|
September 15, 1997
|
|
|
Carbon
steel plate
|
October
24, 1997
|
|
|
Preserved mushrooms
|
February 19, 1999
|
|
|
Steel
concrete reinforcing bar
|
September
7, 2001
|
|
|
Foundry coke
|
September 17, 2001
|
|
|
Pure
magnesium (granular)
|
November
19, 2001
|
|
|
Hot-rolled carbon steel flat products
|
November 29, 2001
|
|
|
Honey
|
December
10, 2001
|
|
|
Folding gift boxes
|
January 8, 2002
|
|
|
Ferrovanadium
|
January
28, 2003
|
|
|
Non-malleable cast iron pipe fittings
|
April 7, 2003
|
|
|
Polyvinyl
alcohol
|
October
1, 2003
|
|
|
Barium carbonate
|
October 1, 2003
|
|
|
Refined
brown aluminum oxide
|
November
19, 2003
|
|
|
Malleable iron pipe fittings
|
December 12, 2003
|
|
|
Tetrahydrofurfuryl
alcohol
|
August
6, 2004
|
|
|
Ironing tables
|
August 6, 2004
|
|
|
Polyethylene
retail carrier bags
|
August
9, 2004
|
|
|
Hand trucks
|
December 2, 2004
|
|
|
Carbazole
violet pigment 23
|
December
29, 2004
|
|
|
Wooden bedroom furniture
|
January 4, 2005
|
|
|
Crepe
paper
|
January
25, 2005
|
|
|
Frozen warm-water shrimp and prawns
|
February 1, 2005
|
|
|
Tissue
paper
|
March
30, 2005
|
|
|
Magnesium
|
April 15, 2005
|
|
|
Chlorinated
isocyanurates
|
June
24, 2005
|
|
|
Certain artist canvas
|
June 1, 2006
|
|
|
Certain
lined paper
|
September
28, 2006
|
|
|
Certain activated carbon
|
April 27, 2007
|
|
|
Certain
polyester staple fiber
|
June 1,
2007
|
|
|
Sodium hexametaphosphate
|
March 19, 2008
|
|
|
Circular
welded carbon quality steel pipe
|
July
22, 2008
|
|
|
Steel nails
|
August 1, 2008
|
|
|
Light-walled
rectangular pipe and tube
|
August
5, 2008
|
|
|
Laminated woven sacks
|
August 7, 2008
|
|
|
Sodium
nitrite
|
August
27, 2008
|
|
|
New pneumatic off-the-road tires
|
September 4, 2008
|
|
|
Raw flexible
magnets
|
September
17, 2008
|
|
|
Steel wire garment hangers
|
October 6, 2008
|
|
|
Electrolytic
manganese dioxide
|
October
7, 2008
|
|
|
Polyethylene terephthalate film, sheet, and strip
|
November 10, 2008
|
|
|
Lightweight
thermal paper
|
November
24, 2008
|
|
|
Uncovered innerspring units
|
February 19, 2009
|
|
|
Small
diameter graphite electrodes
|
February
26, 2009
|
|
|
Circular welded austenitic stainless pressure pipe
|
March 17, 2009
|
|
|
Steel
threaded rod
|
April
14, 2009
|
|
|
Circular welded carbon quality steel line pipe
|
May 13, 2009
|
|
|
Citric
acid and certain citrate
|
May 29,
2009
|
|
|
Tow behind lawn groomer
|
August 3, 2009
|
|
|
Kitchen
appliance shelving and racks
|
September
14, 2009
|
|
|
Oil country tubular goods
|
May 21, 2010
|
|
|
Prestressed
concrete steel wire strand
|
June
29, 2010
|
|
|
Potassium phosphate salts
|
July 22, 2010
|
|
|
Steel
grating
|
July
23, 2010
|
|
|
Narrow woven ribbons with woven selvedge
|
September 1, 2010
|
|
|
Magnesia
carbon bricks
|
September
20, 2010
|
|
|
Seamless carbon and alloy steel standard, line, and
pressure pipe
|
November 10, 2010
|
|
|
Coated
paper suitable for high-quality print graphics using sheet-fed presses
|
November
17, 2010
|
|
|
Seamless refined copper pipe and tube
|
November 22, 2010
|
|
|
Aluminum
extrusions
|
May 26,
2011
|
|
|
Multilayered wood flooring
|
December 8, 2011
|
|
|
Stilbenic
optical brightening agent
|
May 10,
2012
|
|
|
High pressure steel cylinders
|
June 21, 2012
|
|
|
Crystalline
silicon photovoltaic cells
|
December
7, 2012
|
|
|
Utility scale wind towers
|
February 15, 2013
|
|
|
Drawn
stainless steel sinks
|
April
11, 2013
|
|
|
Xanthan gum
|
July 19, 2013
|
|
|
Prestressed
concrete steel rail tie wire
|
June
24, 2014
|
|
|
Monosodium glutamate
|
November 26, 2014
|
|
|
Non-oriented
electrical steel
|
December
3, 2014
|
|
|
Carbon and certain alloy steel wire
|
January 8, 2015
|
|
|
Calcium
hypochlorite
|
January
30, 2015
|
|
|
Crystalline silicon photovoltaic products
|
February 18, 2015
|
|
|
Passenger
vehicle and light truck tires
|
August
10, 2015
|
|
|
Boltless steel shelving units prepackaged for sale
|
October 21, 2015
|
|
|
Melamine
|
December
28, 2015
|
|
|
Uncoated paper
|
March 5, 2016
|
|
|
Polyethylene
terephthalate resin
|
May 6,
2016
|
|
|
Cold-rolled steel flat products
|
July 14, 2016
|
|
|
Corrosion-resistant
steel products
|
July
25, 2016
|
|
|
Hydrofluorocarbon blends
|
August 19, 2016
|
|
|
Large
residential washers
|
February
6, 2017
|
|
|
Biaxial integral geogrid products
|
March 3, 2017
|
|
|
Ammonium
sulfate
|
March
9, 2017
|
|
|
Amorphous silica fabric
|
March 17, 2017
|
|
|
Carbon
and alloy steel cut-to-length plate
|
March
20, 2017
|
|
|
Stainless steel sheet and strip
|
April 3, 2017
|
|
|
1,1,1,2
Tetrafluoroethane (R-134a)
|
April 19,
2017
|
|
|
1-hydroxyethylidene-1, 1-diphosphonic acid (HEDP)
|
May 18, 2017
|
|
France
|
Brass
sheet & strip
|
March
6, 1987
|
|
|
Low enriched uranium
|
February 13, 2002
|
|
|
Carbon
and alloy steel cut-to-length plate
|
May 25,
2017
|
|
Germany
|
Brass sheet & strip
|
March 6, 1987
|
|
|
Seamless
pipe
|
August
3, 1995
|
|
|
Sodium nitrite
|
August 27, 2008
|
|
|
Non-oriented
electrical steel
|
December
3, 2014
|
|
|
Carbon and alloy steel cut-to-length plate
|
May 25, 2017
|
|
India
|
Welded
carbon steel pipe
|
May 12,
1986
|
|
|
Sulfanilic acid
|
March 2, 1993
|
|
|
Stainless
steel wire rod
|
December
1, 1993
|
|
|
Stainless steel bar
|
February 21, 1995
|
|
|
Preserved
mushrooms
|
February
19, 1999
|
|
|
Carbon steel plate
|
February 10, 2000
|
|
|
Hot-rolled
carbon steel flat products
|
December
3, 2001
|
|
|
Silicomanganese
|
May 23, 2002
|
|
|
Polyethylene
terephthalate (PET) film
|
July 1,
2002
|
|
|
Prestressed concrete steel wire strand
|
January 28, 2004
|
|
|
Carbazole
violet pigment 23
|
December
29, 2004
|
|
|
Frozen warm-water shrimp and prawns
|
February 1, 2005
|
|
|
Certain
lined paper
|
September
28, 2006
|
|
|
Commodity matchbooks
|
December 11, 2009
|
|
|
Oil
country tubular goods
|
September
10, 2014
|
|
|
Polyethylene terephthalate resin
|
May 6, 2016
|
|
|
Corrosion-resistant
steel products
|
July
25, 2016
|
|
|
Cold-rolled steel flat products
|
September 20, 2016
|
|
|
Welded
stainless pressure pipe
|
November
17, 2016
|
|
|
New pneumatic off-the-road tires
|
March 6, 2017
|
|
|
Finished
carbon steel flanges
|
August
24, 2017
|
|
Indonesia
|
Preserved mushrooms
|
February 19, 1999
|
|
|
Carbon
steel plate
|
February
10, 2000
|
|
|
Steel concrete reinforcing bar
|
September 7, 2001
|
|
|
Hot-rolled
carbon steel flat products
|
December
3, 2001
|
|
|
Carbon steel wire rod
|
October 29, 2002
|
|
|
Polyethylene
retail carrier bags
|
May 4,
2010
|
|
|
Coated paper suitable for high-quality print
graphics using sheet-fed presses
|
November 17, 2010
|
|
|
Monosodium
glutamate
|
November
26, 2014
|
|
|
Uncoated paper
|
March 5, 2016
|
|
Iran
|
Raw
in-shell pistachios
|
July
17, 1986
|
|
Italy
|
Pressure sensitive plastic tape
|
October 21, 1977
|
|
|
Brass
sheet & strip
|
March
6, 1987
|
|
|
Granular polytetrafluoroethylene resin
|
August 30, 1988
|
|
|
Pasta
|
July
24, 1996
|
|
|
Stainless steel butt-weld pipe fittings
|
February 23, 2001
|
|
|
Corrosion-resistant
steel products
|
July
25, 2016
|
|
|
Carbon and alloy steel cut-to-length plate
|
May 25, 2017
|
|
|
Finished
carbon steel flanges
|
August
24, 2017
|
|
Japan
|
Prestressed concrete steel wire strand
|
December 8, 1978
|
|
|
Carbon
steel butt-weld pipe fittings
|
February
10, 1987
|
|
|
Brass sheet & strip
|
August 12, 1988
|
|
|
Gray
portland cement & clinker
|
May 10,
1991
|
|
|
Stainless steel bar
|
February 21, 1995
|
|
|
Clad
steel plate
|
July 2,
1996
|
|
|
Stainless steel wire rod
|
September 15, 1998
|
|
|
Stainless
steel sheet & strip
|
July
27, 1999
|
|
|
Large diameter seamless pipe
|
June 26, 2000
|
|
|
Small
diameter seamless pipe
|
June
26, 2000
|
|
|
Tin mill products
|
August 28, 2000
|
|
|
Welded
large diameter line pipe
|
December
6, 2001
|
|
|
Polyvinyl alcohol
|
July 2, 2003
|
|
|
Diffusion-annealed,
nickel-plated flat-rolled steel products
|
May 29,
2014
|
|
|
Non-oriented electrical steel
|
December 3, 2014
|
|
|
Cold-rolled
steel flat products
|
July
14, 2016
|
|
|
Hot-rolled carbon steel flat products
|
October 3, 2016
|
|
|
Carbon
and alloy steel cut-to-length plate
|
May 25,
2017
|
|
|
Steel concrete reinforcing bar
|
July 14, 2017
|
|
Kazakhstan
|
Silicomanganese
|
May 23,
2002
|
|
Latvia
|
Steel concrete reinforcing bar
|
September 7, 2001
|
|
Malaysia
|
Stainless
steel butt-weld pipe fittings
|
February
23, 2001
|
|
|
Polyethylene retail carrier bags
|
August 9, 2004
|
|
|
Welded
stainless pressure pipe
|
July
21, 2014
|
|
|
Steel Nails
|
July 13, 2015
|
|
Mexico
|
Circular
welded nonalloy steel pipe
|
November
2, 1992
|
|
|
Fresh tomatoes (suspended)
|
November 1, 1996
|
|
|
Carbon
steel wire rod
|
October
29, 2002
|
|
|
Prestressed concrete steel wire strand
|
January 28, 2004
|
|
|
Light-walled
rectangular pipe and tube
|
August
5, 2008
|
|
|
Magnesia carbon bricks
|
September 20, 2010
|
|
|
Seamless
refined copper pipe and tube
|
November
22, 2010
|
|
|
Large residential washers
|
February 15, 2013
|
|
|
Prestressed
concrete steel rail tie wire
|
June
24, 2014
|
|
|
Steel concrete reinforcing bar
|
November 6, 2014
|
|
|
Heavy-walled
rectangular welded carbon steel pipes and tubes
|
September
13, 2016
|
|
|
Emulsion styrene-butadiene rubber
|
September 12, 2017
|
|
Moldova
|
Steel
concrete reinforcing bar
|
September
7, 2001
|
|
|
Carbon steel wire rod
|
October 29, 2002
|
|
Netherlands
|
Hot-rolled
carbon steel flat products
|
October
3, 2016
|
|
Oman
|
Steel nails
|
July 13, 2015
|
|
|
Polyethylene
terephthalate resin
|
May 6,
2016
|
|
Philippines
|
Stainless steel butt-weld pipe fittings
|
February 23, 2001
|
|
Poland
|
Steel
concrete reinforcing bar
|
September
7, 2001
|
|
|
Emulsion styrene-butadiene rubber
|
September 12, 2017
|
|
Portugal
|
Uncoated
paper
|
March
5, 2016
|
|
Romania
|
Small diameter seamless pipe
|
August 10, 2000
|
|
Russia
|
Uranium
(suspended)
|
October
16, 1992
|
|
|
Carbon steel plate (suspended)
|
October 24, 1997
|
|
|
Hot-rolled
carbon steel flat products
|
July
12, 1999
|
|
|
Silicon metal
|
March 26, 2003
|
|
South
Africa
|
Stainless
steel plate in coils
|
May 21,
1999
|
|
|
Ferrovanadium
|
January 28, 2003
|
|
|
Uncovered
innerspring units
|
December
11, 2008
|
|
|
Carbon and alloy steel cut-to-length plate
|
January 26, 2017
|
|
South
Korea
|
Circular
welded nonalloy steel pipe
|
November
2, 1992
|
|
|
Welded ASTM A-312 stainless steel pipe
|
December 30, 1992
|
|
|
Stainless
steel wire rod
|
September
15, 1998
|
|
|
Stainless steel sheet & strip
|
July 27, 1999
|
|
|
Carbon
steel plate
|
February
10, 2000
|
|
|
Polyester staple fiber
|
May 25, 2000
|
|
|
Prestressed
concrete steel wire strand
|
January
28, 2004
|
|
|
Light-walled rectangular pipe and tube
|
August 5, 2008
|
|
|
Large
power transformers
|
August
31, 2012
|
|
|
Large residential washers
|
February 15, 2013
|
|
|
Oil
country tubular goods
|
September
10, 2014
|
|
|
Non-oriented electrical steel
|
December 3, 2014
|
|
|
Steel
nails
|
July
13, 2015
|
|
|
Welded line pipe
|
December 1, 2015
|
|
|
Corrosion-resistant
steel products
|
July
25, 2016
|
|
|
Heavy-walled rectangular welded carbon steel pipes
and tubes
|
September 13, 2016
|
|
|
Cold-rolled
steel flat products
|
September
20, 2016
|
|
|
Hot-rolled carbon steel flat products
|
October 3, 2016
|
|
|
Phosphor
copper
|
April
24, 2017
|
|
|
Ferrovanadium
|
May 15, 2017
|
|
|
Carbon
and alloy steel cut-to-length plate
|
May 25,
2017
|
|
|
Dioctyl terephthalate (DOTP)
|
August 18, 2017
|
|
|
Emulsion
styrene-butadiene rubber
|
September
12, 2017
|
|
Spain
|
Stainless steel bar
|
March 2, 1995
|
|
|
Chlorinated
isocyanurates
|
June
24, 2005
|
|
|
Finished carbon steel flanges
|
June 14, 2017
|
|
Sweden
|
Non-oriented
electrical steel
|
December
3, 2014
|
|
Taiwan
|
Small diameter carbon steel pipe
|
May 7, 1984
|
|
|
Carbon
steel butt-weld pipe fittings
|
December
17, 1986
|
|
|
Light-walled rectangular tube
|
March 27, 1989
|
|
|
Circular
welded nonalloy steel pipe
|
November
2, 1992
|
|
|
Welded ASTM A-312 stainless steel pipe
|
December 30, 1992
|
|
|
Helical
spring lock washers
|
June
28, 1993
|
|
|
Stainless steel wire rod
|
September 15, 1998
|
|
|
Stainless
steel plate in coils
|
May 21,
1999
|
|
|
Stainless steel sheet & strip
|
July 27, 1999
|
|
|
Polyester
staple fiber
|
May 25,
2000
|
|
|
Hot-rolled carbon steel flat products
|
November 29, 2001
|
|
|
Polyethylene
terephthalate (PET) film
|
July 1,
2002
|
|
|
Raw flexible magnets
|
September 17, 2008
|
|
|
Polyethylene
retail carrier bags
|
May 4,
2010
|
|
|
Narrow woven ribbons with woven selvedge
|
September 1, 2010
|
|
|
Stilbenic
optical brightening agent
|
May 10,
2012
|
|
|
Steel wire garment hangers
|
December 10, 2012
|
|
|
Non-oriented
electrical steel
|
December
3, 2014
|
|
|
Crystalline silicon photovoltaic products
|
February 18, 2015
|
|
|
Steel
nails
|
July
13, 2015
|
|
|
Corrosion-resistant steel products
|
July 25, 2016
|
|
|
Carbon
and alloy steel cut-to-length plate
|
May 25,
2017
|
|
|
Steel concrete reinforcing bar
|
October 2, 2017
|
|
Thailand
|
Welded
carbon steel pipe
|
March
11, 1986
|
|
|
Carbon steel butt-weld pipe fittings
|
July 6, 1992
|
|
|
Hot-rolled
carbon steel flat products
|
November
29, 2001
|
|
|
Prestressed concrete steel wire strand
|
January 28, 2004
|
|
|
Polyethylene
retail carrier bags
|
August
9, 2004
|
|
|
Frozen warm-water shrimp and prawns
|
February 1, 2005
|
|
|
Welded
stainless pressure pipe
|
July
21, 2014
|
|
Trinidad & Tobago
|
Carbon steel wire rod
|
October 29, 2002
|
|
Turkey
|
Welded
carbon steel pipe
|
May 15,
1986
|
|
|
Pasta
|
July 24, 1996
|
|
|
Light-walled
rectangular pipe and tube
|
May 30,
2008
|
|
|
Oil country tubular goods
|
September 10, 2014
|
|
|
Welded
line pipe
|
December
1, 2015
|
|
|
Heavy-walled rectangular welded carbon steel pipes
and tubes
|
September 13, 2016
|
|
|
Hot-rolled
carbon steel flat products
|
October
3, 2016
|
|
|
Carbon and alloy steel cut-to-length plate
|
January 26, 2017
|
|
|
Steel
concrete reinforcing bar
|
July
14, 2017
|
|
United Kingdom
|
Cold-rolled steel flat products
|
September 20, 2016
|
|
|
Hot-rolled
carbon steel flat products
|
October
3, 2016
|
|
Ukraine
|
Carbon steel plate (suspended)
|
October 24, 1997
|
|
|
Steel
concrete reinforcing bar
|
September
7, 2001
|
|
|
Ammonium nitrate
|
September 12, 2001
|
|
|
Hot-rolled
carbon steel flat products
|
November
29, 2001
|
|
|
Silicomanganese
|
September 17, 2001
|
|
United
Arab Emirates
|
Polyethylene
terephthalate film, sheet, and strip
|
November
10, 2008
|
|
|
Steel nails
|
May 10, 2012
|
|
Venezuela
|
Silicomanganese
|
May 23,
2002
|
|
Vietnam
|
Frozen fish fillets
|
August 12, 2003
|
|
|
Frozen
warm-water shrimp and prawns
|
February
1, 2005
|
|
|
Uncovered innerspring units
|
December 11, 2008
|
|
|
Polyethylene
retail carrier bags
|
May 4,
2010
|
|
|
Steel wire garment hangers
|
February 5, 2013
|
|
|
Utility
scale wind towers
|
February
15, 2013
|
|
|
Welded stainless pressure pipe
|
July 21, 2014
|
|
|
Oil
country tubular goods
|
September
10, 2014
|
|
|
Steel nails
|
July 13, 2015
|
Source: U.S.
International Trade Commission.
Table
A.12
Countervailing duty cases active in 2017,
by USITC investigation number
|
USITC investigation no.
|
Product
|
Country of origin
|
Date of institution
|
USITC prelim
|
ITA
prelim
|
ITA final
|
USITC final
|
Date of final action
|
|
|
|
|
|
Affirmative = A; Negative = N
|
|
|
701-TA-552
|
Pneumatic
off-the-road (OTR) tires
|
India
|
1/8/2016
|
A
|
A
|
A
|
A
|
2/23/2017
|
|
701-TA-553
|
Pneumatic off-the-road (OTR) tires
|
Sri Lanka
|
1/8/2016
|
A
|
A
|
A
|
A
|
2/23/2017
|
|
701-TA-554
|
Biaxial
integral geogrid products
|
China
|
1/13/2016
|
A
|
A
|
A
|
A
|
2/24/2017
|
|
701-TA-555
|
Amorphous silica fabric
|
China
|
1/20/2016
|
A
|
A
|
A
|
A
|
3/10/2017
|
|
701-TA-556
|
Truck
and bus tires
|
China
|
1/29/2016
|
A
|
A
|
A
|
N
|
3/13/2017
|
|
701-TA-557
|
Stainless steel sheet and strip
|
China
|
2/12/2016
|
A
|
A
|
A
|
A
|
3/24/2017
|
|
701-TA-558
|
1-hydroxyethylidene-1,
1-diphosphonic acid (HEDP)
|
China
|
3/31/2016
|
A
|
A
|
A
|
A
|
5/8/2017
|
|
701-TA-560
|
Carbon and alloy steel cut-to-length plate
|
China
|
4/8/2016
|
A
|
A
|
A
|
A
|
3/13/2017
|
|
701-TA-561
|
Carbon
and alloy steel cut-to-length plate
|
South
Korea
|
4/8/2016
|
A
|
A
|
A
|
A
|
5/18/2017
|
|
701-TA-562
|
Ammonium sulfate
|
China
|
5/25/2016
|
A
|
A
|
A
|
A
|
3/2/2017
|
|
701-TA-563
|
Finished
carbon steel flanges
|
India
|
6/30/2016
|
A
|
A
|
A
|
A
|
8/14/2017
|
|
701-TA-564
|
Steel concrete reinforcing bar (rebar)
|
Turkey
|
9/20/2016
|
A
|
A
|
A
|
A
|
6/30/2017
|
|
701-TA-565
|
Hardwood
plywood
|
China
|
11/18/2016
|
A
|
A
|
A
|
A
|
12/20/2017
|
|
701-TA-566
|
Softwood lumber
|
Canada
|
11/25/2016
|
A
|
A
|
A
|
A
|
12/22/2017
|
|
701-TA-567
|
Silicon
metal
|
Australia
|
3/8/2017
|
A
|
A
|
(
)
|
(
)
|
(
)
|
|
701-TA-568
|
Silicon metal
|
Brazil
|
3/8/2017
|
A
|
A
|
(
)
|
(
)
|
(
)
|
|
701-TA-569
|
Silicon
metal
|
Kazakhstan
|
3/8/2017
|
A
|
A
|
(
)
|
(
)
|
(
)
|
|
701-TA-570
|
Aluminum foil
|
China
|
3/9/2017
|
A
|
A
|
(
)
|
(
)
|
(
)
|
|
701-TA-571
|
Biodiesel
|
Argentina
|
3/23/2017
|
A
|
A
|
A
|
A
|
12/21/2017
|
|
701-TA-572
|
Biodiesel
|
Indonesia
|
3/23/2017
|
A
|
A
|
A
|
A
|
12/21/2017
|
|
701-TA-573
|
Wire
rod
|
Italy
|
3/28/2017
|
A
|
A
|
(
)
|
(
)
|
(
)
|
|
701-TA-574
|
Wire rod
|
Turkey
|
3/28/2017
|
A
|
A
|
(
)
|
(
)
|
(
)
|
|
701-TA-575
|
Tool
chests
|
China
|
4/11/2017
|
A
|
A
|
A
|
(
)
|
(
)
|
|
701-TA-576
|
Cold-drawn mechanical tubing
|
China
|
4/19/2017
|
A
|
A
|
A
|
(
)
|
(
)
|
|
701-TA-577
|
Cold-drawn
mechanical tubing
|
India
|
4/19/2017
|
A
|
A
|
A
|
(
)
|
(
)
|
|
701-TA-578
|
100- to 150-seat large civil aircraft
|
Canada
|
4/27/2017
|
A
|
A
|
A
|
(
)
|
(
)
|
|
701-TA-579
|
Fine
denier polyester staple fiber
|
China
|
5/31/2017
|
A
|
A
|
(
)
|
(
)
|
(
)
|
|
701-TA-580
|
Fine denier polyester staple fiber
|
India
|
5/31/2017
|
A
|
A
|
(
)
|
(
)
|
(
)
|
|
701-TA-581
|
Citric
acid
|
Thailand
|
6/2/2017
|
A
|
N
|
(
)
|
(
)
|
(
)
|
|
701-TA-582
|
Ripe olives
|
Spain
|
6/22/2017
|
A
|
A
|
(
)
|
(
)
|
(
)
|
|
701-TA-583
|
Cast
iron soil pipe fittings
|
China
|
7/13/2017
|
A
|
A
|
(
)
|
(
)
|
(
)
|
|
701-TA-584
|
Uncoated groundwood paper
|
Canada
|
8/9/2017
|
A
|
(
)
|
(
)
|
(
)
|
(
)
|
|
701-TA-585
|
Stainless
steel flanges
|
China
|
8/16/2017
|
A
|
(
)
|
(
)
|
(
)
|
(
)
|
|
701-TA-586
|
Stainless steel flanges
|
India
|
8/16/2017
|
A
|
(
)
|
(
)
|
(
)
|
(
)
|
|
701-TA-587
|
Titanium
sponge
|
Kazakhstan
|
8/24/2017
|
N
|
(
)
|
(
)
|
(
)
|
10/10/2017
|
|
701-TA-588
|
PFTE resin
|
India
|
9/28/2017
|
A
|
(
)
|
(
)
|
(
)
|
(
)
|
|
701-TA-589
|
Forged
steel fittings
|
China
|
10/5/2017
|
A
|
(
)
|
(
)
|
(
)
|
(
)
|
|
701-TA-590
|
Sodium gluconate
|
China
|
11/30/2017
|
(
)
|
(
)
|
(
)
|
(
)
|
(
)
|
|
701-TA-591
|
Common
alloy aluminum sheet
|
China
|
12/1/2017
|
(
)
|
(
)
|
(
)
|
(
)
|
(
)
|
|
701-TA-592
|
Plastic decorative ribbon
|
China
|
12/27/2017
|
(
)
|
(
)
|
(
)
|
(
)
|
(
)
|
Source:
U.S. International Trade Commission.
“ITA” is
the International Trade Administration of the USDOC.
For cases
in which the final action was taken by the ITA, the date shown is the
Federal
Register
notice date of that action. For cases in which the final action
was taken by USITC, the date of the USITC notification of USDOC is shown.
Pending
or not applicable as of December 31, 2017.
Table
A.13
Countervailing duty orders and suspension
agreements in effect as of December 31, 2017
|
Country
|
Commodity
|
Effective date of original action
|
|
Brazil
|
Heavy iron construction castings
|
May 15, 1986
|
|
|
Carbon
steel wire rod
|
October
22, 2002
|
|
|
Cold-rolled steel flat products
|
September 20, 2016
|
|
|
Hot-rolled
carbon steel flat products
|
October
3, 2016
|
|
Canada
|
Supercalendered paper
|
December 10, 2015
|
|
China
|
Heavy
forged hand tools - hammers & sledges
|
February
19, 1991
|
|
|
Circular welded carbon quality steel pipe
|
July 22, 2008
|
|
|
Light-walled
rectangular pipe and tube
|
August
5, 2008
|
|
|
Laminated woven sacks
|
August 7, 2008
|
|
|
Sodium
nitrite
|
August
27, 2008
|
|
|
New pneumatic off-the-road tires
|
September 4, 2008
|
|
|
Raw
flexible magnets
|
September
17, 2008
|
|
|
Lightweight thermal paper
|
November 24, 2008
|
|
|
Circular
welded carbon quality steel line pipe
|
January
23, 2009
|
|
|
Circular welded austenitic stainless pressure pipe
|
March 19, 2009
|
|
|
Citric
acid and certain citrate
|
May 29,
2009
|
|
|
Kitchen appliance shelving and racks
|
September 14, 2009
|
|
|
Oil
country tubular goods
|
January
20, 2010
|
|
|
Prestressed concrete steel wire strand
|
July 7, 2010
|
|
|
Potassium
phosphate salts
|
July
22, 2010
|
|
|
Steel grating
|
July 23, 2010
|
|
|
Narrow
woven ribbons with woven selvedge
|
September
1, 2010
|
|
|
Magnesia carbon bricks
|
September 21, 2010
|
|
|
Seamless
carbon and alloy steel standard, line, and pressure pipe
|
November
10, 2010
|
|
|
Coated paper suitable for high-quality print
graphics using sheet-fed presses
|
November 17, 2010
|
|
|
Aluminum
extrusions
|
May 26,
2011
|
|
|
Multilayered wood flooring
|
December 8, 2011
|
|
|
High
pressure steel cylinders
|
June
21, 2012
|
|
|
Crystalline silicon photovoltaic cells
|
December 7, 2012
|
|
|
Utility
scale wind towers
|
February
15, 2013
|
|
|
Drawn stainless steel sinks
|
April 11, 2013
|
|
|
Chlorinated
isocyanurates
|
November
13, 2014
|
|
|
Non-oriented electrical steel
|
December 3, 2014
|
|
|
Carbon
and certain alloy steel wire
|
January
8, 2015
|
|
|
Calcium hypochlorite
|
January 30, 2015
|
|
|
Crystalline
silicon photovoltaic products
|
February
18, 2015
|
|
|
Passenger vehicle and light truck tires
|
August 10, 2015
|
|
|
Boltless
steel shelving units prepackaged for sale
|
October
21, 2015
|
|
|
Melamine
|
December 28, 2015
|
|
|
Uncoated
paper
|
March
5, 2016
|
|
|
Polyethylene terephthalate resin
|
May 6, 2016
|
|
|
Cold-rolled
steel flat products
|
July
14, 2016
|
|
|
Corrosion-resistant steel products
|
July 25, 2016
|
|
|
Biaxial
integral geogrid products
|
March
3, 2017
|
|
|
Ammonium sulfate
|
March 6, 2017
|
|
|
Amorphous
silica fabric
|
March
6, 2017
|
|
|
Carbon and alloy steel cut-to-length plate
|
March 9, 2017
|
|
|
Stainless
steel sheet and strip
|
March
17, 2017
|
|
|
1-hydroxyethylidene-1, 1-diphosphonic acid (HEDP)
|
March 20, 2017
|
|
India
|
Sulfanilic
acid
|
March
2, 1993
|
|
|
Carbon steel plate
|
February 10, 2000
|
|
|
Hot-rolled
carbon steel flat products
|
December
3, 2001
|
|
|
Polyethylene terephthalate (PET) film
|
July 1, 2002
|
|
|
Prestressed
concrete steel wire strand
|
February
4, 2004
|
|
|
Carbazole violet pigment 23
|
December 29, 2004
|
|
|
Certain
lined paper
|
September
28, 2006
|
|
|
Commodity matchbooks
|
December 11, 2009
|
|
|
Oil
country tubular goods
|
September
10, 2014
|
|
|
Polyethylene terephthalate resin
|
May 6, 2016
|
|
|
Corrosion-resistant
steel products
|
July
25, 2016
|
|
|
Cold-rolled steel flat products
|
September 20, 2016
|
|
|
Welded
stainless pressure pipe
|
November
17, 2016
|
|
|
New pneumatic off-the-road tires
|
April 3, 2017
|
|
|
Finished
carbon steel flanges
|
May 18,
2017
|
|
Indonesia
|
Carbon steel plate
|
February 10, 2000
|
|
|
Hot-rolled
carbon steel flat products
|
December
3, 2001
|
|
|
Coated paper suitable for high-quality print
graphics using sheet-fed presses
|
November 17, 2010
|
|
|
Uncoated
paper
|
March
5, 2016
|
|
Iran
|
Raw in-shell pistachios
|
March 11, 1986
|
|
|
Roasted
in-shell pistachios
|
October
7, 1986
|
|
Italy
|
Pasta
|
July 24, 1996
|
|
|
Corrosion-resistant
steel products
|
July
25, 2016
|
|
Russia
|
Uranium (suspended)
|
October 16, 1992
|
|
South
Africa
|
Stainless
steel plate in coils
|
May 11,
1999
|
|
South Korea
|
Stainless steel sheet & strip
|
August 6, 1999
|
|
|
Carbon
steel plate
|
February
10, 2000
|
|
|
Large residential washers
|
February 15, 2013
|
|
|
Corrosion-resistant
steel products
|
July
25, 2016
|
|
|
Cold-rolled steel flat products
|
September 20, 2016
|
|
|
Hot-rolled
carbon steel flat products
|
October
3, 2016
|
|
|
Carbon and alloy steel cut-to-length plate
|
May 25, 2017
|
|
Sri
Lanka
|
New
Pneumatic Off-the-Road Tires
|
July
14, 2017
|
|
Taiwan
|
Non-oriented electrical steel
|
December 3, 2014
|
|
Thailand
|
Hot-rolled
carbon steel flat products
|
December
3, 2001
|
|
Turkey
|
Welded carbon steel pipe
|
March 7, 1986
|
|
|
Pasta
|
July
24, 1996
|
|
|
Oil country tubular goods
|
September 10, 2014
|
|
|
Steel
concrete reinforcing bar
|
November
6, 2014
|
|
|
Welded line pipe
|
December 1, 2015
|
|
|
Heavy-walled
rectangular welded carbon steel pipes and tubes
|
September
13, 2016
|
|
|
Steel concrete reinforcing bar
|
August 24, 2017
|
|
Vietnam
|
Polyethylene
retail carrier bags
|
May 4,
2010
|
|
|
Steel wire garment hangers
|
February 5, 2013
|
|
|
Steel
nails
|
July
14, 2015
|
Source: U.S.
International Trade Commission.
Table
A.14
Reviews of existing antidumping and
countervailing duty orders and suspended investigations completed in 2017, by
date of completion.
|
USITC investigation number
|
Product
|
Country of origin
|
Action
|
Completion date
|
|
731-TA-1058
|
Wooden bedroom furniture
|
China
|
Continued
|
01-25-2017
|
|
731-TA-718
|
Glycine
|
China
|
Continued
|
01-31-2017
|
|
731-TA-825
|
Polyester staple fiber
|
South Korea
|
Continued
|
01-31-2017
|
|
731-TA-826
|
Polyester
staple fiber
|
Taiwan
|
Continued
|
01-31-2017
|
|
731-TA-1091
|
Artists’ canvas
|
China
|
Continued
|
03-02-2017
|
|
701-TA-475
|
Aluminum
extrusions
|
China
|
Continued
|
03-27-2017
|
|
731-TA-1177
|
Aluminum extrusions
|
China
|
Continued
|
03-27-2017
|
|
731-TA-696
|
Pure
magnesium ingot
|
China
|
Continued
|
03-29-2017
|
|
701-TA-318
|
Sulfanilic acid
|
India
|
Continued
|
04-17-2017
|
|
731-TA-538
|
Sulfanilic
acid
|
China
|
Continued
|
04-17-2017
|
|
731-TA-561
|
Sulfanilic acid
|
India
|
Continued
|
04-17-2017
|
|
731-TA-540
|
Welded
stainless steel pipe
|
South
Korea
|
Continued
|
05-12-2017
|
|
731-TA-541
|
Welded stainless steel pipe
|
Taiwan
|
Continued
|
05-12-2017
|
|
731-TA-624
|
Helical
spring lock washers
|
China
|
Continued
|
05-16-2017
|
|
731-TA-625
|
Helical spring lock washers
|
Taiwan
|
Continued
|
05-16-2017
|
|
731-TA-1063
|
Frozen warmwater shrimp
|
Brazil
|
Revoked
|
06-01-2017
|
|
731-TA-1064
|
Frozen warmwater shrimp
|
China
|
Continued
|
05-25-2017
|
|
731-TA-1066
|
Frozen
warmwater shrimp
|
India
|
Continued
|
05-25-2017
|
|
731-TA-1067
|
Frozen warmwater shrimp
|
Thailand
|
Continued
|
05-25-2017
|
|
731-TA-1068
|
Frozen
warmwater shrimp
|
Vietnam
|
Continued
|
05-25-2017
|
|
731-TA-638
|
Stainless steel wire rod
|
India
|
Continued
|
06-06-2017
|
|
731-TA-287
|
Raw-in-shell
pistachios
|
Iran
|
Continued
|
06-26-2017
|
|
731-TA-461
|
Gray portland cement and clinker
|
Japan
|
Continued
|
06-29-2017
|
|
731-TA-410
|
Light-walled
rectangular pipe
|
Taiwan
|
Continued
|
07-25-2017
|
|
731-TA-703
|
Furfuryl alcohol
|
China
|
Continued
|
07-28-2017
|
|
731-TA-669
|
Cased
pencils
|
China
|
Continued
|
08-17-2017
|
|
731-TA-663
|
Paper clips
|
China
|
Continued
|
08-24-2017
|
|
731-TA-539-C
|
Uranium
|
Russia
|
Continued
|
09-20-2017
|
|
701-TA-382
|
Stainless steel sheet and strip
|
South Korea
|
Continued
|
09-20-2017
|
|
731-TA-800
|
Stainless
steel sheet and strip
|
Japan
|
Continued
|
09-20-2017
|
|
731-TA-801
|
Stainless steel sheet and strip
|
South Korea
|
Continued
|
09-20-2017
|
|
731-TA-803
|
Stainless
steel sheet and strip
|
Taiwan
|
Continued
|
09-20-2017
|
|
731-TA-1185
|
Steel nails
|
United Arab Emirates
|
Continued
|
09-29-2017
|
|
731-TA-847
|
Carbon
and alloy seamless standard, line, and pressure pipe
|
Japan
|
Continued
|
10-10-2017
|
|
731-TA-849
|
Carbon and alloy seamless standard, line, and
pressure pipe
|
Romania
|
Continued
|
10-10-2017
|
|
731-TA-313
|
Brass
sheet and strip
|
France
|
Continued
|
10-13-2017
|
|
731-TA-314
|
Brass sheet and strip
|
Germany
|
Continued
|
10-13-2017
|
|
731-TA-317
|
Brass
sheet and strip
|
Italy
|
Continued
|
10-13-2017
|
|
731-TA-379
|
Brass sheet and strip
|
Japan
|
Continued
|
10-13-2017
|
|
731-TA-683
|
Fresh
garlic
|
China
|
Continued
|
10-19-2017
|
|
731-TA-1186
|
Stilbenic optical brightening agents
|
China
|
Continued
|
10-27-2017
|
|
731-TA-1187
|
Stilbenic
optical brightening agents
|
Taiwan
|
Continued
|
10-27-2017
|
|
701-TA-480
|
High pressure steel cylinders
|
China
|
Continued
|
10-31-2017
|
|
731-TA-1188
|
High
pressure steel cylinders
|
China
|
Continued
|
10-31-2017
|
|
701-TA-476
|
Multilayered wood flooring
|
China
|
Continued
|
12-13-2017
|
|
731-TA-1179
|
Multilayered
wood flooring
|
China
|
Continued
|
12-13-2017
|
Source:
U.S. International Trade Commission.
The
completion date shown is the date of the USITC notification of USDOC, except in
the case of a revocation where the date shown is the date of ITA’s
Federal
Register
notice.
Table
A.15
Section 337 investigations and related
proceedings completed by the Commission during 2017 and those pending on
December 31, 2017
|
Status of investigation
|
Article
|
Country
|
Commission determination
|
|
Completed
|
|
|
|
|
337-TA-565
|
Certain
ink cartridges and components thereof
|
China,
Hong Kong, Macau, South Korea
|
One
related (ancillary) advisory opinion proceeding; terminated based on a
settlement agreement.
|
|
337-TA-567
|
Certain foam footwear
|
Canada
|
One related (ancillary) modification proceeding;
modification denied.
|
|
337-TA-698
|
Certain
DC-DC controllers and products containing the same
|
Hong
Kong, Taiwan
|
One
related (ancillary) rescission proceeding; consent order rescinded.
|
|
337-TA-854
|
Certain two-way global satellite communication devices,
systems and components thereof
|
United Kingdom
|
One related (ancillary) rescission proceeding;
rescission denied.
|
|
337-TA-890
|
Certain
sleep-disordered breathing treatment systems and components thereof
|
China
|
One
related (ancillary) remand proceeding; remedial orders vacated.
|
|
337-TA-929
|
Certain beverage brewing capsules, components
thereof, and products containing the same
|
Hong Kong, China
|
One related (ancillary) enforcement proceeding and
two related (ancillary) rescission proceedings; no violation found;
rescission denied.
|
|
337-TA-944
|
Certain
network devices, related software and components thereof (I)
|
No
foreign respondents
|
One
related (ancillary) declassification proceeding; declassification granted in
part.
|
|
337-TA-945
|
Certain network devices, related software and
components thereof (II)
|
No foreign respondents
|
Issued limited exclusion order and cease and desist
order.
|
|
337-TA-945
|
Certain
network devices, related software and components thereof (II)
|
No
foreign respondents
|
Two
related (ancillary) rescission proceedings; rescission denied.
|
|
337-TA-946
|
Certain ink cartridges and components thereof
|
China, Hong Kong
|
One related (ancillary) advisory opinion proceeding;
terminated based on a settlement agreement.
|
|
337-TA-947
|
Certain
light-emitting diode products and components thereof
|
China,
Taiwan
|
Terminated
based on a settlement agreement.
|
|
337-TA-951
|
Certain lithium metal oxide cathode materials,
lithium-ion batteries for power tool products containing same, and power tool
products with lithium-ion batteries containing same
|
Japan, Belgium
|
One related (ancillary) rescission proceeding;
remedial order rescinded.
|
|
337-TA-959
|
Certain
electric skin care devices, brushes and chargers therefor, and kits
containing same
|
China,
South Korea, United Kingdom, Canada, Israel
|
Issued
general exclusion order, limited exclusion order, and nine cease and desist
orders.
|
|
337-TA-965
|
Certain table saws incorporating active injury
mitigation technology and components thereof
|
Germany
|
Issued limited exclusion order and cease and desist
order.
|
|
337-TA-967
|
Certain
document cameras and software for use therewith
|
No
foreign respondents
|
One
related (ancillary) rescission proceeding; remedial orders rescinded.
|
|
337-TA-968
|
Certain radiotherapy systems and treatment planning
software, and components thereof
|
Sweden, United Kingdom, Germany, China
|
Terminated based on a settlement agreement.
|
|
337-TA-971
|
Certain
air mattress systems, components thereof, and methods of using the same
|
No
foreign respondents
|
Issued
limited exclusion order.
|
|
337-TA-972
|
Certain automated teller machines, ATM modules,
components thereof, and products containing the same
|
South Korea
|
Issued limited exclusion order and three cease and
desist orders.
|
|
337-TA-973
|
Certain
wearable activity tracking devices, systems, and components thereof
|
No
foreign respondents
|
Terminated
based on withdrawal of the complaint.
|
|
337-TA-976
|
Certain woven textile fabrics and products
containing same
|
India
|
Issued general exclusion order.
|
|
337-TA-977
|
Certain
arrowheads with deploying blades and components thereof and packaging
therefor
|
China
|
Issued
general exclusion order and cease and desist order.
|
|
337-TA-979
|
Certain radio frequency identification (RFID)
products and components thereof
|
Canada, Thailand, Hong Kong
|
Terminated based on a finding of no violation.
|
|
337-TA-982
|
Certain
radio frequency (RF) capable integrated circuits and products containing the
same
|
South
Korea
|
Terminated
based on withdrawal of the complaint.
|
|
337-TA-988
|
Certain pumping bras
|
China
|
Issued general exclusion order.
|
|
337-TA-989
|
Certain
automated teller machines, ATM modules, components thereof, and products
containing the same
|
No
foreign respondents
|
Issued
limited exclusion order and two cease and desist orders.
|
|
337-TA-995
|
Certain electrical conductor composite cores and
components thereof
|
China
|
Terminated based on good cause.
|
|
337-TA-997
|
Certain
sleep-disordered breathing treatment systems and components thereof
|
China
|
Terminated
based on a settlement agreement.
|
|
337-TA-998
|
Certain hybrid electric vehicles and components
thereof
|
Germany
|
Terminated based on a settlement agreement.
|
|
337-TA-999
|
Certain
air mattress bed systems and components thereof
|
No
foreign respondents
|
One
related (ancillary) declassification proceeding; declassification granted in
part.
|
|
337-TA-1000
|
Certain motorized self-balancing vehicles
|
China, Hong Kong
|
Terminated based on a finding of no violation.
|
|
337-TA-1001
|
Certain
digital video receivers and hardware and software components thereof
|
United
Kingdom, France
|
Issued
limited exclusion order and six cease and desist orders.
|
|
337-TA-1005
|
Certain L-tryptophan, L-tryptophan products, and
their methods of production
|
South Korea, Indonesia
|
Issued limited exclusion order and cease and desist
order.
|
|
337-TA-1006
|
Certain
passenger vehicle automotive wheels
|
No
foreign respondents
|
Terminated
based on withdrawal of the complaint.
|
|
337-TA-1007
|
Certain personal transporters, components thereof,
and packaging and manuals therefor
|
No foreign respondents
|
Issued limited exclusion order and cease and desist order.
|
|
337-TA-1008
|
Certain
carbon spine board, cervical collar, CPR masks and various medical training
manikin devices, and trademarks, copyrights of product catalogues, product
inserts, and components thereof
|
China
|
Issued
limited exclusion order and cease and desist order.
|
|
337-TA-1010
|
Certain semiconductor devices, semiconductor device
packages, and products containing same
|
Taiwan, Singapore, United Kingdom, France
|
Terminated based on a settlement agreement.
|
|
337-TA-1013
|
Certain
potassium chloride powder products
|
Canada
|
Terminated
based on a settlement agreement.
|
|
337-TA-1014
|
Certain composite intermediate bulk containers
|
China
|
Terminated based on withdrawal of the complaint.
|
|
337-TA-1015
|
Certain
hand dryers and housings for hand dryers
|
United
Kingdom, China
|
Issued
general exclusion order and three cease and desist orders.
|
|
337-TA-1018
|
Certain athletic footwear
|
No foreign respondents
|
Terminated based on a consent order.
|
|
337-TA-1019
|
Certain
krill oil products and krill meal for production of krill oil products
|
Canada,
Norway, New Zealand
|
Terminated
based on a settlement agreement.
|
|
337-TA-1020
|
Certain industrial control system software, systems
using same, and components thereof
|
Germany, Taiwan
|
Terminated based on a settlement agreement.
|
|
337-TA-1021
|
Certain
personal transporters and components thereof
|
Netherlands,
China, Turkey
|
Issued
limited exclusion order and cease and desist order.
|
|
337-TA-1022
|
Certain sleep-disordered breathing treatment mask
systems and components thereof
|
New Zealand
|
Terminated based on withdrawal of the complaint.
|
|
337-TA-1025
|
Certain
silicon-on-insulator wafers
|
France
|
Terminated
based on a settlement agreement.
|
|
337-TA-1027
|
Certain food supplements and vitamins, including
ocular antioxidants and components thereof and products containing the same
|
India
|
Terminated based on a settlement agreement.
|
|
337-TA-1029
|
Certain
mobile electronic devices
|
China
|
Terminated
based on a settlement agreement.
|
|
337-TA-1030
|
Certain high-potency sweeteners, processes for
making same, and products containing same
|
China
|
Terminated based on withdrawal of the complaint.
|
|
337-TA-1034
|
Certain
flash memory devices and components thereof
|
Japan,
China, Malaysia
|
Terminated
based on a settlement agreement.
|
|
337-TA-1035
|
Certain liquid crystal eWriters and components
thereof
|
China
|
Issued limited exclusion order and cease and desist
order.
|
|
337-TA-1037
|
Certain
graphics processors, DDR memory controllers and products containing the same
|
South
Korea, China, Taiwan, Japan
|
Terminated
based on a settlement agreement.
|
|
337-TA-1038
|
Certain electronic devices, including mobile phones,
tablet computers, and components thereof
|
No foreign respondents
|
Terminated based on a settlement agreement.
|
|
337-TA-1039
|
Certain
electronic devices, including mobile phones, tablet computers, and components
thereof
|
No
foreign respondents
|
Terminated
based on a settlement agreement.
|
|
337-TA-1040
|
Certain basketball backboard components and products
containing the same
|
China
|
Terminated based on a settlement agreement.
|
|
337-TA-1041
|
Certain
digital television set-top boxes, remote control devices, and components
thereof
|
China,
United Kingdom
|
Terminated
based on withdrawal of the complaint.
|
|
337-TA-1045
|
Certain document cameras and software for use
therewith
|
No foreign respondents
|
Terminated based on withdrawal of the complaint.
|
|
337-TA-1048
|
Certain
intravascular administration sets and components thereof
|
China
|
Issued
limited exclusion order.
|
|
337-TA-1051
|
Certain LTE wireless communication devices and
components thereof
|
No foreign respondents
|
Terminated based on a settlement agreement.
|
|
337-TA-1052
|
Certain
thermoplastic-encapsulated electric motors, components thereof, and products
and vehicles containing same
|
Japan,
Germany
|
Terminated
based on withdrawal of the complaint.
|
|
337-TA-1054
|
Certain height-adjustable desk platforms and
components thereof
|
China
|
Terminated based on a settlement agreement.
|
|
337-TA-1062
|
Certain
backpack chairs
|
No
foreign respondents
|
Terminated
based on withdrawal of the complaint.
|
|
Pending
|
|
|
|
|
337-TA-921
|
Certain marine sonar imaging devices, including
downscan and sidescan devices, products containing the same, and components
thereof
|
Taiwan
|
One related (ancillary) enforcement proceeding and
one related (ancillary) rescission proceeding; pending before the Commission.
|
|
337-TA-933
|
Certain
stainless steel products, certain processes for manufacturing or relating to
same and certain products containing same
|
India,
Germany, Taiwan
|
One
related (ancillary) bond forfeiture proceeding; pending before the ALJ.
|
|
337-TA-943
|
Certain wireless headsets
|
Ireland, Australia, Singapore, Denmark, Germany,
Japan
|
One related (ancillary) remand proceeding; pending
before the ALJ.
|
|
337-TA-944
|
Certain
network devices, related software and components thereof (I)
|
No
foreign respondents
|
One related
(ancillary) enforcement proceeding; pending before the ALJ.
|
|
337-TA-945
|
Certain network devices, related software and
components thereof (II)
|
No foreign respondents
|
One related (ancillary) modification proceeding;
pending before the ALJ.
|
|
337-TA-971
|
Certain
air mattress systems, components thereof, and methods of using the same
|
No
foreign respondents
|
One
related (ancillary) remand proceeding; pending before the Commission.
|
|
337-TA-989
|
Certain automated teller machines, ATM modules,
components thereof, and products containing the same
|
No foreign respondents
|
One related (ancillary) enforcement proceeding;
pending before the ALJ.
|
|
337-TA-990
|
Certain
mobile electronic devices incorporating haptics (including smartphones and
smartwatches) and components thereof
|
No
foreign respondents
|
Pending
before the ALJ.
|
|
337-TA-1002
|
Certain carbon and alloy steel products
|
China, Hong Kong
|
Pending before the Commission.
|
|
337-TA-1003
|
Certain
composite aerogel insulation materials and methods for manufacturing the same
|
China
|
Pending
before the Commission.
|
|
337-TA-1004
|
Certain mobile and portable electronic devices
incorporating haptics (including smartphones and laptops) and components
thereof
|
No foreign respondents
|
Pending before the ALJ.
|
|
337-TA-1012
|
Certain
magnetic data storage tapes and cartridges containing the same
|
Japan
|
Pending
before the Commission.
|
|
337-TA-1016
|
Certain access control systems and components
thereof
|
China, Hong Kong
|
Pending before the Commission.
|
|
337-TA-1023
|
Certain
memory modules and components thereof, and products containing same
|
South
Korea
|
Pending
before the Commission.
|
|
337-TA-1024
|
Certain integrated circuits with voltage regulators
and products containing same
|
China, Ireland, Vietnam, Israel, Malaysia
|
Pending before the Commission.
|
|
337-TA-1026
|
Certain
audio processing hardware, software, and products containing the same
|
South
Korea
|
Pending
before the Commission.
|
|
337-TA-1028
|
Certain mobile device holders and components thereof
|
China, Hong Kong
|
Pending before the Commission.
|
|
337-TA-1031
|
Certain
UV curable coatings for optical fibers, coated optical fibers, and products
containing same
|
China
|
Pending
before the ALJ.
|
|
337-TA-1032
|
Certain single-molecule nucleic acid sequencing
systems and reagents, consumables, and software for use with same
|
United Kingdom
|
Pending before the Commission.
|
|
337-TA-1033
|
Certain
arrowheads with arcuate blades and components thereof
|
China
|
Pending
before the Commission.
|
|
337-TA-1036
|
Certain magnetic tape cartridges and components
thereof
|
Japan
|
Pending before the ALJ.
|
|
337-TA-1042
|
Certain
hybrid electric vehicles and components thereof
|
No
foreign respondents
|
Pending
before the ALJ.
|
|
337-TA-1043
|
Certain electronic connectors, components thereof,
and products containing the same
|
China, Taiwan, Germany, Brazil, Mexico
|
Pending before the Commission.
|
|
337-TA-1044
|
Certain
graphics systems, components thereof, and consumer products containing the
same
|
South
Korea, Taiwan
|
Pending
before the ALJ.
|
|
337-TA-1046
|
Certain nonvolatile memory devices and products
containing same
|
Japan, Philippines
|
Pending before the ALJ.
|
|
337-TA-1047
|
Certain
semiconductor devices and consumer audiovisual products containing the same
|
Japan,
South Korea, Taiwan
|
Pending
before the ALJ.
|
|
337-TA-1049
|
Certain digital cable and satellite products,
set-top boxes, gateways and components thereof
|
United Kingdom
|
Pending before the Commission.
|
|
337-TA-1050
|
Certain
dental ceramics, products thereof, and methods of making the same
|
Japan
|
Pending
before the ALJ.
|
|
337-TA-1053
|
Certain two-way radio equipment and systems, related
software and components thereof
|
China
|
Pending before the ALJ.
|
|
337-TA-1055
|
Certain
mirrors with internal illumination and components thereof
|
Canada
|
Pending
before the Commission.
|
|
337-TA-1056
|
Certain collapsible sockets for mobile electronic
devices and components thereof
|
Hong Kong, China
|
Pending before the ALJ.
|
|
337-TA-1057
|
Certain
robotic vacuum cleaning devices and components thereof such as spare parts
|
Canada,
Taiwan, China
|
Pending
before the ALJ.
|
|
337-TA-1058
|
Certain magnetic tape cartridges and components
thereof
|
Japan
|
Pending before the ALJ.
|
|
337-TA-1059
|
Certain
digital cameras, software, and components thereof
|
Thailand,
Japan, China, Indonesia
|
Pending
before the ALJ.
|
|
337-TA-1060
|
Certain consumer electronic devices, including
televisions, gaming consoles, mobile phones and tablets, and network-enabled
DVD and Blu-ray players
|
Japan
|
Pending before the Commission.
|
|
337-TA-1061
|
Certain
bar code readers, scan engines, products containing the same, and components
thereof
|
Singapore
|
Pending
before the ALJ.
|
|
337-TA-1063
|
Certain Xray breast imaging devices and components
thereof
|
Japan
|
Pending before the ALJ.
|
|
337-TA-1064
|
Certain
shielded electrical ribbon cables and products containing the same
|
China,
Taiwan
|
Pending
before the ALJ.
|
|
337-TA-1065
|
Certain mobile electronic devices and radio
frequency and processing components thereof
|
No foreign respondents
|
Pending before the ALJ.
|
|
337-TA-1066
|
Certain
recombinant factor IX products
|
Germany,
Switzerland
|
Pending
before the ALJ.
|
|
337-TA-1067
|
Certain road milling machines and components thereof
|
Switzerland, Italy
|
Pending before the ALJ.
|
|
337-TA-1068
|
Certain
microfluidic devices
|
No
foreign respondents
|
Pending
before the ALJ.
|
|
337-TA-1069
|
Certain pool and spa enclosures
|
Czech Republic, Slovakia
|
Pending before the ALJ
|
|
337-TA-1070
|
Certain
periodontal laser devices and components thereof
|
Slovenia
|
Pending
before the ALJ.
|
|
337-TA-1071
|
Certain wireless audio systems and components
thereof
|
Canada
|
Pending before the Commission.
|
|
337-TA-1072
|
Wi-Fi
enabled electronic devices and components thereof
|
China,
Hong Kong
|
Pending
before the ALJ.
|
|
337-TA-1073
|
Certain thermoplastic-encapsulated electric motors,
components thereof, and products and vehicles containing same
|
Japan, Germany
|
Pending before the ALJ.
|
|
337-TA-1074
|
Certain
industrial automation systems and components thereof including control
systems, controllers, visualization hardware, motion and motor control
systems, networking equipment, safety devices, and power supplies
|
China,
Hong Kong
|
Pending
before the ALJ.
|
|
337-TA-1075
|
Certain electrochemical glucose monitoring systems
and components thereof
|
No foreign respondents
|
Pending before the ALJ.
|
|
337-TA-1076
|
Certain
magnetic data storage tapes and cartridges containing the same (II)
|
Japan
|
Pending
before the ALJ.
|
|
337-TA-1077
|
Certain reusable diapers, components thereof, and
products containing the same
|
China
|
Pending before the ALJ.
|
|
337-TA-1078
|
Certain
amorphous metal and products containing same
|
China
|
Pending
before the ALJ.
|
|
337-TA-1079
|
Certain shaving cartridges, components thereof and
products containing same
|
China
|
Pending before the ALJ.
|
|
337-TA-1080
|
Certain
wafer-level packaging semiconductor devices and products containing same
(including cellular phones, tablets, laptops, and notebooks) and components
thereof
|
South
Korea
|
Pending
before the ALJ.
|
|
337-TA-1081
|
Certain LED lighting devices, LED power supplies,
and components thereof
|
China
|
Pending before the ALJ.
|
|
337-TA-1082
|
Certain
gas spring nailer products and components thereof
|
No
foreign respondents
|
Pending
before the ALJ.
|
|
337-TA-1083
|
Certain personal computers, mobile devices, digital
media players, and microconsoles
|
No foreign respondents
|
Pending before the ALJ.
|
|
337-TA-1084
|
Certain
insulated beverage containers, components, labels, and packaging materials
thereof
|
Hong
Kong, China
|
Pending
before the ALJ.
|
|
337-TA-1085
|
Certain glucosylated steviol glycosides, and
products containing same
|
China
|
Pending before the ALJ.
|
|
337-TA-1086
|
Certain
mounting apparatuses for holding portable electronic devices and components
thereof
|
China
|
Pending
before the ALJ.
|
|
337-TA-1087
|
Certain batteries and electrochemical devices
containing composite separators, components thereof, and products containing
same
|
Hong Kong, China
|
Pending before the ALJ.
|
|
337-TA-1088
|
Certain
road construction machines and components thereof
|
Germany
|
Pending
before the ALJ.
|
|
337-TA-1089
|
Certain memory modules and components thereof
|
South Korea
|
Pending before the ALJ.
|
|
337-TA-1090
|
Certain
intraoral scanners and related hardware and software
|
Denmark
|
Pending
before the ALJ.
|
|
337-TA-1091
|
Certain color intraoral scanners and related
hardware and software
|
Denmark
|
Pending before the ALJ.
|
Source:
U.S. International Trade Commission.
This
column lists the countries of the foreign respondents named in the original
notice of investigation and may thus not reflect the remaining respondents at
the time of the final decision or during any ancillary proceeding. “Hong Kong”
refers to “Hong Kong, China”; “Macau” refers to “Macau, China.”
ALJ =
Administrative Law Judge.
Table
A.16
Outstanding section 337 exclusion orders as
of December 31, 2017
|
Investigation no.
|
Article
|
Country
|
Date patent expires
|
|
337-TA-69
|
Certain airtight cast-iron stoves
|
Taiwan, South Korea
|
Nonpatent
|
|
337-TA-87
|
Certain
coin-operated audio-visual games and components thereof
|
Japan,
Taiwan
|
Nonpatent
|
|
337-TA-105
|
Certain coin-operated audio-visual games and
components thereof (namely, Rally-X and Pac-Man)
|
Japan, Taiwan
|
Nonpatent
|
|
337-TA-112
|
Certain
cube puzzles
|
Taiwan,
Japan
|
Nonpatent
|
|
337-TA-114
|
Certain miniature plug-in blade fuses
|
Taiwan
|
Nonpatent
|
|
337-TA-118
|
Certain
sneakers with fabric uppers and rubber soles
|
South
Korea
|
Nonpatent
|
|
337-TA-137
|
Certain heavy-duty staple gun tackers
|
Taiwan, Hong Kong, South Korea
|
Nonpatent
|
|
337-TA-152
|
Certain
plastic food storage containers
|
Hong
Kong, Taiwan
|
Nonpatent
|
|
337-TA-167
|
Certain single handle faucets
|
Taiwan
|
Nonpatent
|
|
337-TA-174
|
Certain
woodworking machines
|
Taiwan,
South Africa
|
Nonpatent
|
|
337-TA-195
|
Certain cloisonne jewelry
|
Taiwan
|
Nonpatent
|
|
337-TA-197
|
Certain
compound action metal cutting snips and components thereof
|
Taiwan
|
Nonpatent
|
|
337-TA-229
|
Certain nut jewelry and parts thereof
|
Philippines, Taiwan
|
Nonpatent
|
|
337-TA-231
|
Certain
soft sculpture dolls, popularly known as “Cabbage Patch Kids,” related
literature and packaging therefor
|
No
foreign respondents
|
Nonpatent
|
|
337-TA-266
|
Certain reclosable plastic bags and tubing
|
Singapore, Taiwan, South Korea, Thailand, Hong Kong,
Malaysia
|
Nonpatent
|
|
337-TA-279
|
Certain
plastic light duty screw anchors
|
Taiwan
|
Nonpatent
|
|
337-TA-285
|
Certain chemiluminescent compositions and components
thereof and methods of using, and products incorporating, the same
|
France
|
Nonpatent
|
|
337-TA-319
|
Certain
automotive fuel caps and radiator caps and related packaging and promotional
materials
|
Taiwan
|
Nonpatent
|
|
337-TA-321
|
Certain soft drinks and their containers
|
Colombia
|
Nonpatent
|
|
337-TA-378
|
Certain
Asian-style kamaboko fish cakes
|
Japan
|
Nonpatent
|
|
337-TA-380
|
Certain agricultural tractors under 50 power
take-off horsepower
|
Japan
|
Nonpatent
|
|
337-TA-424
|
Certain
cigarettes and packaging thereof
|
No
foreign respondents
|
Nonpatent
|
|
337-TA-440
|
Certain 4-androstenediol
|
China
|
July 13, 2018
|
|
337-TA-486
|
Certain
agricultural tractors, lawn tractors, riding lawnmowers, and components
thereof
|
China
|
Nonpatent
|
|
337-TA-487
|
Certain agricultural vehicles and components thereof
|
China, Netherlands, France, Germany, Canada
|
Nonpatent
|
|
337-TA-494
|
Certain
automotive measuring devices, products containing same, and bezels for such
devices
|
Taiwan
|
Nonpatent
|
|
337-TA-498
|
Certain insect traps
|
No foreign respondents
|
Jan. 30, 2018
|
|
337-TA-500
|
Certain
purple protective gloves
|
Malaysia
|
Nonpatent
|
|
337-TA-512
|
Certain light-emitting diodes and products
containing same
|
Malaysia
|
July 27, 2018
July 27, 2018
July 27, 2018
|
|
337-TA-522
|
Certain
ink markers and packaging thereof
|
China,
India, South Korea, Hong Kong
|
Nonpatent
|
|
337-TA-541
|
Certain power supply controllers and products
containing same
|
Taiwan
|
Sept. 24, 2019
Sept. 24, 2019
|
|
337-TA-549
|
Certain
ink sticks for solid ink printers
|
South
Korea
|
Apr.
29, 2022
Apr.
29, 2022
Apr.
29, 2022
|
|
337-TA-557
|
Certain automotive parts
|
Taiwan
|
June 22, 2018
July 27, 2018
Sept. 28, 2018
Oct. 5, 2018
Oct. 26, 2018
Mar. 1, 2019
Mar. 22, 2019
|
|
337-TA-563
|
Certain
portable power stations and packaging therefor
|
China
|
Nonpatent
|
|
337-TA-565
|
Certain ink cartridges and components thereof
|
Hong Kong, China, Macau, Germany, South Korea
|
May 18, 2019
May 18, 2019
Apr. 3, 2022
Aug. 17, 2023
Aug. 26, 2023
|
|
337-TA-567
|
Certain
foam footwear
|
Canada
|
Mar.
28, 2020
Oct. 3,
2020
|
|
337-TA-575
|
Certain lighters
|
Hong Kong, China
|
Nonpatent
|
|
337-TA-582
|
Certain
hydraulic excavators and components thereof
|
Canada
|
Nonpatent
|
|
337-TA-588
|
Certain digital multimeters, and products with
multimeter functionality
|
Hong Kong, China
|
Nonpatent
|
|
337-TA-590
|
Certain
coupler devices for power supply facilities, components thereof, and products
containing same
|
Taiwan,
Germany, China
|
Aug. 5,
2024
|
|
337-TA-604
|
Certain sucralose, sweeteners containing sucralose,
and related intermediate compounds thereof
|
China, United Kingdom, Hong Kong
|
Apr. 18, 2023
|
|
337-TA-611
|
Certain
magnifying loupe products and components thereof
|
China
|
May 20,
2022
|
|
337-TA-615
|
Certain ground fault circuit interrupters and
products containing the same
|
China
|
Nov. 21, 2020
May 3, 2021
Apr. 28, 2025
|
|
337-TA-617
|
Certain
digital televisions and certain products containing same and methods of using
same
|
Taiwan,
Hong Kong, China
|
Apr. 9,
2018
|
|
337-TA-629
|
Certain silicon microphone packages and products
containing the same
|
Malaysia
|
June 21, 2021
Sept. 16, 2022
|
|
337-TA-637
|
Certain
hair irons and packaging thereof
|
Singapore,
China, Hong Kong
|
Nonpatent
|
|
337-TA-643
|
Certain cigarettes and packaging thereof
|
Moldova, Belize, Singapore, Ukraine, Kyrgyzstan,
Gibraltar, United Kingdom, Switzerland
|
Nonpatent
|
|
337-TA-650
|
Certain
coaxial cable connectors and components thereof and products containing same
|
Taiwan,
China
|
Jan.
24, 2020
|
|
337-TA-655
|
Certain cast steel railway wheels, processes for
manufacturing or relating to same and certain products containing same
|
China
|
Nonpatent
|
|
337-TA-678
|
Certain
energy drink products
|
No
foreign respondents
|
Nonpatent
|
|
337-TA-679
|
Certain products advertised as containing creatine
ethyl ester
|
No foreign respondents
|
Nonpatent
|
|
337-TA-691
|
Certain
inkjet ink supplies and components thereof
|
China,
Hong Kong
|
Mar. 9,
2018
May 11,
2018
|
|
337-TA-700
|
Certain MEMS devices and products containing same
|
No foreign respondents
|
Jan. 29, 2021
|
|
337-TA-718
|
Certain
electronic paper towel dispensing devices and components thereof
|
Canada,
Hong Kong, Taiwan, Turkey
|
Feb. 9,
2021
Feb. 9,
2021
Mar.
15, 2021
May 27,
2021
|
|
337-TA-720
|
Certain biometric scanning devices, components
thereof, associated software, and products containing the same
|
South Korea
|
Jan. 16, 2023
|
|
337-TA-722
|
Certain
automotive vehicles and designs therefore
|
China
|
Jan. 3,
2020
|
|
337-TA-723
|
Certain inkjet ink cartridges with printheads and
components thereof
|
Taiwan, China, Hong Kong
|
Aug. 30, 2019
July 24, 2020
July 24, 2020
Oct. 30, 2020
Oct. 30, 2020
|
|
337-TA-725
|
Certain
caskets
|
Mexico
|
Sept.
13, 2020
|
|
337-TA-730
|
Certain inkjet ink supplies and components thereof
|
China
|
Aug. 20, 2023
Oct. 29, 2023
|
|
337-TA-739
|
Certain
ground fault circuit interrupters and products containing same
|
China
|
Oct.
21, 2023
|
|
337-TA-740
|
Certain toner cartridges and components thereof
|
China, Hong Kong, Canada, South Korea, Macau
|
Feb. 18, 2018
Sept. 22, 2019
July 18, 2021
July 15, 2022
July 15, 2022
Apr. 29, 2023
May 21, 2023
Dec. 19, 2024
|
|
337-TA-754
|
Certain
handbags, luggage, accessories, and packaging thereof
|
China
|
Nonpatent
|
|
337-TA-763
|
Certain radio control hobby transmitters and receivers
and products containing same
|
China
|
Nonpatent
Oct. 18, 2025
|
|
337-TA-780
|
Certain
protective cases and components thereof
|
China,
Hong Kong
|
Nonpatent
Sept.
29, 2023
May 11,
2024
June
15, 2024
June
15, 2024
Mar.
22, 2025
Apr.
19, 2025
Jan.
25, 2029
|
|
337-TA-791/826
|
Certain electric fireplaces, components thereof,
manuals for same, certain processes for manufacturing or relating to same and
certain products containing same; and certain electric fireplaces, components
thereof, manuals for same, certain processes for manufacturing or relating to
same and certain products containing same
|
China
|
Nonpatent
|
|
337-TA-796
|
Certain
electronic digital media devices and components thereof
|
South
Korea
|
Sept.
6, 2026
Jan. 5,
2027
|
|
337-TA-804
|
Certain LED photographic lighting devices and
components thereof
|
China, Taiwan
|
Dec. 7, 2021
Dec. 7, 2021
|
|
337-TA-807
|
Certain
digital photo frames and image display devices and components thereof
|
Taiwan,
Canada, Japan
|
July 6,
2020
Dec.
26, 2020
Oct.
29, 2021
|
|
337-TA-832
|
Certain ink application devices and components
thereof and methods of using the same
|
Canada, China
|
Feb. 28, 2020
Sept. 2, 2020
|
|
337-TA-849
|
Certain
rubber resins and processes for manufacturing same
|
China,
Hong Kong, Canada
|
Nonpatent
|
|
337-TA-861/867
|
Certain cases for portable electronic devices; and
certain cases for portable electronic devices
|
Taiwan, Hong Kong, China
|
Feb. 6, 2029
|
|
337-TA-878
|
Certain
electronic devices having placeshifting or display replication functionality
and products containing same
|
No
foreign respondents
|
May 26,
2019
May 26,
2019
June 7,
2025
June 7,
2025
June 7,
2025
May 1,
2029
|
|
337-TA-883
|
Certain opaque polymers
|
Turkey, Netherlands
|
Nonpatent
|
|
337-TA-887
|
Certain
crawler cranes and components thereof
|
China
|
Nonpatent
May 12,
2027
|
|
337-TA-894
|
Certain tires and products containing same
|
China, Thailand
|
Mar. 9, 2018
Jan. 19, 2024
Mar. 2, 2024
Mar. 2, 2024
|
|
337-TA-895
|
Certain
multiple mode outdoor grills and parts thereof
|
China,
Hong Kong
|
May 4,
2027
|
|
337-TA-918
|
Certain toner cartridges and components thereof
|
China, Hong Kong, Macau
|
Dec. 26, 2027
Dec. 26, 2027
Dec. 26, 2027
Dec. 26, 2027
Mar. 24, 2028
|
|
337-TA-919
|
Certain
archery products and related marketing materials
|
China
|
Nonpatent
Mar.
30, 2018
Jan.
15, 2023
|
|
337-TA-921
|
Certain marine sonar imaging devices, including
downscan and sidescan devices, products containing same, and components
thereof
|
Taiwan
|
July 14, 2029
July 14, 2029
|
|
337-TA-923
|
Certain
loom kits for creating linked articles
|
China
|
Dec.
15, 2031
|
|
337-TA-929
|
Certain beverage brewing capsules, components
thereof and products containing the same
|
Hong Kong, China
|
July 13, 2027
|
|
337-TA-933
|
Certain
stainless steel products, certain processes for manufacturing or relating to
same, and certain products containing same
|
India,
Germany, Taiwan
|
Nonpatent
|
|
337-TA-934
|
Certain dental implants
|
Brazil
|
May 23, 2024
Nov. 26, 2026
|
|
337-TA-935
|
Certain
personal transporters, components thereof and manuals therefor
|
China
|
Nonpatent
June 4,
2019
June 4,
2019
Oct.
13, 2020
Sept.
25, 2021
Sept.
25, 2021
|
|
337-TA-936
|
Certain footwear products
|
Canada, Italy, China, Australia, Japan
|
Nonpatent
|
|
337-TA-939
|
Certain
three-dimensional cinema systems and components thereof
|
South
Korea
|
Oct.
18, 2026
Sept.
28, 2027
Nov.
17, 2028
|
|
337-TA-944
|
Certain network devices, related software and
components thereof (I)
|
No foreign respondents
|
Jan. 6, 2020
May 22, 2020
May 22, 2020
|
|
337-TA-945
|
Certain
network devices, related software and components thereof (II)
|
No
foreign respondents
|
June
30, 2018
Aug.
23, 2025
|
|
337-TA-946
|
Certain ink cartridges and components thereof
|
Hong Kong, China
|
Dec. 15, 2026
Dec. 15, 2026
Dec. 15, 2026
Dec. 15, 2026
Sept. 4, 2029
|
|
337-TA-959
|
Certain
electric skin care devices, brushes and chargers therefor, and kits
containing same
|
South Korea,
Israel, Canada, United Kingdom, China
|
Nonpatent
June
27, 2020
July 4,
2024
Dec.
15, 2024
|
|
337-TA-965
|
Certain table saws incorporating active injury
mitigation technology and components thereof
|
Germany
|
Sept. 29, 2020
Feb. 1, 2022
|
|
337-TA-967
|
Certain
document cameras and software for use therewith
|
No
foreign respondents
|
Jan.
28, 2030
|
|
337-TA-972
|
Certain automated teller machines, ATM modules,
components thereof, and products containing the same
|
South Korea
|
Dec. 9. 2027
|
|
337-TA-975
|
Certain
computer cables, chargers, adapters, peripheral devices and packaging
containing the same
|
China
|
Nonpatent
|
|
337-TA-976
|
Certain woven textile fabrics and products
containing same
|
India
|
Nonpatent
|
|
337-TA-977
|
Certain
arrowheads with deploying blades and components thereof and packaging
therefor
|
China
|
Nonpatent
March
3, 2021
March
3, 2021
Aug.
12, 2028
Aug.
19, 2028
Oct. 8,
2028
Jan. 8,
2033
March
15, 2033
April
18, 2033
|
|
337-TA-988
|
Certain pumping bras
|
China
|
July 29, 2030
|
|
337-TA-989
|
Certain
automated teller machines, ATM modules, components thereof, and products
containing the same
|
No
foreign respondents
|
Jan.
17, 2029
|
|
337-TA-1001
|
Certain digital video receivers and hardware and
software components thereof
|
United Kingdom, France
|
Sept. 18, 2019
Sept. 18, 2019
|
|
337-TA-1005
|
Certain
L-tryptophan, L-tryptophan products, and their methods of production
|
South
Korea, Indonesia
|
Jan.
30, 2018
June
15, 2023
|
|
337-TA-1007/1021
|
Certain personal transporters, components thereof,
and packaging and manuals therefor and certain personal transporters and
components thereof
|
Netherlands, China, Turkey
|
Nonpatent
|
|
337-TA-1008
|
Certain
carbon spine board, cervical collar, CPR masks and various medical training
manikin devices, and trademarks, copyrights of product catalogues, product
inserts and components thereof
|
China
|
Nonpatent
|
|
337-TA-1015
|
Certain hand dryers and housings for hand dryers
|
United Kingdom, China
|
Nonpatent
|
|
337-TA-1035
|
Certain
liquid crystal eWriters and components thereof
|
China
|
March
9, 2026
Nov.
14, 2033
|
|
337-TA-1048
|
Certain intravascular administration sets and
components thereof
|
China
|
Nov. 9, 2018
Nov. 9, 2018
|
Source:
U.S. International Trade Commission.
This
column lists the countries of the foreign respondents named in the original
notice of investigation and may thus not reflect the countries of the
respondents covered by an exclusion order. “Hong Kong” refers to “Hong Kong,
China”; “Macau” refers to “Macau, China.”
Multiple
dates indicate the expiration dates of separate patents within the
investigation.
There are
three outstanding exclusion orders in inv. no. 337-TA-487.
There are
two outstanding exclusion orders in inv. no. 337-TA-935.
There are
two outstanding exclusion orders in inv. no. 337-TA-959.
Table
A.17
U.S. imports for consumption under GSP, by
source, 2015–17
|
Source
|
2015
|
2016
|
2017
|
2016–17
|
|
|
|
Million $
|
|
% change
|
|
India
|
4,618
|
4,710
|
5,635
|
19.6
|
|
Thailand
|
3,610
|
4,038
|
4,151
|
2.8
|
|
Brazil
|
1,941
|
2,181
|
2,473
|
13.4
|
|
Indonesia
|
1,682
|
1,793
|
1,947
|
8.6
|
|
Turkey
|
1,231
|
1,437
|
1,651
|
14.9
|
|
Philippines
|
1,380
|
1,473
|
1,492
|
1.3
|
|
South
Africa
|
1,129
|
985
|
1,115
|
13.2
|
|
Ecuador
|
317
|
390
|
435
|
11.5
|
|
Cambodia
|
78
|
179
|
397
|
121.9
|
|
Pakistan
|
180
|
247
|
328
|
32.6
|
|
Sri
Lanka
|
178
|
173
|
193
|
11.5
|
|
Kazakhstan
|
105
|
89
|
145
|
62.0
|
|
Bolivia
|
101
|
115
|
109
|
-5.0
|
|
Tunisia
|
217
|
115
|
102
|
-10.7
|
|
Georgia
|
89
|
58
|
93
|
60.3
|
|
Burma
|
0
|
3
|
91
|
2,736
|
|
Serbia
|
52
|
80
|
90
|
12.6
|
|
Egypt
|
71
|
75
|
88
|
16.9
|
|
Paraguay
|
66
|
69
|
82
|
20.1
|
|
Lebanon
|
43
|
65
|
74
|
13.7
|
|
Côte
d’Ivoire
|
58
|
71
|
66
|
-7.1
|
|
Ukraine
|
41
|
54
|
55
|
2.4
|
|
Congo
(DROC)
|
111
|
99
|
47
|
-52.9
|
|
Zimbabwe
|
46
|
16
|
46
|
193.1
|
|
Armenia
|
46
|
25
|
46
|
84.8
|
|
Subtotal,
top 25 GSP beneficiaries in 2017
|
17,388
|
18,539
|
20,952
|
13.0
|
|
All
other beneficiaries
|
370
|
414
|
263
|
-36.5
|
|
Total
U.S. imports for consumption under GSP
|
17,759
|
18,953
|
21,215
|
11.9
|
Source:
USITC DataWeb/USDOC (accessed March 14, 2018).
Note:
Because of rounding, figures may not add up to totals shown.
Table
A.18
Value of U.S. imports for consumption under
GSP, by USITC digest sector, 2015–17
|
Sector
|
Description
|
2015
|
2016
|
2017
|
2016–17
|
|
|
|
|
Million $
|
|
% change
|
|
1
|
Agricultural
products
|
2,952
|
3,199
|
3,304
|
3.3
|
|
2
|
Forest products
|
681
|
572
|
666
|
16.5
|
|
3
|
Chemicals
and related products
|
3,380
|
3,825
|
4,545
|
18.8
|
|
4
|
Energy-related products
|
(
a
)
|
2
|
15
|
505.7
|
|
5
|
Textiles
and apparel
|
586
|
629
|
689
|
9.6
|
|
6
|
Footwear
|
7
|
11
|
8
|
-25.5
|
|
7
|
Minerals
and metals
|
3,519
|
3,363
|
4,158
|
23.6
|
|
8
|
Machinery
|
2,090
|
2,160
|
2,119
|
-1.9
|
|
9
|
Transportation
equipment
|
2,187
|
2,422
|
2,501
|
3.3
|
|
10
|
Electronic products
|
1,073
|
1,129
|
1,118
|
-1.0
|
|
11
|
Miscellaneous
manufactures
|
1,284
|
1,643
|
2,092
|
27.3
|
|
|
Total
U.S. imports for consumption under GSP
|
17,759
|
18,953
|
21,215
|
11.9
|
Source:
USITC DataWeb/USDOC (accessed March 14, 2018).
Note:
Because of rounding, figures may not add up to totals shown.
Less than
$500,000.
Table
A.19
Share of U.S. imports for consumption under
GSP, by USITC digest sector, 2015–17
|
Sector
|
Description
|
2015
|
2016
|
2017
|
|
|
|
% of eligible imports
|
|
1
|
Agricultural
products
|
16.6
|
16.9
|
15.6
|
|
2
|
Forest products
|
3.8
|
3.0
|
3.1
|
|
3
|
Chemicals
and related products
|
19.0
|
20.2
|
21.4
|
|
4
|
Energy-related products
|
0.0
|
0.0
|
0.1
|
|
5
|
Textiles
and apparel
|
3.3
|
3.3
|
3.2
|
|
6
|
Footwear
|
0.0
|
0.1
|
0.0
|
|
7
|
Minerals
and metals
|
19.8
|
17.7
|
19.6
|
|
8
|
Machinery
|
11.8
|
11.4
|
10.0
|
|
9
|
Transportation
equipment
|
12.3
|
12.8
|
11.8
|
|
10
|
Electronic products
|
6.0
|
6.0
|
5.3
|
|
11
|
Miscellaneous
manufactures
|
7.2
|
8.7
|
9.9
|
|
|
Total for
consumption under GSP
|
100.0
|
100.0
|
100.0
|
Source:
USITC DataWeb/USDOC (accessed March 14, 2018).
Note:
Because of rounding, figures may not add up to totals shown.
Table
A.20
Leading U.S. imports for consumption under
GSP, by HTS 6-digit subheading, 2015–17
|
HTS 6
|
Description
|
2015
|
2016
|
2017
|
2016–17
|
|
|
|
|
Million $
|
|
% change
|
|
7113.19
|
Jewelry
and parts thereof, of precious metal other than silver
|
338
|
555
|
660
|
18.9
|
|
7202.41
|
Ferrochromium, containing more than 4% (wt.) carbon
|
259
|
263
|
480
|
82.4
|
|
2202.99
|
Nonalcoholic
beverages, n.e.s.o.i. (including milk-based drinks)
|
(
)
|
(
)
|
347
|
(
)
|
|
8708.99
|
Parts and accessories for motor vehicles, n.e.s.o.i.
|
218
|
251
|
294
|
16.8
|
|
4015.19
|
Gloves,
except surgical and medical gloves, of vulcanized rubber, n.e.s.o.i.
|
249
|
240
|
278
|
15.6
|
|
6802.99
|
Worked monumental or building stone n.e.s.o.i., of
stone n.e.s.o.i.
|
187
|
233
|
273
|
17.0
|
|
2106.90
|
Food
preparations n.e.s.o.i.
|
199
|
204
|
237
|
16.1
|
|
7606.12
|
Aluminum alloy rectangular (including square)
plates, sheets and strip, over 0.2 mm thick
|
222
|
224
|
231
|
2.9
|
|
1701.14
|
Cane
sugar in solid form, raw, not containing added flavoring or coloring matter,
n.e.s.o.i.
|
100
|
173
|
229
|
32.2
|
|
8708.94
|
Steering wheels, steering columns and steering boxes
for motor vehicles
|
216
|
213
|
228
|
7.0
|
|
8415.90
|
Parts,
n.e.s.o.i., of air conditioning machines
|
262
|
262
|
224
|
-14.4
|
|
6802.91
|
Worked monumental or building stone n.e.s.o.i., of
marble, travertine and alabaster
|
175
|
189
|
223
|
17.8
|
|
7801.10
|
Refined
lead, unwrought
|
131
|
89
|
220
|
148.0
|
|
4011.20
|
New pneumatic tires, of rubber, of a kind used on
buses or trucks
|
88
|
180
|
190
|
5.1
|
|
2934.99
|
Nucleic
acids and their salts, whether or not chemically defined; other heterocyclic
compounds, n.e.s.o.i.
|
81
|
158
|
189
|
19.6
|
|
|
Total of
items shown
|
2,725
|
3,235
|
4,301
|
33.0
|
|
|
All
other HTS products
|
15,034
|
15,718
|
16,913
|
7.6
|
|
|
Total of
all commodities
|
17,759
|
18,953
|
21,215
|
11.9
|
Source:
USITC DataWeb/USDOC (accessed March 14, 2018).
Note:
Data reflect shipments under HTS chapters 1–97. Because of rounding, figures
may not add up to totals shown. N.e.s.o.i. = not elsewhere specified or
included.
Trade in
2015 and 2016 reported under HTS subheading 2202.90.
Undefined.
Table
A.21
Leading U.S. imports for consumption under
AGOA (excluding GSP), by HTS 6-digit subheading, 2015–17
|
HTS 6
|
Description
|
2015
|
2016
|
2017
|
2016–17
|
|
|
|
|
Million $
|
|
% change
|
|
2709.00
|
Petroleum
oils and oils from bituminous minerals, crude
|
4,814
|
6,210
|
9,162
|
47.5
|
|
8703.23
|
Passenger motor vehicles with spark-ignition
internal combustion reciprocating piston engine, cylinder capacity over 1,500
cc but not over 3,000 cc
|
1,349
|
1,493
|
1,178
|
-21.1
|
|
2710.12
|
Light
oils and preparations containing 70% by weight petroleum oils or oils from
bituminous minerals, not containing biodiesel, not waste oils
|
278
|
225
|
263
|
17.1
|
|
6203.42
|
Men's or boys' trousers, bib and brace overalls,
breeches and shorts of cotton, not knitted or crocheted
|
179
|
193
|
201
|
4.2
|
|
6110.30
|
Sweaters,
pullovers, sweatshirts, vests and similar articles of manmade fibers, knitted
or crocheted
|
102
|
109
|
123
|
12.8
|
|
6205.20
|
Men's or boys' shirts of cotton, not knitted or
crocheted
|
148
|
143
|
119
|
-16.2
|
|
0802.62
|
Macadamia
nuts, shelled, fresh or dried
|
103
|
86
|
108
|
26.5
|
|
6104.63
|
Women's or girls' trousers, bib and brace overalls,
breeches and shorts of synthetic fibers, knitted or crocheted
|
98
|
91
|
94
|
2.7
|
|
7606.12
|
Aluminum
alloy rectangular (including square) plates, sheets and strip, over 0.2 mm
thick
|
0
|
23
|
93
|
295.7
|
|
2710.19
|
Petroleum oils, oils from bituminous minerals (other
than crude) and products containing by weight 70% or more of these oils, not
biodiesel or waste
|
55
|
29
|
90
|
209.7
|
|
7202.11
|
Ferromanganese,
containing more than 2% (wt.) carbon
|
87
|
33
|
85
|
154.1
|
|
6204.62
|
Women's or girls' trousers, bib and brace overalls,
breeches and shorts of cotton, not knitted or crocheted
|
88
|
98
|
85
|
-13.5
|
|
6105.20
|
Men's
or boys' shirts of manmade fibers, knitted or crocheted
|
60
|
78
|
77
|
-1.4
|
|
3823.70
|
Industrial fatty alcohols
|
42
|
47
|
62
|
31.8
|
|
6109.90
|
T-shirts,
singlets, tank tops and similar garments, of textile materials n.e.s.o.i.,
knitted or crocheted
|
47
|
52
|
54
|
3.9
|
|
|
Total of
items shown
|
7,450
|
8,910
|
11,794
|
32.4
|
|
|
All
other HTS products
|
534
|
541
|
718
|
32.7
|
|
|
Total of
all commodities
|
7,984
|
9,451
|
12,512
|
32.4
|
Source:
USITC DataWeb/USDOC (accessed March 14, 2018).
Note:
Data reflect shipments under HTS chapters 1–97. Because of rounding, figures
may not add up to totals shown. N.e.s.o.i. = not elsewhere specified or
included.
Table
A.22
Leading U.S. imports for consumption under
AGOA (excluding GSP), by source, 2015–17
|
Source
|
2015
|
2016
|
2017
|
2016–17
|
|
|
|
Thousand $
|
|
% change
|
|
Nigeria
|
1,403,195
|
3,482,333
|
6,089,946
|
74.9
|
|
Angola
|
1,830,054
|
1,998,268
|
2,270,554
|
13.6
|
|
South
Africa
|
1,730,100
|
1,858,388
|
1,817,607
|
-2.2
|
|
Chad
|
1,478,697
|
775,178
|
590,244
|
-23.9
|
|
Kenya
|
428,224
|
390,746
|
403,258
|
3.2
|
|
Ghana
|
9,626
|
29,691
|
312,479
|
952.5
|
|
Lesotho
|
299,314
|
295,164
|
289,013
|
-2.1
|
|
Madagascar
|
39,831
|
93,734
|
148,028
|
57.9
|
|
Mauritius
|
207,083
|
188,039
|
140,199
|
-25.4
|
|
Gabon
|
167,003
|
60,050
|
99,913
|
66.4
|
|
Ethiopia
|
40,897
|
61,490
|
86,453
|
40.6
|
|
Congo (ROC)
|
254,572
|
61,681
|
79,464
|
28.8
|
|
Mauritania
|
0
|
47,711
|
54,854
|
15.0
|
|
Tanzania
|
28,166
|
36,952
|
40,545
|
9.7
|
|
Côte
d’Ivoire
|
530
|
120
|
37,717
|
31295.2
|
|
Malawi
|
40,952
|
45,085
|
35,503
|
-21.3
|
|
Senegal
|
15,544
|
87
|
5,133
|
5784.1
|
|
Mozambique
|
284
|
1,470
|
2,845
|
93.5
|
|
Rwanda
|
435
|
1,220
|
2,164
|
77.4
|
|
Djibouti
|
464
|
11
|
1,304
|
11758.2
|
|
Botswana
|
8,251
|
4,766
|
991
|
-79.2
|
|
Zambia
|
265
|
32
|
907
|
2725.3
|
|
Burkina
Faso
|
3
|
167
|
720
|
331.6
|
|
Cabo Verde
|
523
|
586
|
720
|
22.8
|
|
Uganda
|
144
|
288
|
713
|
147.5
|
|
Cameroon
|
53
|
16,758
|
393
|
-97.7
|
|
Sierra
Leone
|
0
|
523
|
92
|
-82.3
|
|
Togo
|
11
|
20
|
80
|
306.9
|
|
Guinea
|
4
|
7
|
32
|
359.4
|
|
Namibia
|
0
|
0
|
31
|
(
)
|
|
Mali
|
14
|
13
|
20
|
52.6
|
|
Benin
|
0
|
15
|
9
|
-39.9
|
|
Niger
|
0
|
3
|
2
|
-48.8
|
|
Liberia
|
0
|
17
|
0
|
-100.0
|
|
Seychelles
|
0
|
34
|
0
|
-100.0
|
|
Total
U.S. imports for consumption under AGOA (excluding GSP)
|
7,984,240
|
9,450,648
|
12,511,932
|
32.4
|
Source:
USITC DataWeb/USDOC (accessed March 14, 2018).
Note:
Data reflect shipments under HTS chapters 1–97. Because of rounding, figures
may not add up to totals shown. N.e.s.o.i. = not elsewhere specified or
included. Because of rounding, figures may not add up to totals shown.
Undefined.
Table
A.23
Leading U.S. imports for consumption under
CBERA, by HTS 6-digit subheading, 2015–17
|
HTS 6
|
Description
|
2015
|
2016
|
2017
|
2016–17
|
|
|
|
|
Thousand $
|
|
% change
|
|
2905.11
|
Methanol
(methyl alcohol)
|
650,812
|
253,213
|
378,273
|
49.4
|
|
6109.10
|
T-shirts, singlets, tank tops and similar garments
of cotton, knitted or crocheted
|
271,502
|
206,745
|
192,440
|
-6.9
|
|
3903.11
|
Polystyrene,
expandable, in primary forms
|
86,880
|
66,625
|
78,149
|
17.3
|
|
6110.20
|
Sweaters, pullovers, sweatshirts, vests and similar
articles of cotton, knitted or crocheted
|
120,972
|
84,342
|
73,278
|
-13.1
|
|
2709.00
|
Petroleum
oils and oils from bituminous minerals, crude
|
144,871
|
86,200
|
53,648
|
-37.8
|
|
0714.30
|
Yams, fresh, chilled, frozen or dried
|
20,408
|
21,119
|
23,281
|
10.2
|
|
2933.61
|
Melamine
|
4,236
|
12,257
|
16,681
|
36.1
|
|
2106.90
|
Food preparations n.e.s.o.i.
|
13,468
|
15,920
|
14,893
|
-6.4
|
|
2710.19
|
Petroleum
oils, oils from bituminous minerals (other than crude) and products
containing by weight 70% or more of these oils, not biodiesel or waste
|
225
|
298
|
12,441
|
4,068.8
|
|
2103.90
|
Sauces and preparations therefor, n.e.s.o.i.; mixed
condiments and mixed seasonings
|
12,888
|
11,452
|
12,283
|
7.3
|
|
6109.90
|
T-shirts,
singlets, tank tops and similar garments, of textile materials n.e.s.o.i.,
knitted or crocheted
|
17,536
|
11,853
|
11,981
|
1.1
|
|
0804.50
|
Guavas, mangoes and mangosteens, fresh or dried
|
13,804
|
8,421
|
11,942
|
41.8
|
|
2009.19
|
Orange
juice, other than frozen, whether or not sweetened
|
7,912
|
6,476
|
4,709
|
-27.3
|
|
2008.99
|
Fruit and other edible parts of plants, n.e.s.o.i.,
prepared or preserved, whether or not containing added sweetening or spirit,
n.e.s.o.i.
|
5,254
|
6,009
|
4,696
|
-21.8
|
|
2208.40
|
Rum and
tafia
|
2,862
|
3,174
|
4,353
|
37.2
|
|
|
Total of
items shown
|
1,373,632
|
794,103
|
893,047
|
12.5
|
|
|
All
other HTS provisions
|
168,190
|
76,793
|
67,941
|
-11.5
|
|
|
Total of
all commodities
|
1,541,822
|
870,896
|
960,989
|
10.3
|
Source:
USITC DataWeb/USDOC (accessed March 14, 2018).
Note:
Because of rounding, figures may not add up to totals shown.
Table
A.24
U.S. imports for consumption under CBERA,
by source, 2015–17
|
Source
|
2015
|
2016
|
2017
|
2016–17
|
|
|
|
Thousand $
|
|
% change
|
|
Trinidad
and Tobago
|
830,291
|
378,983
|
488,160
|
28.8
|
|
Haiti
|
433,402
|
317,860
|
295,323
|
-7.1
|
|
Bahamas
|
88,389
|
68,403
|
79,826
|
16.7
|
|
Jamaica
|
81,583
|
74,847
|
72,676
|
-2.9
|
|
Belize
|
36,881
|
17,136
|
12,398
|
-27.7
|
|
St. Kitts-Nevis
|
10,481
|
7,210
|
5,122
|
-29.0
|
|
Barbados
|
22,570
|
2,254
|
3,558
|
57.8
|
|
Grenada
|
1,728
|
1,809
|
2,405
|
32.9
|
|
Guyana
|
34,918
|
1,551
|
707
|
-54.5
|
|
St. Lucia
|
1,301
|
627
|
342
|
-45.4
|
|
Antigua
Barbuda
|
82
|
37
|
161
|
330.7
|
|
Curaçao
|
3
|
85
|
124
|
45.6
|
|
St.
Vincent and the Grenadines
|
16
|
45
|
102
|
125.8
|
|
Dominica
|
77
|
22
|
48
|
116.5
|
|
Aruba
|
93
|
15
|
36
|
145.1
|
|
British Virgin Islands
|
9
|
9
|
0
|
-100.0
|
|
Montserrat
|
0
|
0
|
0
|
(
)
|
|
Total U.S.
imports for consumption under CBERA
|
1,541,822
|
870,896
|
960,989
|
10.3
|
Source:
USITC DataWeb/USDOC (accessed March 14, 2018).
Note:
Because of rounding, figures may not add up to totals shown.
Undefined.
Table
A.25
WTO dispute settlement cases to which the
United States was a party, developments in 2017
|
Case no.
|
Title
|
Complainant
|
Action (month/day/year)
|
|
DS217
|
United States—Continued Dumping and Subsidy Offset
Act of 2000 (CDSOA or Byrd Amendment)
|
Australia, Brazil, Chile, European Communities (EC),
India, Indonesia, Japan, South Korea, Thailand
|
Complaining parties request consultations
(12/21/00).
Panel is established (08/23/01) and composed
(10/25/01).
Panel report is circulated (09/16/02).
U.S. notifies Dispute Settlement Body (DSB) it will
appeal panel decision (10/18/02).
Appellate Body report is circulated (01/16/03).
Brazil, Chile, the EC, India, Japan, South Korea,
Canada, and Mexico request DSB authorization to suspend concessions
(01/15/04); U.S. objects and DSB refers the matter arbitration (01/24/04).
Arbitrator circulates decisions and rejects position
of Brazil, Canada, Chile, the EC, India, Japan, South Korea, and Mexico, and
finds it appropriate to rely on the economic effect of the measure
(08/31/04).
Authority to retaliate granted (11/26/04, 12/17/04).
DSB authorizes or takes note of various requests or
agreements to suspend concessions (2004–05).
U.S. states at DSB meeting that recent changes bring
U.S. law into conformity with its WTO obligations (02/17/06).
Japan (2006-2013) and EC (2006-2018) notify DSB
annually of the new list of products on which the additional import duty
would be imposed further to the authorized suspension of concessions.
Japan notifies DSB that, because the level of
authorization was marginal, no suspension of concessions would be applied for
the 10th year starting September 1, 2014 (08/18/14) and similarly notifies
the same for 2015, 2016, and 2017.
|
|
DS316
|
European
Communities—Measures Affecting Trade in Large Civil Aircraft
|
United
States
|
U.S.
requests consultations with EC (10/06/04).
Panel
is established (07/20/05) and composed (10/17/05).
Panel
report is circulated (06/30/10).
European
Union (EU) notifies DSB it will appeal decision to Appellate Body (07/21/10);
U.S. does the same (08/19/10).
Appellate
Body report is circulated (05/18/11).
DSB
adopts Appellate Body and panel reports (06/01/11).
EU
informs DSB it intends to implement DSB recommendation (06/17/11).
EU
informs DSB it has taken steps to bring its measures into conformity with
obligations (12/01/11).
U.S.
requests consultations with EU under Article 21.5 and requests authority to
take countermeasures (12/09/11).
EU
objects to requested level of U.S. measures and requests matter be referred
to arbitration under Article 22.6; DSB refers to arbitration (12/22/11).
U.S.
and EU request arbitrator to suspend work (01/19/12). Arbitrator suspends
work until either party requests resumption (01/20/12).
U.S.
requests establishment of an Article 21.5 compliance panel (03/30/12); panel
established (04/13/12).
Compliance
panel issues report, finding that the EU has largely failed to comply
(09/22/16).
EU
notifies the Appellate Body of its decision to appeal certain issues of law
and interpretation in the panel report (10/13/16).
U.S.
notifies the Appellate Body it will appeal certain issues of law and
interpretation in the panel report (11/10/16).
Appellate
Body circulates its report to members, largely upholding the panel report
(05/18/18).
|
|
DS353
|
United States—Measures Affecting Trade in Large
Civil Aircraft—Second Complaint
|
European Communities
|
EC requests consultations (06/27/05).
Panel is established (02/17/06) and composed
(11/22/06).
Panel chairman informs DSB multiple times that panel
needs additional time to complete work in light of complexities of the
dispute (05/18/07, 07/11/08, 12/16/09, 07/07/10).
Panel report is circulated (03/31/11).
EU notifies DSB that it will appeal the decision to
the Appellate Body (04/01/11); U.S. also notifies its decision to appeal
(04/28/11).
Appellate Body report is circulated (03/12/12); DSB
adopts Appellate Body and panel reports (03/23/12).
U.S. informs DSB it intends to implement DSB
recommendations and rulings (04/13/12).
EU and U.S. inform DSB of agreed procedures under
Articles 21 and 22 of DSU and Article 7 of Agreement on Subsidies and
Countervailing Measures (SCM Agreement) (04/24/12).
U.S. notifies DSB of withdrawal of subsidies and
removal of adverse effects in this dispute, and that it fully complies with
DSB recommendations and rulings (09/23/12).
Compliance proceedings: EU requests consultations
under Article 21.5 (09/25/12), and then requests establishment of a
compliance panel (10/11/12). A compliance panel is established and composed
(10/30/12). The panel chair subsequently informs the DSB several times of
delays in circulating its report due to scale and complexity of the dispute.
Compliance report circulates to members, upholding
certain EU claims and rejecting others (06/09/17).
EU notifies DSB of its decision to appeal certain
issues of law and legal interpretations (06/29/17); and the U.S. notifies the
DSB of its decision to cross-appeal (08/10/17).
Countermeasures
: EU requests authority to take countermeasures under Article 22 of
the DSU (remedies) and Articles 4, 10, and 7.9 of the SCM Agreement
(09/27/12).
U.S. objects to the level of suspension of
concessions and other obligations, and refers the matter to arbitration under
Article 22.6 of the DSU (10/22/12). At the DSB meeting the two parties agree
to refer the matter to arbitration (10/23/10).
U.S. and EU later ask the arbitrator to suspend
arbitration proceedings (11/27/12), and the arbitrator suspends proceedings
(11/28/12).
|
|
DS381
|
United
States—Measures Concerning the Importation, Marketing and Sale of Tuna and
Tuna Products
|
Mexico
|
Mexico
requests consultations with U.S. (10/24/08).
Panel
is established (04/20/09) and composed (12/14/09).
Panel
chairman informs DSB that the panel expects to issue report in February 2011
(06/15/10).
Parties
agree on new panel member following death of one member (08/12/10).
Panel
report is circulated (09/15/11).
U.S.
notifies DSB of its decision to appeal the panel’s decision (01/20/12);
Mexico does the same (01/25/12).
Appellate
Body report is circulated (05/16/12); DSB adopts the Appellate Body and panel
reports (06/13/12).
U.S.
states that it intends to implement DSB recommendations and rulings
(06/25/12), and U.S. and Mexico inform DSB that they have agreed that a reasonable
period of time to do so is by July 13, 2013 (09/17/12).
U.S.
advises DSB that it has made effective a final rule amending dolphin-safe
labeling requirements for tuna and tuna products, bringing its requirements
into compliance (07/23/13).
Mexico
and U.S. inform DSB of agreed procedures under Articles 21 and 22 of the DSU
(08/02/13).
Compliance
proceedings. Mexico requests establishment of a compliance panel (11/14/13);
DSB agrees to refer to the original panel (01/22/14); panel is composed
(01/27/14).
Compliance
panel report circulated to members (04/14/15).
U.S.
notifies DSB of its decision to appeal certain issues of law covered in the
compliance panel report (06/05/15); Mexico files an appeal in the same
dispute (06/10/15).
Appellate
Body report is circulated to members (11/20/15).
DSB
adopts Article 21.5 Appellate Body reports and panel reports, as modified by
Appellate Body reports (12/03/15).Mexico requests Article 22.2 authorization
to suspend concessions (03/10/16).
U.S.
requests Article 22.6 arbitration of Mexico’s request to suspend concessions
(03/22/16) and requests establishment of an Article 21.5 panel to resolve
disagreement over U.S. compliance measures (04/11/16). Panels established and
composed (04/22/16, 05/27/16).
Mexico
requests Article 21.5 (second recourse) consultations with U.S. (05/13/16);
consultations held (06/02/16).
Mexico
requests establishment of an Article 21.5 compliance panel to resolve
disagreement over the U.S. final rule as amended in 2016 (06/09/16).
Compliance
panel composed (07/11/16).
Compliance
panel report circulated to members; panel finds U.S. measures consistent with
Article 2.1 of TBT Agreement and justified under Article XX of GATT 1994
(10/26/17).
Mexico
notifies DSB of decision to appeal certain issues of law and legal
interpretation in the compliance panel report (12/01/17).
|
|
DS427
|
China—Anti-dumping and Countervailing Duty Measures
on Broiler Products from the United States
|
United States
|
U.S. requests consultations (09/20/11).
Panel established (01/20/12) and composed
(05/24/12).
Panel report circulated (08/02/13) and is adopted by
DSB (09/25/13).
China informs DSB it intends to implement DSB
recommendations and rulings (10/22/13).
China and U.S. inform DSB that they have agreed that
a reasonable period of time to implement is by July 9, 2014 (12/19/13).
China informs DSB that it has fully implemented DSB
recommendations and rulings, but U.S. disagrees that China has fully complied
(07/22/14).
China and U.S. inform DSB of agreed procedures under
Articles 21 and 22 of the DSU (07/15/14).
U.S. requests Article 21.5 consultations for China’s
failure to comply with DSB recommendations (05/10/16).
U.S. requests establishment of a compliance panel
(05/27/16); and panel composed ((07/18/16).
Compliance report circulated; panel upheld most of
U.S. claims in its report (01/18/18).
DSB adopts compliance panel report (02/28/18).
|
|
DS430
|
India—Measures
Concerning the Importation of Certain Agricultural Products from the United
States
|
United
States
|
U.S.
requests consultations (03/06/12).
Panel
is established (06/25/12).
Director-General
composes a panel (02/18/13).
Panel
report is circulated (10/14/14).
India,
after receiving an extension, notifies DSB it will appeal the decision to the
Appellate Body (01/26/15).
Appellate
Body issues its report (06/04/15).
DSB
adopts the Appellate Body report and the panel report, as modified by the
Appellate Body report (06/19/15).
India
informs DSB it intends to implement DSB’s recommendations and rulings and
will need a reasonable period of time to do so (07/13/15).
India
and U.S. inform DSB that they have agreed that the reasonable period of time
is 12 months, expiring on June 19, 2016 (12/08/15).
U.S.
requests authorization to suspend concessions for India’s failure to comply
with recommendations and rulings of DSB (07/07/16).
India
objects to level of suspension of concessions/ obligations, requests Article
22.6 arbitration, and informs DSB it has adopted necessary measures to comply
with DSB recommendations and rulings (07/18/16 and 09/22/16).
India
informs DSB of subsequent amendments to its measures to comply with DSB’s
rulings and recommendations (03/02/17).
India
requests establishment of a compliance panel (04/06/17) and DSB agrees
(05/22/17).
Compliance
panel chair informs DSB that it expects to issue its final report by the end
of May 2018 (11/23/17).
|
|
DS436
|
United States—Countervailing Measures on Certain
Hot-Rolled Carbon Steel Flat Products from India
|
India
|
India requests consultations (04/12/12).
Panel is established (08/31/12).
Director-General composes the panel (02/18/13).
Panel report is circulated (07/14/14).
India notifies DSB that it will appeal certain
issues of law and legal interpretation in the panel report (08/08/14).
U.S. files an appeal (08/13/14).
Appellate Body circulates its report (12/08/14).
DSB adopts the Appellate Body report and panel
report as modified (12/19/14).
U.S. informs DSB that it intends to implement DSB’s
recommendations and rulings and will need a reasonable period of time to do so
(01/16/15).
India and U.S. inform DSB that they agree that a
reasonable period of time is 15 months, expiring on March 19, 2016
(03/24/15).
India and U.S. inform DSB they have agreed to modify
the reasonable period of time, to expire April 18, 2016 (03/09/16).
U.S. informs DSB that USITC and USDOC have issued
new final determinations making findings consistent with DSB recommendations
and rulings (04/22/16).
India and U.S. inform DSB of agreed procedures under
DSU Articles 21 and 22 (05/06/16).
India requests consultations with U.S. concerning
U.S. compliance measures (06/05/17).
India requests establishment of a compliance panel
(03/29/18).
|
|
DS437
|
United
States—Countervailing Duty Measures on Certain Products from China
|
China
|
China
requests consultations (05/25/12).
Panel
is established (09/28/12).
Director-General
composes the panel (11/26/12).
Panel
report is circulated (07/14/14).
China
appeals the panel decision to the Appellate Body (08/22/14).
U.S.
files a cross-appeal of a preliminary determination by the panel (08/27/14).
Appellate
Body issues its report (12/18/14).
DSB
adopts Appellate Body and panel reports (01/16/15).
U.S.
informs DSB that it intends to implement DSB’s recommendations and rulings
and that it will need a reasonable period of time to do so (02/13/15).
China
requests that the reasonable period of time be determined through binding
arbitration pursuant to Article 21.3(c) of the DSU (06/26/15).
An
arbitrator determines that the reasonable period of time expires on April 1,
2016 (10/09/15).
China
and U.S. inform DSB of agreed procedures under Articles 21 and 22 of the DSU
(04/15/16).
China
requests DSU Article 21.5 consultations (05/13/16) and subsequently
establishment of a compliance panel (07/08/16).
A
compliance panel is established (07/21/16) and composed (10/05/16).
Compliance
panel report is circulated (03/21/18).
U.S.
notifies DSB it will appeal to the Appellate Body certain issues of law and
legal interpretations in the compliance panel report (04/27/18).
|
|
DS456
|
India—Certain Measures Relating to Solar Cells and
Solar Modules
|
United States
|
U.S. requests consultations (02/06/13); U.S.
requests supplementary consultations (02/10/14).
Panel is established (05/23/14).
Parties agree on composition of panel (09/24/14).
Panel report is circulated to members (02/24/16).
India notifies DSB of its decision to appeal to the
Appellate Body certain issues of law and legal interpretation in the panel
report (04/20/16).
Appellate Body report circulated (09/16/16).
DSB adopts the panel and Appellate Body reports
(10/26/16).
India informs DSB it intends to implement DSB’s
recommendations and rulings (11/08/16).
U.S. and India inform DSB they have agreed that a
reasonable time to implement would be 14 months, expiring on Dec. 14, 2017
(06/16/17).
India informs DSB it has ceased to apply measures
found to be inconsistent (12/14/17).
U.S. requests authorization from DSB to suspend
concessions/obligations on grounds India has failed to comply within a
reasonable time (12/19/17).
India objects and disagrees it has failed to comply
(01/02/18).
Matter is referred to arbitration (01/12/18).
|
|
DS464
|
United
States—Anti-dumping and Countervailing Measures on Large Residential Washers
from South Korea
|
Republic
of Korea (South Korea)
|
South
Korea requests consultations (08/29/13).
Panel
is established (01/22/14).
Director-General
composes the panel (06/20/14).
Panel
report is circulated to members (03/11/16).
U.S.
notifies DSB of its decision to appeal to the Appellate Body certain issues
of law and legal interpretation in the panel report (04/19/16).
Appellate
Body report is circulated (09/07/16).
DSB
adopts Appellate Body and panel reports (09/26/16).
U.S.
states that it intends to implement the DSB’s recommendations and rulings and
will need a reasonable period of time (10/26/16).
South
Korea requests that the reasonable period of time be determined through
arbitration (12/9/16).
Arbitrator
determines that the reasonable period of time is 15 months, expiring on Dec.
26, 2017 (04/13/17).
|
|
DS471
|
United States—Certain Methodologies and Their
Application to Anti-dumping Proceedings Involving China
|
China
|
China requests consultations (12/3/13).
Panel is established (03/26/14).
Director-General composes the panel (08/28/14).
Panel report is circulated (10/19/16).
China notifies DSB it will appeal certain issues of
law and legal interpretation in the panel report (11/18/16).
Appellate Body report is circulated and upholds in
part and reverses in part certain panel findings regarding U.S. Department of
Commerce antidumping methodologies (05/11/17).
U.S. states that it intends to implement the DSB’s
recommendations and rulings and will need a reasonable period of time
(06/19/17).
China requests that reasonable period of time be
determined through arbitration (10/17/17).
Arbitrator determines that the reasonable period of
time is 15 months, expiring on Aug. 22, 2018 (01/19/18).
|
|
DS478
|
Indonesia—Importation
of Horticultural Products, Animals and Animal Products
|
United
States
|
U.S.
requests consultations (05/08/14).
Single
panel established to consider this dispute and DS477 brought by New Zealand
(05/20/15).
Director-General
composes the panel (10/08/15).
Panel
report is circulated (12/22/16).
Indonesia
notifies DSB it will appeal certain issues of law and legal interpretation in
the panel report (02/17/17).
Appellate
Body report is circulated and upholds panel findings that 18 import measures
imposed by Indonesia are inconsistent with Indonesia’s obligations
(11/09/17).
DSB
adopts Appellate Body report and panel report as modified by Appellate Body
(11/22/17).
Indonesia
informs the DSB it will require a reasonable period of time to comply
(12/15/17).
|
|
DS487
|
United States—Conditional Tax Incentives for Large
Civil Aircraft
|
European Union
|
EU requests consultations (12/19/14).
EU requests establishment of a panel (02/12/15);
panel established (02/23/15); panel composed (04/13/15).
Panel circulates its report (11/28/16).
U.S. notifies DSB of its decision to appeal certain
issues of law and legal interpretation in the panel report (12/16/16).
EU notifies DSB it will cross-appeal (01/17/17).
Appellate Body circulates its report, affirming the
panel’s rejection of six of seven EU claims alleging that certain Washington
State tax incentives were inconsistent with U.S. obligations and reversing
the panel finding of U.S. inconsistency on the seventh claim (09/04/17).
DSB adopts Appellate Body report and panel report as
modified by the Appellate Body (09/22/17).
|
|
DS488
|
United
States—Anti-dumping Measures on Certain Oil Country Tubular Goods from South
Korea
|
South
Korea
|
South
Korea requests consultations (12/22/14).
DSB
establishes a panel (03/25/15).
Parties
agree on composition of panel (07/13/15).
Panel
circulates its report; panel finds the U.S. acted inconsistently with its obligations
in several respects and rejects other claims of South Korea (11/14/17).
The DSB
adopts the panel report (01/12/18).
U.S.
and South Korea agree that a reasonable time for U.S. to implement the
panel’s recommendations and rulings is by January 19, 2019 (01/12/18).
|
|
DS491
|
United States—Anti-dumping Measures and
Countervailing Measures on Certain Coated Paper from Indonesia
|
Indonesia
|
Indonesia requests consultations (03/13/15).
DSB establishes a panel (09/28/15).
Director-General composes the panel (02/04/16).
Panel report rejecting all of Indonesia’s claims is
circulated to members (12/06/17).
DSB adopts the panel report (01/12/18).
|
|
DS501
|
China—Tax
Measures Concerning Certain Domestically Produced Aircraft
|
United
States
|
U.S.
requests consultations (12/08/15).
|
|
DS503
|
United States—Measures Concerning Non-Immigrant
Visas
|
India
|
India requests consultations (03/03/16).
|
|
DS505
|
United
States—Countervailing Measures on Supercalendered Paper from Canada
|
Canada
|
Canada
requests consultations (03/30/16).
DSB establishes
a panel (07/21/16).
Director-General
composes the panel (08/31/16).
Panel
chair informs DSB panel expects to issue final report before the end of 2017
(01/27/17).
|
|
DS508
|
China—Export Duties on Certain Raw Materials
|
United States
|
U.S. requests consultations (07/13/16).
DSB establishes a panel (11/08/16).
|
|
DS510
|
U.S.—Certain
Measures Relating to the Renewable Energy Sector
|
India
|
India
requests consultations (09/09/16).
DSB
establishes a panel (03/21/17).
Director-General
composes the panel (04/24/18).
|
|
DS511
|
China—Domestic Support for Agricultural Producers
|
United States
|
U.S. requests consultations (09/13/16).
DSB establishes a panel (01/25/17).
Parties agree on panel composition (06/24/17).
Panel chair informs DSB panel expects to issue final
report no earlier than third quarter 2018 (02/22/18).
|
|
DS514
|
United
States—Countervailing Measures on Cold- and Hot-Rolled Steel Flat Products
from Brazil
|
Brazil
|
Brazil
requests consultations (11/11/16).
|
|
DS515
|
United States—Measures Related to Price Comparison
Methodologies
|
China
|
China requests consultations (12/12/16).
|
|
DS517
|
China—Tariff
Rate Quotas for Certain Agricultural Products
|
United
States
|
U.S.
requests consultations (12/15/16).
DSB
establishes a panel (09/22/17).
Director-General
composes the panel (02/12/18).
|
|
DS519
|
China—Subsidies to Producers of Primary Aluminum
|
United States
|
U.S. requests consultations (01/12/17).
|
|
DS520
|
Canada—Measures
Governing the Sale of Wine in Grocery Stores
|
United
States
|
U.S.
requests consultations (01/18/17).
|
|
DS523
|
United States—Countervailing Measures on Certain
Pipe and Tube Products (Turkey)
|
Turkey
|
Turkey requests consultations (03/08/17).
DSB establishes a panel (06/19/17).
Director-General composes the panel (09/14/17).
Panel chair informs DSB it expects to issue final
report in second half of 2018 (03/06/18).
|
|
DS531
|
Canada—Measures
Governing the Sale of Wine in Grocery Stores (second complaint)
|
United
States
|
U.S.
requests consultations (09/28/17).
|
|
DS533
|
United States—Countervailing Measures on Softwood Lumber
from Canada
|
Canada
|
Canada requests consultations (11/28/17).
DSB establishes a panel (04/09/18).
|
|
DS534
|
United
States—Anti-Dumping Measures Applying Differential Pricing Methodology to
Softwood Lumber from Canada
|
Canada
|
Canada
requests consultations (11/28/17).
DSB
establishes a panel (04/09/18).
|
|
DS535
|
United States—Certain Systemic Trade Remedies
Measures
|
Canada
|
Canada requests consultations (12/20/17).
|
Source: WTO, “
Chronological
List of Dispute Cases
” (accessed May 23, 2018).
Table
A.26
NAFTA Chapter 19 substantive challenges to
original and five-year review determinations of USITC and USDOC, developments
in 2017
|
Panel review no.
|
Dispute
|
Action (month/day/year)
|
|
MEX-USA-2012-1904-01
|
Chicken thighs and legs from the United States (AD)
(Investigating authority: Secretaría de Economía)
|
Request for panel review (09/03/12). Oral argument
hearing date (08/25/15). Decision date 1 (04/21/17). Decision date 2
(12/20/17) Status: Completed.
|
|
MEX-USA-2015-1904-01
|
Ammonium
sulfate from U.S. and China (AD) (Investigating authority: Secretaría de
Economía)
|
Request
for panel review (11/06/15). Oral argument hearing date (06/25/18) Status:
Active.
|
|
USA-CDA-2015-1904-01
|
Supercalendered paper from Canada (AD)
(Investigating authority: International Trade Administration)
|
Request for panel review (11/18/15). Oral argument
hearing date (10/25/16); Decision date (04/13/17). Consent Motion to Stay
Proceedings for 60 days affirmed by panel (04/06/18).
Status: Suspended/stayed.
|
|
MEX-USA-2016-1904-01
|
Ethylene
glycol monobutyl ether (AD) (Investigating authority: Secretaría de Economía)
|
Request
for panel review (06/24/2016). Status: Active.
|
|
CDA-USA-2017-1904-01
|
Certain gypsum board originating in or exported from
the United States (Investigating Authority: Canadian International Trade
Tribunal)
|
Request for panel review (02/06/17). Decision: panel
review was terminated by joint consent of the participants. Status:
Terminated.
|
|
USA-MEX-2017-1904-01
|
Certain
circular welded non-alloy steel pipe from Mexico (AR) (Investigating
authority: International Trade Administration)
|
Request
for panel review (07/12/17). Status: Active.
|
|
USA-CDA-2017-1904-02
|
Certain softwood lumber products from Canada (CVD)
(Investigating authority: International Trade Administration)
|
Request for panel review (11/14/17). Status: Active.
|
|
USA-CDA-2017-1904-03
|
Certain
softwood lumber products from Canada (AD) (Investigating authority:
International Trade Administration)
|
Request
for panel review (12/05/17). Status: Active.
|
Source:
NAFTA Secretariat, “
Status Report: NAFTA
and FTA Dispute Settlement Proceedings
” (accessed May 16, 2017).
Note:
This list includes active cases during 2017, including those in which little if
any formal action occurred during 2017. AD means “antidumping duty,” CVD means
“countervailing duty,” and AR means “administrative review.”
Table
A.27
U.S. total exports to the EU, by USITC
digest sector, 2015–17
|
Sector
|
Description
|
2015
|
2016
|
2017
|
2016–17
|
|
|
|
|
Million $
|
|
% change
|
|
1
|
Agricultural
products
|
14,146
|
13,344
|
13,475
|
1.0
|
|
2
|
Forest products
|
5,339
|
5,070
|
5,210
|
2.8
|
|
3
|
Chemicals
and related products
|
62,883
|
60,644
|
59,603
|
-1.7
|
|
4
|
Energy-related products
|
16,664
|
13,916
|
20,164
|
44.9
|
|
5
|
Textiles
and apparel
|
2,613
|
2,563
|
2,583
|
0.8
|
|
6
|
Footwear
|
89
|
88
|
104
|
19.2
|
|
7
|
Minerals
and metals
|
22,405
|
21,970
|
24,552
|
11.8
|
|
8
|
Machinery
|
20,779
|
20,028
|
21,497
|
7.3
|
|
9
|
Transportation
equipment
|
59,713
|
63,851
|
64,967
|
1.7
|
|
10
|
Electronic products
|
48,388
|
47,848
|
50,897
|
6.4
|
|
11
|
Miscellaneous
manufactures
|
10,443
|
12,034
|
11,663
|
-3.1
|
|
12
|
Special provisions
|
8,417
|
8,261
|
8,802
|
6.6
|
|
|
Total
|
271,879
|
269,617
|
283,517
|
5.2
|
Source:
USITC DataWeb/USDOC (accessed March 14, 2018).
Note:
Because of rounding, figures may not add up to totals shown.
Table
A.28
U.S. general imports from the EU, by USITC
digest sector, 2015–17
|
Sector
|
Description
|
2015
|
2016
|
2017
|
2016–17
|
|
|
|
|
Million $
|
|
% change
|
|
1
|
Agricultural
products
|
23,522
|
24,671
|
26,233
|
6.3
|
|
2
|
Forest products
|
5,122
|
5,323
|
5,814
|
9.2
|
|
3
|
Chemicals
and related products
|
105,972
|
106,679
|
107,114
|
0.4
|
|
4
|
Energy-related products
|
14,271
|
12,049
|
12,975
|
7.7
|
|
5
|
Textiles
and apparel
|
6,066
|
5,680
|
5,865
|
3.3
|
|
6
|
Footwear
|
2,055
|
2,053
|
2,099
|
2.2
|
|
7
|
Minerals
and metals
|
30,019
|
27,187
|
29,614
|
8.9
|
|
8
|
Machinery
|
46,112
|
44,193
|
48,502
|
9.8
|
|
9
|
Transportation
equipment
|
105,950
|
95,760
|
99,795
|
4.2
|
|
10
|
Electronic products
|
44,945
|
48,518
|
50,124
|
3.3
|
|
11
|
Miscellaneous
manufactures
|
19,200
|
18,760
|
19,965
|
6.4
|
|
12
|
Special provisions
|
24,304
|
25,503
|
26,835
|
5.2
|
|
|
Total
|
427,537
|
416,377
|
434,933
|
4.5
|
Source:
USITC DataWeb/USDOC (accessed March 14, 2018).
Note:
Because of rounding, figures may not add up to totals shown.
Table
A.29
Leading U.S. total exports to the EU, by
HTS 6-digit subheading, 2015–17
|
HTS 6
|
Description
|
2015
|
2016
|
2017
|
2016–17
|
|
|
|
|
Million $
|
|
% change
|
|
8800.00
|
Civilian
aircraft, engines, and parts
|
32,876
|
36,531
|
36,945
|
1.1
|
|
3004.90
|
Medicaments, in measured doses, etc. (excluding
vaccines, etc., coated bandages etc., and pharmaceutical goods), n.e.s.o.i.
|
11,277
|
10,343
|
8,861
|
-14.3
|
|
2710.19
|
Petroleum
oils, oils from bituminous minerals (other than crude) and products
containing by weight 70% or more of these oils, not biodiesel or waste
|
10,394
|
7,161
|
7,027
|
-1.9
|
|
2709.00
|
Petroleum oils and oils from bituminous minerals,
crude
|
306
|
1,566
|
5,701
|
264.1
|
|
3002.15
|
Immunological
products, put up in measured doses or in forms or packings for retail sale
|
(
)
|
(
)
|
5,223
|
(
)
|
|
9701.10
|
Paintings, drawings and pastels, hand executed works
of art, framed or not framed
|
3,593
|
4,908
|
5,051
|
2.9
|
|
7108.12
|
Gold,
nonmonetary, unwrought n.e.s.o.i. (other than powder)
|
3,670
|
3,983
|
4,985
|
25.2
|
|
8517.62
|
Machines for the reception, conversion and
transmission or regeneration of voice, images or other data, including
switching and routing apparatus
|
3,692
|
3,963
|
4,542
|
14.6
|
|
9018.90
|
Instruments
and appliances for medical, surgical or veterinary sciences, n.e.s.o.i., and
parts and accessories thereof
|
4,395
|
4,369
|
4,321
|
-1.1
|
|
3002.12
|
Antisera and other blood fractions
|
(
)
|
(
)
|
4,087
|
(
)
|
|
2701.12
|
Bituminous
coal, whether or not pulverized, but not agglomerated
|
2,464
|
1,614
|
3,381
|
109.5
|
|
8703.33
|
Passenger motor vehicles with compression-ignition
internal combustion piston engine (diesel), cylinder capacity over 2,500 cc
|
3,855
|
3,890
|
3,349
|
-13.9
|
|
3822.00
|
Composite
diagnostic or laboratory reagents, other than pharmaceutical preparations of
heading 3002 or 3006
|
2,729
|
2,856
|
3,082
|
7.9
|
|
7102.39
|
Diamonds, nonindustrial, worked, including polished
or drilled
|
3,535
|
3,692
|
3,062
|
-17.1
|
|
9018.39
|
Medical
etc., needles n.e.s.o.i., catheters, cannulae and the like; parts and
accessories thereof
|
2,870
|
2,899
|
2,799
|
-3.5
|
|
|
Total of
items shown
|
85,655
|
87,775
|
102,415
|
16.7
|
|
|
All
other products
|
186,224
|
181,842
|
181,103
|
-0.4
|
|
|
Total of
all commodities
|
271,879
|
269,617
|
283,517
|
5.2
|
Source:
USITC DataWeb/USDOC (accessed March 14, 2018).
Note:
Data reflect shipments under HTS chapters 1–97. Because of rounding, figures
may not add up to totals shown. N.e.s.o.i. = not elsewhere specified or
included.
Trade in
2015 and 2016 reported under HTS subheading 3002.10.
Undefined.
Table
A.30
Leading U.S. total imports from the EU, by
HTS 6-digit subheading, 2015–17
|
HTS 6
|
Description
|
2015
|
2016
|
2017
|
2016–17
|
|
|
|
|
Million $
|
|
% change
|
|
8703.23
|
Passenger
motor vehicles with spark-ignition internal combustion reciprocating piston
engine, cylinder capacity over 1,500 cc but not over 3,000 cc
|
24,217
|
26,686
|
29,780
|
11.6
|
|
3004.90
|
Medicaments, in measured doses, etc. (excluding
vaccines, etc., coated bandages etc., and pharmaceutical goods), n.e.s.o.i.
|
23,432
|
25,123
|
25,652
|
2.1
|
|
8703.24
|
Passenger
motor vehicles with spark-ignition internal combustion reciprocating piston
engine, cylinder capacity over 3,000 cc
|
17,934
|
13,496
|
10,186
|
-24.5
|
|
8411.91
|
Parts of turbojets or turbopropellers
|
7,564
|
6,945
|
8,008
|
15.3
|
|
2710.12
|
Light
oils and preparations containing 70% by weight petroleum oils or oils from
bituminous minerals, not containing biodiesel, not waste oils
|
9,023
|
7,644
|
7,953
|
4.0
|
|
8802.40
|
Airplanes and other aircraft n.e.s.o.i., of an
unladen weight exceeding 15,000 kg
|
7,259
|
5,476
|
6,363
|
16.2
|
|
9701.10
|
Paintings,
drawings and pastels, hand executed works of art, framed or not framed
|
6,695
|
5,251
|
5,823
|
10.9
|
|
3002.15
|
Immunological products, put up in measured doses or
in forms or packings for retail sale
|
(
)
|
(
)
|
5,741
|
(
)
|
|
8803.30
|
Parts
of airplanes or helicopters, n.e.s.o.i.
|
4,344
|
4,641
|
5,093
|
9.7
|
|
3004.39
|
Medicaments, in measured doses, etc., containing
hormones or other steroids used primarily as hormones, but not containing
antibiotics, n.e.s.o.i.
|
4,535
|
5,370
|
5,060
|
-5.8
|
|
3002.20
|
Vaccines
for human medicine
|
4,988
|
3,615
|
4,483
|
24.0
|
|
2934.99
|
Nucleic acids and their salts, whether or not
chemically defined; other heterocyclic compounds, n.e.s.o.i.
|
7,245
|
4,343
|
3,425
|
-21.2
|
|
3002.12
|
Antisera
and other blood fractions
|
|
|
3,282
|
|
|
7102.39
|
Diamonds, nonindustrial, worked, including polished
or drilled
|
4,062
|
3,672
|
3,273
|
-10.9
|
|
3002.13
|
Immunological
products, unmixed, not put up in measured doses or in forms or packings for
retail sale
|
(
)
|
(
)
|
3,121
|
(
)
|
|
|
Total of items
shown
|
121,296
|
112,262
|
127,244
|
13.3
|
|
|
All
other products
|
306,240
|
304,115
|
307,689
|
1.2
|
|
|
Total of
all commodities
|
427,537
|
416,377
|
434,933
|
4.5
|
Source:
USITC DataWeb/USDOC (accessed March 14, 2018).
Note:
Because of rounding, figures may not add up to totals shown.
Trade in
2015 and 2016 reported under HTS subheading 3002.10.
Undefined.
Table
A.31
U.S. total exports to China, by USITC
digest sector, 2015–17
|
Sector
|
Description
|
2015
|
2016
|
2017
|
2016–17
|
|
|
|
|
Million $
|
|
% change
|
|
1
|
Agricultural
products
|
21,664
|
22,929
|
21,091
|
-8.0
|
|
2
|
Forest products
|
6,431
|
6,796
|
7,532
|
10.8
|
|
3
|
Chemicals
and related products
|
14,248
|
14,372
|
16,681
|
16.1
|
|
4
|
Energy-related products
|
2,628
|
3,010
|
9,000
|
199.0
|
|
5
|
Textiles
and apparel
|
1,010
|
892
|
932
|
4.5
|
|
6
|
Footwear
|
81
|
90
|
109
|
21.0
|
|
7
|
Minerals
and metals
|
7,999
|
7,342
|
9,046
|
23.2
|
|
8
|
Machinery
|
10,025
|
9,602
|
10,417
|
8.5
|
|
9
|
Transportation
equipment
|
28,767
|
27,700
|
31,963
|
15.4
|
|
10
|
Electronic products
|
21,167
|
20,972
|
21,529
|
2.7
|
|
11
|
Miscellaneous
manufactures
|
956
|
875
|
898
|
2.6
|
|
12
|
Special provisions
|
955
|
1,023
|
1,172
|
14.6
|
|
|
Total
|
115,932
|
115,602
|
130,370
|
12.8
|
Source:
USITC DataWeb/USDOC (accessed March 14, 2018).
Note:
Because of rounding, figures may not add up to totals shown.
Table
A.32
U.S. general imports from China, by USITC
digest sector, 2015–17
|
Sector
|
Description
|
2015
|
2016
|
2017
|
2016–17
|
|
|
|
|
Million $
|
|
% change
|
|
1
|
Agricultural
products
|
6,802
|
6,719
|
7,072
|
5.3
|
|
2
|
Forest products
|
9,517
|
9,562
|
9,819
|
2.7
|
|
3
|
Chemicals
and related products
|
30,995
|
29,810
|
33,581
|
12.7
|
|
4
|
Energy-related products
|
538
|
717
|
686
|
-4.3
|
|
5
|
Textiles
and apparel
|
48,887
|
45,204
|
45,029
|
-0.4
|
|
6
|
Footwear
|
17,276
|
14,821
|
14,255
|
-3.8
|
|
7
|
Minerals
and metals
|
32,057
|
30,242
|
32,958
|
9.0
|
|
8
|
Machinery
|
50,524
|
48,427
|
53,018
|
9.5
|
|
9
|
Transportation
equipment
|
23,920
|
24,235
|
26,357
|
8.8
|
|
10
|
Electronic products
|
189,217
|
180,404
|
205,606
|
14.0
|
|
11
|
Miscellaneous
manufactures
|
67,899
|
67,044
|
71,062
|
6.0
|
|
12
|
Special provisions
|
5,558
|
5,432
|
6,152
|
13.3
|
|
|
Total
|
483,189
|
462,618
|
505,597
|
9.3
|
Source:
USITC DataWeb/USDOC (accessed March 14, 2018).
Note:
Because of rounding, figures may not add up to totals shown.
Table
A.33
Leading U.S. total exports to China, by HTS
6-digit subheading, 2015–17
|
HTS 6
|
Description
|
2015
|
2016
|
2017
|
2016–17
|
|
|
|
|
Million $
|
|
% change
|
|
8800.00
|
Civilian
aircraft, engines, and parts
|
15,440
|
14,576
|
16,266
|
11.6
|
|
1201.90
|
Soybeans, other than seed
|
10,501
|
14,182
|
12,356
|
-12.9
|
|
8703.23
|
Passenger
motor vehicles with spark-ignition internal combustion reciprocating piston
engine, cylinder capacity over 1,500 cc but not over 3,000 cc
|
6,606
|
6,957
|
6,524
|
-6.2
|
|
2709.00
|
Petroleum oils and oils from bituminous minerals,
crude
|
15
|
361
|
4,434
|
1,129.7
|
|
8542.31
|
Processors
and controllers, electronic integrated circuits
|
3,474
|
3,847
|
3,107
|
-19.2
|
|
8486.20
|
Machines and apparatus for the manufacture of
semiconductor devices or of electronic integrates circuits
|
1,423
|
1,741
|
2,003
|
15.0
|
|
8703.24
|
Passenger
motor vehicles with spark-ignition internal combustion reciprocating piston
engine, cylinder capacity over 3,000 cc
|
1,966
|
792
|
1,983
|
150.4
|
|
7404.00
|
Copper waste and scrap
|
1,681
|
1,359
|
1,712
|
26.0
|
|
2711.12
|
Propane,
liquefied
|
912
|
817
|
1,650
|
102.0
|
|
8703.80
|
Motor vehicles with only electric motor, n.e.s.o.i.
|
(
)
|
(
)
|
1,526
|
(
)
|
|
8542.39
|
Electronic
integrated circuits, n.e.s.o.i.
|
737
|
777
|
1,209
|
55.5
|
|
7602.00
|
Aluminum waste and scrap
|
1,306
|
918
|
1,173
|
27.8
|
|
4703.21
|
Chemical
woodpulp, soda or sulfate, other than dissolving grades, semibleached or
bleached, coniferous
|
850
|
954
|
1,127
|
18.2
|
|
8708.99
|
Parts and accessories for motor vehicles, n.e.s.o.i.
|
720
|
883
|
1,008
|
14.2
|
|
3004.90
|
Medicaments,
in measured doses, etc. (excluding vaccines, etc., coated bandages etc., and
pharmaceutical goods), n.e.s.o.i.
|
746
|
721
|
972
|
34.9
|
|
|
Total of items
shown
|
46,377
|
48,884
|
57,052
|
16.7
|
|
|
All
other products
|
69,555
|
66,718
|
73,318
|
9.9
|
|
|
Total of
all commodities
|
115,932
|
115,602
|
130,370
|
12.8
|
Source:
USITC DataWeb/USDOC (accessed March 14, 2018).
Note:
Data reflect shipments under HTS chapter 1-97. Because of rounding, figures may
not add up to totals shown. N.e.s.o.i. = not elsewhere specified or included.
Trade in
2015 and 2016 reported under HTS subheading 8703.90.
Undefined.
Table
A.34
Leading U.S. general imports from China, by
HTS 6-digit subheading, 2015–17
|
HTS 6
|
Description
|
2015
|
2016
|
2017
|
2016–17
|
|
|
|
|
Million $
|
|
% change
|
|
8517.12
|
Telephones
for cellular networks or for other wireless networks
|
40,410
|
37,051
|
44,566
|
20.3
|
|
8471.30
|
Portable automatic data processing machines, weight
not more than 10 kg, consisting of at least a central processing unit,
keyboard & a display
|
36,664
|
33,612
|
37,306
|
11.0
|
|
8517.62
|
Machines
for the reception, conversion and transmission or regeneration of voice, images
or other data, including switching and routing apparatus
|
16,834
|
18,993
|
022,692
|
19.5
|
|
8473.30
|
Parts and accessories for automatic data processing
machines and units thereof, magnetic or optical readers, transcribing
machines, etc., n.e.s.o.i.
|
10,819
|
10,209
|
15,008
|
47.0
|
|
9503.00
|
Tricycles,
scooters, pedal cars and similar wheeled toys; dolls' carriages; dolls; other
toys; etc.
|
11,535
|
12,003
|
12,239
|
2.0
|
|
8504.40
|
Electrical static converters; power supplies for automatic
data processing machines or units of 8471
|
4,748
|
4,421
|
4,614
|
4.3
|
|
8528.52
|
Other
monitors capable of directly connecting to and designed for use with machines
of heading 8471
|
(
)
|
(
)
|
4,532
|
(
)
|
|
9504.50
|
Video game consoles and machines, other than those
of subheading 9504.30
|
4,690
|
3,548
|
4,500
|
26.8
|
|
8523.51
|
Solid-state
nonvolatile semiconductor storage devices
|
2,702
|
3,014
|
4,459
|
47.9
|
|
8471.50
|
Digital processing units other than those of 8471.41
and 8471.49, n.e.s.o.i.
|
3,230
|
3,255
|
4,416
|
35.7
|
|
8528.72
|
Reception
apparatus for television, color, n.e.s.o.i.
|
4,362
|
3,345
|
4,036
|
20.7
|
|
9401.61
|
Seats with wooden frames, upholstered, n.e.s.o.i.
|
3,355
|
3,452
|
3,774
|
9.3
|
|
9403.20
|
Metal
furniture, n.e.s.o.i.
|
3,113
|
3,192
|
3,531
|
10.6
|
|
9405.40
|
Electric lamps and lighting fittings, n.e.s.o.i.
|
2,614
|
2,944
|
3,115
|
5.8
|
|
4202.92
|
Container
bags, boxes, cases and satchels n.e.s.o.i., with outer surface of sheeting of
plastics or of textile materials
|
3,159
|
2,915
|
3,003
|
3.0
|
|
|
Total of
items shown
|
148,236
|
141,955
|
171,791
|
21.0
|
|
|
All
other products
|
334,952
|
320,663
|
333,806
|
4.1
|
|
|
Total of
all commodities
|
483,189
|
462,618
|
505,597
|
9.3
|
Source:
USITC DataWeb/USDOC (accessed March 14, 2018).
Note:
Data reflect shipments under HTS chapters 1-97. Because of rounding, figures
may not add up to totals shown. N.e.s.o.i. = not elsewhere specified or
included.
Trade in
2015 and 2016 reported under HTS subheading 8528.51.
Undefined.
Table
A.35
U.S. total exports to Canada, by USITC
digest sector, 2015–17
|
Sector
|
Description
|
2015
|
2016
|
2017
|
2016–17
|
|
|
|
|
Million $
|
|
% change
|
|
1
|
Agricultural
products
|
26,124
|
25,884
|
26,196
|
1.2
|
|
2
|
Forest products
|
10,199
|
9,710
|
9,890
|
1.9
|
|
3
|
Chemicals
and related products
|
38,198
|
36,511
|
38,342
|
5.0
|
|
4
|
Energy-related products
|
22,256
|
17,462
|
19,664
|
12.6
|
|
5
|
Textiles
and apparel
|
5,205
|
5,076
|
5,215
|
2.7
|
|
6
|
Footwear
|
500
|
509
|
498
|
-2.2
|
|
7
|
Minerals
and metals
|
26,459
|
24,907
|
26,274
|
5.5
|
|
8
|
Machinery
|
29,164
|
26,254
|
27,468
|
4.6
|
|
9
|
Transportation
equipment
|
74,345
|
73,560
|
78,092
|
6.2
|
|
10
|
Electronic products
|
32,447
|
31,451
|
32,542
|
3.5
|
|
11
|
Miscellaneous
manufactures
|
8,847
|
8,454
|
8,806
|
4.2
|
|
12
|
Special provisions
|
7,110
|
7,020
|
9,483
|
35.1
|
|
|
Total
|
280,855
|
266,797
|
282,472
|
5.9
|
Source:
USITC DataWeb/USDOC (accessed March 14, 2018).
Note:
Because of rounding, figures may not add up to totals shown.
Table
A.36
U.S. general imports from Canada, by USITC
digest sector, 2015–17
|
Sector
|
Description
|
2015
|
2016
|
2017
|
2016–17
|
|
|
|
|
Million $
|
|
% change
|
|
1
|
Agricultural
products
|
25,286
|
25,246
|
26,106
|
3.4
|
|
2
|
Forest products
|
18,069
|
18,704
|
19,116
|
2.2
|
|
3
|
Chemicals
and related products
|
32,211
|
29,680
|
29,449
|
-0.8
|
|
4
|
Energy-related products
|
70,837
|
54,755
|
74,241
|
35.6
|
|
5
|
Textiles
and apparel
|
2,243
|
2,181
|
2,231
|
2.3
|
|
6
|
Footwear
|
73
|
50
|
52
|
4.1
|
|
7
|
Minerals
and metals
|
29,762
|
28,778
|
31,585
|
9.8
|
|
8
|
Machinery
|
12,918
|
12,164
|
13,535
|
11.3
|
|
9
|
Transportation
equipment
|
73,911
|
73,639
|
71,873
|
-2.4
|
|
10
|
Electronic products
|
8,932
|
8,929
|
9,342
|
4.6
|
|
11
|
Miscellaneous
manufactures
|
5,250
|
5,537
|
5,250
|
-5.2
|
|
12
|
Special provisions
|
16,738
|
18,095
|
17,195
|
-5.0
|
|
|
Total
|
296,230
|
277,756
|
299,975
|
8.0
|
Source:
USITC DataWeb/USDOC (accessed March 14, 2018).
Note:
Because of rounding, figures may not add up to totals shown.
Table
A.37
Leading U.S. total exports to Canada, by
HTS 6-digit subheading, 2015–17
|
HTS 6
|
Description
|
2015
|
2016
|
2017
|
2016–17
|
|
|
|
|
Million $
|
|
% change
|
|
8703.24
|
Passenger
motor vehicles with spark-ignition internal combustion reciprocating piston
engine, cylinder capacity over 3,000 cc
|
6,653
|
7,446
|
8,569
|
15.1
|
|
8704.31
|
Motor vehicles for goods transport n.e.s.o.i., with
spark-ignition internal combustion piston engine, gvw not over 5 metric tons
|
6,243
|
7,420
|
8,458
|
14.0
|
|
8800.00
|
Civilian
aircraft, engines, and parts
|
8,318
|
7,550
|
8,274
|
9.6
|
|
2709.00
|
Petroleum oils and oils from bituminous minerals,
crude
|
8,159
|
5,648
|
6,137
|
8.6
|
|
2710.12
|
Light oils
and preparations containing 70% by weight petroleum oils or oils from
bituminous minerals, not containing biodiesel, not waste oils
|
5,044
|
5,209
|
5,500
|
5.6
|
|
8708.29
|
Parts and accessories of bodies (including cabs) for
motor vehicles, n.e.s.o.i.
|
4,753
|
5,187
|
4,931
|
-4.9
|
|
8703.23
|
Passenger
motor vehicles with spark-ignition internal combustion reciprocating piston
engine, cylinder capacity over 1,500 cc but not over 3,000 cc
|
6,273
|
5,661
|
4,199
|
-25.8
|
|
8407.34
|
Spark-ignition reciprocating piston engines for propulsion
of vehicles except railway or tramway stock, over 1,000 cc cylinder capacity
|
3,005
|
3,922
|
3,837
|
-2.2
|
|
2710.19
|
Petroleum
oils, oils from bituminous minerals (other than crude) and products
containing by weight 70% or more of these oils, not biodiesel or waste
|
4,032
|
2,784
|
2,954
|
6.1
|
|
8708.99
|
Parts and accessories for motor vehicles, n.e.s.o.i.
|
2,757
|
2,820
|
2,802
|
-0.6
|
|
2711.21
|
Natural
gas, gaseous
|
2,229
|
1,593
|
2,532
|
59.0
|
|
8708.40
|
Gear boxes for motor vehicles
|
1,928
|
2,015
|
2,302
|
14.2
|
|
8517.62
|
Machines
for the reception, conversion and transmission or regeneration of voice,
images or other data, including switching and routing apparatus
|
1,971
|
1,949
|
2,251
|
15.5
|
|
8471.30
|
Portable automatic data processing machines, weight
not more than 10 kg, consisting of at least a central processing unit,
keyboard & a display
|
2,053
|
2,034
|
2,144
|
5.4
|
|
3004.90
|
Medicaments,
in measured doses, etc. (excluding vaccines, etc., coated bandages etc., and
pharmaceutical goods), n.e.s.o.i.
|
2,188
|
2,050
|
1,876
|
-8.5
|
|
|
Total of items
shown
|
65,608
|
63,286
|
66,766
|
5.5
|
|
|
All
other products
|
215,247
|
203,511
|
215,706
|
6.0
|
|
|
Total of
all commodities
|
280,855
|
266,797
|
282,472
|
5.9
|
Source:
USITC DataWeb/USDOC (accessed March 14, 2018).
Note:
Data reflect shipments under HTS chapters 1–97. Because of rounding, figures
may not add up to totals shown. N.e.s.o.i. = not elsewhere specified or
included; gvw = gross vehicle weight.
Table
A.38
Leading U.S. general imports from Canada,
by HTS 6-digit subheading, 2015–17
|
HTS 6
|
Description
|
2015
|
2016
|
2017
|
2016–17
|
|
|
|
|
Million $
|
|
% change
|
|
2709.00
|
Petroleum
oils and oils from bituminous minerals, crude
|
46,982
|
36,186
|
50,122
|
38.5
|
|
8703.24
|
Passenger motor vehicles with spark-ignition
internal combustion reciprocating piston engine, cylinder capacity over 3,000
cc
|
21,072
|
21,848
|
21,360
|
-2.2
|
|
8703.23
|
Passenger
motor vehicles with spark-ignition internal combustion reciprocating piston
engine, cylinder capacity over 1,500 cc but not over 3,000 cc
|
21,044
|
21,521
|
15,062
|
-30.0
|
|
2711.21
|
Natural gas, gaseous
|
6,893
|
5,666
|
7,302
|
28.9
|
|
4407.10
|
Coniferous
wood sawn or chipped lengthwise, sliced or peeled, whether or not planed,
etc., over 6 mm (.236 in.) thick
|
4,425
|
5,549
|
5,793
|
4.4
|
|
8703.22
|
Passenger motor vehicles with spark-ignition
internal combustion reciprocating piston engine, cylinder capacity over 1,000
cc but not over 1,500 cc
|
90
|
1,317
|
5,494
|
317.1
|
|
2710.19
|
Petroleum
oils, oils from bituminous minerals (other than crude) and products
containing by weight 70% or more of these oils, not biodiesel or waste
|
5,862
|
3,443
|
4,937
|
43.4
|
|
2710.12
|
Light oils and preparations containing 70% by weight
petroleum oils or oils from bituminous minerals, not containing biodiesel,
not waste oils
|
4,749
|
3,755
|
4,818
|
28.3
|
|
8708.29
|
Parts
and accessories of bodies (including cabs) for motor vehicles, n.e.s.o.i.
|
3,703
|
3,452
|
3,353
|
-2.8
|
|
7601.10
|
Aluminum, not alloyed, unwrought
|
2,141
|
2,321
|
3,233
|
39.3
|
|
7108.12
|
Gold,
nonmonetary, unwrought n.e.s.o.i. (other than powder)
|
2,618
|
3,057
|
2,495
|
-18.4
|
|
2716.00
|
Electrical energy
|
2,462
|
2,192
|
2,375
|
8.4
|
|
3004.90
|
Medicaments,
in measured doses, etc. (excluding vaccines, etc., coated bandages etc., and
pharmaceutical goods), n.e.s.o.i.
|
3,722
|
3,421
|
2,314
|
-32.4
|
|
7601.20
|
Aluminum alloys, unwrought
|
2,484
|
1,903
|
2,240
|
17.7
|
|
8407.34
|
Spark-ignition
reciprocating piston engines for propulsion of vehicles except railway or
tramway stock, over 1,000 cc cylinder capacity
|
2,403
|
2,436
|
2,235
|
-8.3
|
|
|
Total of
items shown
|
130,649
|
118,067
|
133,133
|
12.8
|
|
|
All
other products
|
165,581
|
159,688
|
166,842
|
4.5
|
|
|
Total of
all commodities
|
296,230
|
277,756
|
299,975
|
8.0
|
Source:
USITC DataWeb/USDOC (accessed March 14, 2018).
Note:
Data reflect shipments under HTS chapters 1–97. Because of rounding, figures
may not add up to totals shown. N.e.s.o.i. = not elsewhere specified or
included.
Table
A.39
U.S. total exports to Mexico, by USITC
digest sector, 2015–17
|
Sector
|
Description
|
2015
|
2016
|
2017
|
2016–17
|
|
|
|
|
Million $
|
|
% change
|
|
1
|
Agricultural
products
|
18,296
|
18,503
|
19,276
|
4.2
|
|
2
|
Forest products
|
5,858
|
5,754
|
6,066
|
5.4
|
|
3
|
Chemicals
and related products
|
34,113
|
32,932
|
35,126
|
6.7
|
|
4
|
Energy-related products
|
18,944
|
19,577
|
26,585
|
35.8
|
|
5
|
Textiles
and apparel
|
5,996
|
5,442
|
5,554
|
2.0
|
|
6
|
Footwear
|
134
|
97
|
95
|
-1.8
|
|
7
|
Minerals
and metals
|
22,748
|
20,981
|
21,995
|
4.8
|
|
8
|
Machinery
|
23,472
|
23,108
|
24,070
|
4.2
|
|
9
|
Transportation
equipment
|
42,254
|
39,951
|
41,148
|
3.0
|
|
10
|
Electronic products
|
54,174
|
53,554
|
53,051
|
-0.9
|
|
11
|
Miscellaneous
manufactures
|
3,080
|
3,041
|
2,973
|
-2.2
|
|
12
|
Special provisions
|
7,134
|
6,761
|
7,048
|
4.2
|
|
|
Total
|
236,204
|
229,702
|
242,989
|
5.8
|
Source:
USITC DataWeb/USDOC (accessed March 14, 2018).
Note:
Because of rounding, figures may not add up to totals shown.
Table
A.40
U.S. general imports from Mexico, by USITC
digest sector, 2015–17
|
Sector
|
Description
|
2015
|
2016
|
2017
|
2016–17
|
|
|
|
|
Million $
|
|
% change
|
|
1
|
Agricultural
products
|
23,008
|
24,887
|
26,703
|
7.3
|
|
2
|
Forest products
|
1,950
|
1,910
|
1,981
|
3.7
|
|
3
|
Chemicals
and related products
|
10,759
|
10,608
|
11,534
|
8.7
|
|
4
|
Energy-related products
|
13,674
|
8,724
|
11,128
|
27.6
|
|
5
|
Textiles
and apparel
|
5,902
|
5,804
|
6,104
|
5.2
|
|
6
|
Footwear
|
493
|
413
|
427
|
3.5
|
|
7
|
Minerals
and metals
|
18,104
|
18,099
|
19,377
|
7.1
|
|
8
|
Machinery
|
30,098
|
29,918
|
31,408
|
5.0
|
|
9
|
Transportation
equipment
|
104,402
|
105,192
|
114,156
|
8.5
|
|
10
|
Electronic products
|
72,485
|
73,558
|
75,772
|
3.0
|
|
11
|
Miscellaneous
manufactures
|
6,547
|
6,782
|
6,699
|
-1.2
|
|
12
|
Special provisions
|
8,980
|
8,161
|
8,756
|
7.3
|
|
|
Total
|
296,401
|
294,056
|
314,045
|
6.8
|
Source:
USITC DataWeb/USDOC (accessed March 14, 2018).
Note:
Because of rounding, figures may not add up to totals shown.
Table
A.41
Leading U.S. total exports to Mexico, by
HTS 6-digit subheading, 2015–17
|
HTS 6
|
Description
|
2015
|
2016
|
2017
|
2016–17
|
|
|
|
|
Million $
|
|
% change
|
|
2710.12
|
Light
oils and preparations containing 70% by weight petroleum oils or oils from
bituminous minerals, not containing biodiesel, not waste oils
|
9,090
|
9,432
|
11,914
|
26.3
|
|
8473.30
|
Parts and accessories for automatic data processing
machines and units thereof, magnetic or optical readers, transcribing
machines, etc., n.e.s.o.i.
|
10,661
|
10,856
|
10,441
|
-3.8
|
|
2710.19
|
Petroleum
oils, oils from bituminous minerals (other than crude) and products
containing by weight 70% or more of these oils, not biodiesel or waste
|
5,687
|
5,830
|
8,731
|
49.8
|
|
8542.31
|
Processors and controllers, electronic integrated
circuits
|
2,773
|
3,310
|
3,618
|
9.3
|
|
8408.20
|
Compression-ignition
internal combustion piston engines (diesel or semi-diesel), for the
propulsion of vehicles except railway or tramway stock
|
2,666
|
2,507
|
3,582
|
42.9
|
|
8708.29
|
Parts and accessories of bodies (including cabs) for
motor vehicles, n.e.s.o.i.
|
3,238
|
3,119
|
3,279
|
5.1
|
|
8800.00
|
Civilian
aircraft, engines, and parts
|
3,123
|
2,673
|
3,229
|
20.8
|
|
8708.99
|
Parts and accessories for motor vehicles, n.e.s.o.i.
|
4,993
|
3,666
|
3,028
|
-17.4
|
|
8517.62
|
Machines
for the reception, conversion and transmission or regeneration of voice,
images or other data, including switching and routing apparatus
|
3,457
|
3,046
|
2,932
|
-3.7
|
|
8471.70
|
Automatic data processing storage units, n.e.s.o.i.
|
2,306
|
2,810
|
2,882
|
2.6
|
|
8708.40
|
Gear
boxes for motor vehicles
|
2,371
|
2,546
|
2,834
|
11.3
|
|
1005.90
|
Corn (maize), other than seed corn
|
2,325
|
2,575
|
2,666
|
3.5
|
|
8538.90
|
Parts
for electrical apparatus for electrical circuits, boards, panels etc. for
electric control or distribution of electricity, n.e.s.o.i.
|
2,443
|
2,455
|
2,610
|
6.3
|
|
3926.90
|
Articles of plastics, n.e.s.o.i.
|
2,406
|
2,376
|
2,507
|
5.5
|
|
8528.71
|
Reception
apparatus for television, not designed to incorporate a video display or
screen
|
1,588
|
1,788
|
2,015
|
12.7
|
|
|
Total of
items shown
|
59,126
|
58,990
|
66,268
|
12.3
|
|
|
All
other products
|
177,078
|
170,712
|
176,721
|
3.5
|
|
|
Total of
all commodities
|
236,204
|
229,702
|
242,989
|
5.8
|
Source:
USITC DataWeb/USDOC (accessed March 14, 2018).
Note:
Data reflect shipments under HTS chapters 1–97. Because of rounding, figures
may not add up to totals shown. N.e.s.o.i. = not elsewhere specified or
included.
Table
A.42
Leading U.S. general imports from Mexico,
by HTS 6-digit subheading, 2015–17
|
HTS 6
|
Description
|
2015
|
2016
|
2017
|
2016–17
|
|
|
|
|
Million $
|
|
% change
|
|
8703.23
|
Passenger
motor vehicles with spark-ignition internal combustion reciprocating piston
engine, cylinder capacity over 1,500 cc but not over 3,000 cc
|
16,388
|
17,964
|
20,349
|
13.3
|
|
8471.50
|
Digital processing units other than those of 8471.41
and 8471.49, n.e.s.o.i.
|
13,445
|
15,165
|
17,488
|
15.3
|
|
8704.31
|
Motor
vehicles for goods transport n.e.s.o.i., with spark-ignition internal
combustion piston engine, gvw not over 5 metric tons
|
12,816
|
15,400
|
15,378
|
-0.1
|
|
2709.00
|
Petroleum oils and oils from bituminous minerals,
crude
|
12,487
|
7,583
|
9,780
|
29.0
|
|
8517.62
|
Machines
for the reception, conversion and transmission or regeneration of voice,
images or other data, including switching and routing apparatus
|
10,178
|
11,068
|
9,515
|
-14.0
|
|
8528.72
|
Reception apparatus for television, color,
n.e.s.o.i.
|
11,053
|
8,720
|
8,404
|
-3.6
|
|
8544.30
|
Insulated
ignition wiring sets and other wiring sets for vehicles, aircraft and ships
|
7,243
|
7,060
|
6,879
|
-2.6
|
|
9401.90
|
Parts of seats (except parts of medical, dentist,
barber, and similar seats), n.e.s.o.i.
|
6,388
|
6,613
|
6,207
|
-6.1
|
|
8703.22
|
Passenger
motor vehicles with spark-ignition internal combustion reciprocating piston
engine, cylinder capacity over 1,000 cc but not over 1,500 cc
|
2,264
|
3,613
|
5,934
|
64.2
|
|
8701.20
|
Road tractors for semi-trailers
|
7,997
|
4,756
|
5,750
|
20.9
|
|
8708.29
|
Parts
and accessories of bodies (including cabs) for motor vehicles, n.e.s.o.i.
|
4,744
|
4,991
|
4,878
|
-2.3
|
|
8708.99
|
Parts and accessories for motor vehicles, n.e.s.o.i.
|
3,789
|
3,841
|
4,296
|
11.8
|
|
8537.10
|
Boards,
panels, consoles, etc. with electrical apparatus, for electric control or
distribution of electricity, for a voltage not exceeding 1,000 v
|
3,871
|
4,095
|
4,227
|
3.2
|
|
8704.22
|
Motor vehicles for goods transport n.e.s.o.i., with
compression-ignition internal combustion piston engine (diesel), gvw over 5
but not over 20 metric tons
|
3,394
|
3,070
|
3,791
|
23.5
|
|
9018.90
|
Instruments
and appliances for medical, surgical or veterinary sciences, n.e.s.o.i., and
parts and accessories thereof
|
3,159
|
3,408
|
3,450
|
1.2
|
|
|
Total of
items shown
|
119,216
|
117,346
|
126,326
|
7.7
|
|
|
All
other products
|
177,185
|
176,710
|
187,719
|
6.2
|
|
|
Total of
all commodities
|
296,401
|
294,056
|
314,045
|
6.8
|
Source:
USITC DataWeb/USDOC (accessed March 14, 2018).
Note:
Data reflect shipments under HTS chapters 1–97. Because of rounding, figures
may not add up to totals shown. N.e.s.o.i. = not elsewhere specified or
included; gvw = gross vehicle weight.
Table
A.43
U.S. total exports to Japan, by USITC
digest sector, 2015–17
|
Sector
|
Description
|
2015
|
2016
|
2017
|
2016–17
|
|
|
|
|
Million $
|
|
% change
|
|
1
|
Agricultural
products
|
12,421
|
12,107
|
12,953
|
7.0
|
|
2
|
Forest products
|
2,000
|
1,887
|
1,936
|
2.6
|
|
3
|
Chemicals
and related products
|
11,131
|
11,537
|
11,859
|
2.8
|
|
4
|
Energy-related products
|
2,032
|
2,653
|
5,780
|
117.9
|
|
5
|
Textiles
and apparel
|
569
|
522
|
513
|
-1.7
|
|
6
|
Footwear
|
75
|
56
|
50
|
-11.5
|
|
7
|
Minerals
and metals
|
3,587
|
3,414
|
3,654
|
7.0
|
|
8
|
Machinery
|
4,794
|
4,314
|
5,776
|
33.9
|
|
9
|
Transportation
equipment
|
10,409
|
11,119
|
9,698
|
-12.8
|
|
10
|
Electronic products
|
12,380
|
12,303
|
12,189
|
-0.9
|
|
11
|
Miscellaneous
manufactures
|
1,839
|
2,172
|
2,077
|
-4.4
|
|
12
|
Special provisions
|
1,155
|
1,152
|
1,211
|
5.1
|
|
|
Total
|
62,393
|
63,236
|
67,696
|
7.1
|
Source:
USITC DataWeb/USDOC (accessed March 14, 2018).
Note:
Because of rounding, figures may not add up to totals shown.
Table
A.44
U.S. general imports from Japan, by USITC
digest sector, 2015–17
|
Sector
|
Description
|
2015
|
2016
|
2017
|
2016–17
|
|
|
|
|
Million $
|
|
% change
|
|
1
|
Agricultural
products
|
828
|
916
|
919
|
0.3
|
|
2
|
Forest products
|
460
|
446
|
441
|
-1.2
|
|
3
|
Chemicals
and related products
|
11,710
|
11,505
|
11,965
|
4.0
|
|
4
|
Energy-related products
|
656
|
506
|
594
|
17.3
|
|
5
|
Textiles
and apparel
|
767
|
737
|
745
|
1.1
|
|
6
|
Footwear
|
5
|
9
|
3
|
-68.7
|
|
7
|
Minerals
and metals
|
6,743
|
6,234
|
6,348
|
1.8
|
|
8
|
Machinery
|
17,376
|
17,321
|
18,718
|
8.1
|
|
9
|
Transportation
equipment
|
66,104
|
68,642
|
70,615
|
2.9
|
|
10
|
Electronic products
|
21,665
|
21,213
|
21,522
|
1.5
|
|
11
|
Miscellaneous
manufactures
|
1,292
|
1,196
|
1,286
|
7.5
|
|
12
|
Special provisions
|
3,776
|
3,320
|
3,389
|
2.1
|
|
|
Total
|
131,383
|
132,046
|
136,544
|
3.4
|
Source:
USITC DataWeb/USDOC (accessed March 14, 2018).
Note:
Because of rounding, figures may not add up to totals shown.
Table
A.45
Leading U.S. total exports to Japan, by HTS
6-digit subheading, 2015–17
|
HTS 6
|
Description
|
2015
|
2016
|
2017
|
2016–17
|
|
|
|
|
Million $
|
|
% change
|
|
8800.00
|
Civilian
aircraft, engines, and parts
|
6,385
|
6,877
|
5,752
|
-16.4
|
|
2711.12
|
Propane, liquefied
|
624
|
1,335
|
2,814
|
110.8
|
|
1005.90
|
Corn
(maize), other than seed corn
|
2,034
|
2,098
|
2,159
|
2.9
|
|
8486.20
|
Machines and apparatus for the manufacture of
semiconductor devices or of electronic integrates circuits
|
1,204
|
848
|
1,731
|
104.1
|
|
3004.90
|
Medicaments,
in measured doses, etc. (excluding vaccines, etc., coated bandages etc., and
pharmaceutical goods), n.e.s.o.i.
|
1,947
|
2,095
|
1,660
|
-20.8
|
|
9018.90
|
Instruments and appliances for medical, surgical or
veterinary sciences, n.e.s.o.i., and parts and accessories thereof
|
1,169
|
1,211
|
1,234
|
1.9
|
|
2909.19
|
Acyclic
ethers (excluding diethyl ether) and their halogenated, sulfonated, nitrated
or nitrosated derivatives
|
720
|
912
|
1,133
|
24.2
|
|
3002.15
|
Immunological products, put up in measured doses or
in forms or packings for retail sale
|
(
)
|
(
)
|
1,132
|
(
)
|
|
0201.30
|
Meat of
bovine animals, boneless, fresh or chilled
|
601
|
796
|
1,091
|
37.1
|
|
0203.19
|
Meat of swine, n.e.s.o.i., fresh or chilled
|
898
|
968
|
1,002
|
3.5
|
|
1201.90
|
Soybeans,
other than seed
|
1,048
|
1,000
|
976
|
-2.5
|
|
2701.12
|
Bituminous coal, whether or not pulverized, but not
agglomerated
|
334
|
395
|
830
|
110.3
|
|
8517.62
|
Machines
for the reception, conversion and transmission or regeneration of voice,
images or other data, including switching and routing apparatus
|
677
|
692
|
814
|
17.6
|
|
2804.61
|
Silicon, containing by weight not less than 99.99%
of silicon
|
559
|
948
|
812
|
-14.3
|
|
1001.99
|
Wheat
and meslin,
not durum wheat, other
than seed
|
746
|
610
|
724
|
18.7
|
|
|
Total of
items shown
|
18,947
|
20,785
|
23,864
|
14.8
|
|
|
All
other products
|
43,446
|
42,451
|
43,832
|
3.3
|
|
|
Total of
all commodities
|
62,393
|
63,236
|
67,696
|
7.1
|
Source:
USITC DataWeb/USDOC (accessed March 14, 2018).
Note:
Data reflect shipments under HTS chapters 1–97. Because of rounding, figures
may not add up to totals shown. N.e.s.o.i. = not elsewhere specified or
included.
Trade in
2015 and 2016 reported under HTS subheading 3002.10.
Undefined.
Mixture
of wheat and rye flour.
Table
A.46
Leading U.S. total imports from Japan, by
HTS 6-digit subheading, 2015–17
|
HTS 6
|
Description
|
2015
|
2016
|
2017
|
2016–17
|
|
|
|
|
Million $
|
|
% change
|
|
8703.23
|
Passenger
motor vehicles with spark-ignition internal combustion reciprocating piston
engine, cylinder capacity over 1,500 cc but not over 3,000 cc
|
22,457
|
26,339
|
24,302
|
-7.7
|
|
8703.24
|
Passenger motor vehicles with spark-ignition
internal combustion reciprocating piston engine, cylinder capacity over 3,000
cc
|
11,912
|
10,555
|
10,800
|
2.3
|
|
8803.30
|
Parts
of airplanes or helicopters, n.e.s.o.i.
|
4,737
|
4,470
|
3,983
|
-10.9
|
|
8708.40
|
Gear boxes for motor vehicles
|
2,294
|
2,688
|
3,342
|
24.4
|
|
8703.40
|
Passenger
motor vehicles, with both spark-ignition combust and electric motor, other
than those charges by plug in to external electric power
|
(
)
|
(
)
|
3,151
|
(
)
|
|
8443.99
|
Parts and accessories of printers, copying machines
and facsimile machines, n.e.s.o.i.
|
2,874
|
2,597
|
2,556
|
-1.6
|
|
8429.52
|
Mechanical
shovels, excavators and shovel loaders with 360° revolving superstructure,
self-propelled
|
2,032
|
1,942
|
2,003
|
3.2
|
|
8411.91
|
Parts of turbojets or turbopropellers
|
1,912
|
1,815
|
1,927
|
6.2
|
|
8708.99
|
Parts
and accessories for motor vehicles, n.e.s.o.i.
|
2,171
|
2,090
|
1,896
|
-9.3
|
|
8409.91
|
Parts for use with spark-ignition internal
combustion piston engines (including rotary engines), n.e.s.o.i.
|
1,222
|
1,287
|
1,384
|
7.6
|
|
3004.90
|
Medicaments,
in measured doses, etc. (excluding vaccines, etc., coated bandages etc., and
pharmaceutical goods), n.e.s.o.i.
|
926
|
1,391
|
1,356
|
-2.5
|
|
8486.20
|
Machines and apparatus for the manufacture of
semiconductor devices or of electronic integrates circuits
|
899
|
1,198
|
1,258
|
5.0
|
|
8507.90
|
Parts
of electric storage batteries, including separators therefor
|
444
|
549
|
1,212
|
120.9
|
|
8486.90
|
Machines and apparatus of a kind used for the
manufacture of semiconductor boules or wafers, etc., parts and accessories
|
838
|
886
|
1,177
|
32.8
|
|
8479.89
|
Machines
and mechanical appliances having individual functions, n.e.s.o.i.
|
509
|
743
|
993
|
33.7
|
|
|
Total of
items shown
|
55,226
|
58,549
|
61,341
|
4.8
|
|
|
All
other products
|
76,157
|
73,497
|
75,203
|
2.3
|
|
|
Total of
all commodities
|
131,383
|
132,046
|
136,544
|
3.4
|
Source:
USITC DataWeb/USDOC (accessed March 14, 2018).
Note:
Data reflect shipments under HTS chapters 1–97. Because of rounding, figures
may not add up to totals shown. N.e.s.o.i. = not elsewhere specified or included.
Trade in
2015 and 2016 reported under HTS statistical reporting numbers 8703.23.0022,
8703.23.0024, 8703.23.0026, 8703.23.0028, 8703.23.0032, 8703.23.0034,
8703.23.0036, 8703.23.0038, 8703.23.0042, 8703.23.0044, 8703.23.0046,
8703.23.0048, 8703.23.0052, 8703.23.0062, 8703.23.0064, 8703.23.0066,
8703.23.0068, 8703.23.0072, 8703.23.0074,8703.23.0076, 8703.23.0090,
8703.24.0010, 8703.24.0030, 8703.24.0032, 8703.24.0034, 8703.24.0036,
8703.24.0038, 8703.24.0042, 8703.24.0052, 8703.24.0054, 8703.24.0056, 8703.24.0058,
8703.24.0062, 8703.24.0064, 8703.24.0066, 8703.24.0068, 8703.24.0090.
Undefined.
Table
A.47
U.S. total exports to South Korea, by USITC
digest sector, 2015–17
|
Sector
|
Description
|
2015
|
2016
|
2017
|
2016–17
|
|
|
|
|
Million $
|
|
% change
|
|
1
|
Agricultural
products
|
6,747
|
6,842
|
7,473
|
9.2
|
|
2
|
Forest products
|
826
|
791
|
788
|
-0.4
|
|
3
|
Chemicals
and related products
|
6,905
|
6,532
|
7,155
|
9.5
|
|
4
|
Energy-related products
|
1,392
|
1,733
|
4,211
|
142.9
|
|
5
|
Textiles
and apparel
|
380
|
316
|
310
|
-2.0
|
|
6
|
Footwear
|
74
|
53
|
45
|
-14.5
|
|
7
|
Minerals
and metals
|
3,214
|
2,556
|
2,603
|
1.9
|
|
8
|
Machinery
|
6,231
|
5,622
|
8,700
|
54.8
|
|
9
|
Transportation
equipment
|
7,847
|
8,584
|
6,308
|
-26.5
|
|
10
|
Electronic products
|
8,388
|
7,653
|
9,110
|
19.0
|
|
11
|
Miscellaneous
manufactures
|
823
|
989
|
863
|
-12.8
|
|
12
|
Special provisions
|
656
|
638
|
711
|
11.5
|
|
|
Total
|
43,484
|
42,309
|
48,277
|
14.1
|
Source:
USITC DataWeb/USDOC (accessed March 14, 2018).
Note:
Because of rounding, figures may not add up to totals shown.
Table
A.48
U.S general imports from South Korea, by
USITC digest sector, 2015–17
|
Sector
|
Description
|
2015
|
2016
|
2017
|
2016–17
|
|
|
|
|
Million $
|
|
% change
|
|
1
|
Agricultural
products
|
739
|
810
|
844
|
4.2
|
|
2
|
Forest products
|
578
|
544
|
537
|
-1.2
|
|
3
|
Chemicals
and related products
|
6,225
|
8,511
|
7,544
|
-11.4
|
|
4
|
Energy-related products
|
2,922
|
2,266
|
2,874
|
26.9
|
|
5
|
Textiles
and apparel
|
1,326
|
1,271
|
1,234
|
-2.9
|
|
6
|
Footwear
|
22
|
27
|
45
|
63.7
|
|
7
|
Minerals
and metals
|
6,908
|
5,309
|
5,819
|
9.6
|
|
8
|
Machinery
|
7,579
|
7,068
|
7,895
|
11.7
|
|
9
|
Transportation
equipment
|
27,015
|
25,314
|
25,304
|
0.0
|
|
10
|
Electronic products
|
16,167
|
16,550
|
16,813
|
1.6
|
|
11
|
Miscellaneous
manufactures
|
895
|
968
|
888
|
-8.2
|
|
12
|
Special provisions
|
1,380
|
1,243
|
1,366
|
9.9
|
|
|
Total
imports
|
71,758
|
69,881
|
71,164
|
1.8
|
Source:
USITC DataWeb/USDOC (accessed March 14, 2018).
Note:
Because of rounding, figures may not add up to totals shown.
Table
A.49
Leading U.S. total exports to South Korea,
by HTS 6-digit subheading, 2015–17
|
HTS 6
|
Description
|
2015
|
2016
|
2017
|
2016–17
|
|
|
|
|
Million $
|
|
% change
|
|
8486.20
|
Machines
and apparatus for the manufacture of semiconductor devices or of electronic
integrates circuits
|
1,928
|
1,911
|
4,731
|
147.5
|
|
8800.00
|
Civilian aircraft, engines, and parts
|
3,946
|
3,505
|
2,863
|
-18.3
|
|
8542.31
|
Processors
and controllers, electronic integrated circuits
|
2,750
|
2,094
|
2,513
|
20.0
|
|
2709.00
|
Petroleum oils and oils from bituminous minerals,
crude
|
58
|
181
|
1,122
|
520.8
|
|
2711.12
|
Propane,
liquefied
|
227
|
556
|
947
|
70.3
|
|
8517.12
|
Telephones for cellular networks or for other
wireless networks
|
4
|
147
|
946
|
542.7
|
|
8486.90
|
Machines
and apparatus of a kind used for the manufacture of semiconductor boules or
wafers, etc., parts and accessories
|
578
|
663
|
838
|
26.4
|
|
1005.90
|
Corn (maize), other than seed corn
|
655
|
870
|
711
|
-18.2
|
|
8703.23
|
Passenger
motor vehicles with spark-ignition internal combustion reciprocating piston
engine, cylinder capacity over 1,500 cc but not over 3,000 cc
|
602
|
741
|
686
|
-7.5
|
|
2701.12
|
Bituminous coal, whether or not pulverized, but not agglomerated
|
238
|
287
|
600
|
108.9
|
|
2711.11
|
Natural
gas, liquefied
|
38
|
22
|
596
|
2,596.5
|
|
0202.20
|
Meat of bovine animals, cuts with bone in (other
than half or whole carcasses), frozen
|
291
|
368
|
408
|
10.7
|
|
0203.29
|
Meat of
swine, n.e.s.o.i., frozen
|
390
|
298
|
403
|
35.3
|
|
0201.30
|
Meat of bovine animals, boneless, fresh or chilled
|
133
|
200
|
371
|
84.9
|
|
8542.39
|
Electronic
integrated circuits, n.e.s.o.i.
|
313
|
356
|
339
|
-5.0
|
|
|
Total of
items shown
|
12,150
|
12,199
|
18,072
|
48.1
|
|
|
All
other products
|
31,334
|
30,110
|
30,204
|
0.3
|
|
|
Total of
all commodities
|
43,484
|
42,309
|
48,277
|
14.1
|
Source:
USITC DataWeb/USDOC (accessed March 14, 2018).
Note:
Data reflect shipments under HTS chapters 1–97. Because of rounding, figures
may not add up to totals shown. N.e.s.o.i. = not elsewhere specified or included.
Table
A.50
Leading U.S. general imports from South
Korea, by HTS 6-digit subheading, 2015–17
|
HTS 6
|
Description
|
2015
|
2016
|
2017
|
2016–17
|
|
|
|
|
Million $
|
|
% change
|
|
8703.23
|
Passenger
motor vehicles with spark-ignition internal combustion reciprocating piston
engine, cylinder capacity over 1,500 cc but not over 3,000 cc
|
11,552
|
10,808
|
8,547
|
-20.9
|
|
8517.12
|
Telephones for cellular networks or for other
wireless networks
|
6,394
|
6,287
|
5,557
|
-11.6
|
|
8703.24
|
Passenger
motor vehicles with spark-ignition internal combustion reciprocating piston
engine, cylinder capacity over 3,000 cc
|
3,517
|
2,647
|
3,714
|
40.3
|
|
8473.30
|
Parts and accessories for automatic data processing
machines and units thereof, magnetic or optical readers, transcribing
machines, etc., n.e.s.o.i.
|
1,846
|
1,325
|
2,661
|
100.9
|
|
2710.19
|
Petroleum
oils, oils from bituminous minerals (other than crude) and products
containing by weight 70% or more of these oils, not biodiesel or waste
|
2,606
|
2,073
|
2,581
|
24.5
|
|
8703.22
|
Passenger motor vehicles with spark-ignition
internal combustion reciprocating piston engine, cylinder capacity over 1,000
cc but not over 1,500 cc
|
2,077
|
2,443
|
2,032
|
-16.8
|
|
8542.39
|
Electronic
integrated circuits, n.e.s.o.i.
|
1,305
|
1,278
|
1,383
|
8.2
|
|
8708.99
|
Parts and accessories for motor vehicles, n.e.s.o.i.
|
1,296
|
1,302
|
1,166
|
-10.4
|
|
8541.40
|
Photosensitive
semiconductor devices, including photovoltaic cells; light-emitting diodes
|
641
|
1,355
|
1,107
|
-18.3
|
|
8418.10
|
Combined refrigerator-freezers fitted with separate
external doors
|
1,031
|
1,045
|
1,012
|
-3.2
|
|
8523.51
|
Solid-state
nonvolatile semiconductor storage devices
|
692
|
1,034
|
978
|
-5.4
|
|
4011.10
|
New pneumatic tires, of rubber, of a kind used on
motor cars (including station wagons and racing cars)
|
1,109
|
1,068
|
952
|
-10.9
|
|
8703.40
|
Passenger
motor vehicles, with both spark-ignition combust and electric motor, other
than those charges by plugging to external electric power
|
(
)
|
(
)
|
921
|
(
)
|
|
8708.29
|
Parts and accessories of bodies (including cabs) for
motor vehicles, n.e.s.o.i.
|
898
|
937
|
809
|
-13.6
|
|
7306.29
|
Casing
or tubing for oil or gas drilling, of iron or steel, n.e.s.o.i.
|
502
|
183
|
717
|
292.6
|
|
|
Total of
items shown
|
35,466
|
33,784
|
34,137
|
1.0
|
|
|
All
other products
|
36,292
|
36,098
|
37,027
|
2.6
|
|
|
Total all
commodities
|
71,758
|
69,881
|
71,164
|
1.8
|
Source:
USITC DataWeb/USDOC (accessed March 14, 2018).
Note:
Data reflect shipments under HTS chapters 1–97. Because of rounding, figures
may not add up to totals shown. N.e.s.o.i. = not elsewhere specified or included.
Trade in
2015 and 2016 reported under HTS statistical reporting numbers 8703.23.0022,
8703.23.0024, 8703.23.0026, 8703.23.0028, 8703.23.0032, 8703.23.0034,
8703.23.0036, 8703.23.0038, 8703.23.0042, 8703.23.0044, 8703.23.0046,
8703.23.0048, 8703.23.0052, 8703.23.0062, 8703.23.0064, 8703.23.0066,
8703.23.0068, 8703.23.0072, 8703.23.0074,8703.23.0076, 8703.23.0090,
8703.24.0010, 8703.24.0030, 8703.24.0032, 8703.24.0034, 8703.24.0036,
8703.24.0038, 8703.24.0042, 8703.24.0052, 8703.24.0054, 8703.24.0056,
8703.24.0058, 8703.24.0062, 8703.24.0064, 8703.24.0066, 8703.24.0068,
8703.24.0090.
Undefined.
Trade in
2015 and 2016 reported under HTS subheading 3002.10.
Table
A.51
U.S. total exports to India, by USITC
digest sector, 2015–17
|
Sector
|
Description
|
2015
|
2016
|
2017
|
2016–17
|
|
|
|
|
Million $
|
|
% change
|
|
1
|
Agricultural
products
|
1,271
|
1,450
|
1,895
|
30.7
|
|
2
|
Forest products
|
713
|
693
|
817
|
17.8
|
|
3
|
Chemicals
and related products
|
3,304
|
3,361
|
3,370
|
0.3
|
|
4
|
Energy-related products
|
1,157
|
1,261
|
3,134
|
148.4
|
|
5
|
Textiles
and apparel
|
183
|
206
|
172
|
-16.4
|
|
6
|
Footwear
|
3
|
2
|
2
|
43.1
|
|
7
|
Minerals
and metals
|
7,610
|
7,838
|
7,896
|
0.7
|
|
8
|
Machinery
|
1,496
|
1,278
|
1,308
|
2.3
|
|
9
|
Transportation
equipment
|
2,152
|
1,994
|
3,200
|
60.5
|
|
10
|
Electronic products
|
2,767
|
2,641
|
2,946
|
11.5
|
|
11
|
Miscellaneous
manufactures
|
414
|
555
|
484
|
-12.7
|
|
12
|
Special provisions
|
382
|
374
|
476
|
27.2
|
|
|
Total
|
21,453
|
21,652
|
25,700
|
18.7
|
Source:
USITC DataWeb/USDOC (accessed March 14, 2018).
Note:
Because of rounding, figures may not add up to totals shown.
Table
A.52
U.S. general imports from India, by USITC
digest sector, 2015–17
|
Sector
|
Description
|
2015
|
2016
|
2017
|
2016–17
|
|
|
|
|
Million $
|
|
% change
|
|
1
|
Agricultural
products
|
3,847
|
3,512
|
4,651
|
32.4
|
|
2
|
Forest products
|
223
|
251
|
282
|
12.3
|
|
3
|
Chemicals
and related products
|
9,714
|
11,168
|
10,385
|
-7.0
|
|
4
|
Energy-related products
|
2,672
|
2,402
|
2,669
|
11.1
|
|
5
|
Textiles
and apparel
|
7,951
|
7,949
|
8,200
|
3.2
|
|
6
|
Footwear
|
468
|
503
|
448
|
-10.9
|
|
7
|
Minerals
and metals
|
10,858
|
11,430
|
12,149
|
6.3
|
|
8
|
Machinery
|
2,421
|
2,065
|
2,391
|
15.8
|
|
9
|
Transportation
equipment
|
2,032
|
1,875
|
2,283
|
21.8
|
|
10
|
Electronic products
|
1,165
|
1,207
|
1,249
|
3.5
|
|
11
|
Miscellaneous
manufactures
|
2,828
|
3,039
|
3,103
|
2.1
|
|
12
|
Special provisions
|
610
|
631
|
819
|
29.7
|
|
|
Total
|
44,790
|
46,032
|
48,631
|
5.6
|
Source:
USITC DataWeb/USDOC (accessed March 14, 2018).
Note:
Because of rounding, figures may not add up to totals shown.
Table
A.53
Leading U.S. total exports to India, by HTS
6-digit subheading, 2015–17
|
HTS 6
|
Description
|
2015
|
2016
|
2017
|
2016–17
|
|
|
|
|
Million $
|
|
% change
|
|
7102.39
|
Diamonds,
nonindustrial, worked, including polished or drilled
|
3,745
|
4,802
|
4,109
|
-14.4
|
|
7108.12
|
Gold, nonmonetary, unwrought n.e.s.o.i. (other than
powder)
|
2,294
|
1,726
|
2,376
|
37.7
|
|
8800.00
|
Civilian
aircraft, engines, and parts
|
773
|
965
|
1,511
|
56.6
|
|
2701.12
|
Bituminous coal, whether or not pulverized, but not
agglomerated
|
455
|
324
|
1,069
|
229.8
|
|
0802.11
|
Almonds,
fresh or dried, in shell
|
446
|
446
|
584
|
30.8
|
|
8802.40
|
Airplanes and other aircraft n.e.s.o.i., of an
unladen weight exceeding 15,000 kg
|
352
|
0
|
518
|
(
)
|
|
2713.11
|
Petroleum
coke, not calcined
|
273
|
368
|
461
|
25.3
|
|
5201.00
|
Cotton, not carded or combed
|
115
|
251
|
433
|
72.9
|
|
2709.00
|
Petroleum
oils and oils from bituminous minerals, crude
|
17
|
0
|
422
|
(
)
|
|
2707.99
|
Oils and products of the distillation of high
temperature coal tar, n.e.s.o.i.; similar products which have a predominate
(wt.) aromatic constituent, n.e.s.o.i.
|
208
|
206
|
320
|
55.4
|
|
8517.62
|
Machines
for the reception, conversion and transmission or regeneration of voice,
images or other data, including switching and routing apparatus
|
371
|
287
|
316
|
9.8
|
|
7113.19
|
Jewelry and parts thereof, of precious metal other
than silver
|
250
|
286
|
274
|
-4.3
|
|
2901.10
|
Acyclic
hydrocarbons, saturated
|
0
|
10
|
235
|
2,292.9
|
|
2207.10
|
Ethyl alcohol, undenatured, of an alcoholic strength
by volume of 80% or higher
|
73
|
176
|
213
|
21.1
|
|
4707.10
|
Waste
and scrap of unbleached kraft paper or paperboard or of corrugated paper or
paperboard
|
134
|
152
|
209
|
37.0
|
|
|
Total of
items shown
|
9,505
|
9,999
|
13,048
|
30.5
|
|
|
All
other products
|
11,948
|
11,654
|
12,652
|
8.6
|
|
|
Total of all
commodities
|
21,453
|
21,652
|
25,700
|
18.7
|
Source:
USITC DataWeb/USDOC (accessed March 14, 2018).
Note:
Data reflect shipments under HTS chapters 1–97. Because of rounding, figures
may not add up to totals shown. N.e.s.o.i. = not elsewhere specified or included.
Undefined.
Table
A.54
Leading U.S. general imports from India, by
HTS 6-digit subheading, 2015–17
|
HTS 6
|
Description
|
2015
|
2016
|
2017
|
2016–17
|
|
|
|
|
Million $
|
|
% change
|
|
7102.39
|
Diamonds,
nonindustrial, worked, including polished or drilled
|
7,370
|
8,620
|
8,193
|
-5.0
|
|
3004.90
|
Medicaments, in measured doses, etc. (excluding
vaccines, etc., coated bandages etc., and pharmaceutical goods), n.e.s.o.i.
|
4,915
|
6,398
|
5,130
|
-19.8
|
|
0306.17
|
Shrimps
and prawns, frozen, other than cold-water
|
1,188
|
1,394
|
1,972
|
41.5
|
|
2710.12
|
Light oils and preparations containing 70% by weight
petroleum oils or oils from bituminous minerals, not containing biodiesel,
not waste oils
|
1,646
|
1,501
|
1,546
|
3.0
|
|
7113.19
|
Jewelry
and parts thereof, of precious metal other than silver
|
1,310
|
1,508
|
1,433
|
-4.9
|
|
2710.19
|
Petroleum oils, oils from bituminous minerals (other
than crude) and products containing by weight 70% or more of these oils, not
biodiesel or waste
|
994
|
885
|
963
|
8.8
|
|
6302.31
|
Bed
linen (other than printed) of cotton, not knitted or crocheted
|
791
|
789
|
829
|
5.1
|
|
6302.60
|
Toilet and kitchen linen of cotton terry toweling or
similar cotton terry fabrics
|
694
|
699
|
729
|
4.4
|
|
6110.20
|
Sweaters,
pullovers, sweatshirts, vests and similar articles of cotton, knitted or
crocheted
|
414
|
406
|
428
|
5.6
|
|
3004.20
|
Medicaments, in measured doses, etc., containing
antibiotics, n.e.s.o.i.
|
484
|
420
|
384
|
-8.4
|
|
7113.11
|
Jewelry
and parts thereof, of silver
|
345
|
320
|
343
|
7.0
|
|
1302.32
|
Mucilages and thickeners, whether or not modified,
derived from locust beans, locust bean seeds or guar seeds
|
583
|
178
|
335
|
88.0
|
|
7305.11
|
Line
pipe for oil or gas pipelines, external diameter over 406.4 mm (16 in.), of
iron or steel, longitudinally submerged arc welded
|
34
|
18
|
258
|
1,317.9
|
|
6205.20
|
Men's or boys' shirts of cotton, not knitted or
crocheted
|
239
|
236
|
250
|
5.6
|
|
2934.99
|
Nucleic
acids and their salts, whether or not chemically defined; other heterocyclic
compounds, n.e.s.o.i.
|
171
|
217
|
245
|
12.6
|
|
|
Total of
items shown
|
21,177
|
23,589
|
23,039
|
-2.3
|
|
|
All
other products
|
23,613
|
22,443
|
25,592
|
14.0
|
|
|
Total of
all commodities
|
44,790
|
46,032
|
48,631
|
5.6
|
Source:
USITC DataWeb/USDOC (accessed March 14, 2018).
Note:
Data reflect shipments under HTS chapters 1–97. Because of rounding, figures
may not add up to totals shown. N.e.s.o.i. = not elsewhere specified or
included.
Table
A.55
U.S. total exports to Taiwan, by USITC
digest sector, 2015–17
|
Sector
|
Description
|
2015
|
2016
|
2017
|
2016–17
|
|
|
|
|
Million $
|
|
% change
|
|
1
|
Agricultural
products
|
3,279
|
3,319
|
3,400
|
2.5
|
|
2
|
Forest products
|
426
|
424
|
417
|
-1.7
|
|
3
|
Chemicals
and related products
|
3,642
|
3,556
|
3,723
|
4.7
|
|
4
|
Energy-related products
|
268
|
135
|
763
|
465.6
|
|
5
|
Textiles
and apparel
|
103
|
101
|
118
|
16.5
|
|
6
|
Footwear
|
10
|
8
|
9
|
10.8
|
|
7
|
Minerals
and metals
|
1,288
|
1,270
|
1,367
|
7.6
|
|
8
|
Machinery
|
5,101
|
5,531
|
5,061
|
-8.5
|
|
9
|
Transportation
equipment
|
3,501
|
3,744
|
3,651
|
-2.5
|
|
10
|
Electronic products
|
5,962
|
6,605
|
6,355
|
-3.8
|
|
11
|
Miscellaneous
manufactures
|
1,821
|
866
|
363
|
-58.1
|
|
12
|
Special provisions
|
422
|
478
|
528
|
10.6
|
|
|
Total
|
25,823
|
26,037
|
25,754
|
-1.1
|
Source:
USITC DataWeb/USDOC (accessed March 14, 2018).
Note:
Because of rounding, figures may not add up to totals shown.
Table
A.56
U.S. general imports from Taiwan, by USITC
digest sector, 2015–17
|
Sector
|
Description
|
2015
|
2016
|
2017
|
2016–17
|
|
|
|
|
Million $
|
|
% change
|
|
1
|
Agricultural
products
|
516
|
531
|
587
|
10.5
|
|
2
|
Forest products
|
242
|
243
|
262
|
7.8
|
|
3
|
Chemicals
and related products
|
3,673
|
3,547
|
4,016
|
13.2
|
|
4
|
Energy-related products
|
237
|
96
|
143
|
49.1
|
|
5
|
Textiles
and apparel
|
1,188
|
1,037
|
1,005
|
-3.1
|
|
6
|
Footwear
|
87
|
85
|
55
|
-35.4
|
|
7
|
Minerals
and metals
|
5,820
|
5,131
|
5,862
|
14.2
|
|
8
|
Machinery
|
4,442
|
4,124
|
4,617
|
11.9
|
|
9
|
Transportation
equipment
|
3,589
|
3,393
|
3,556
|
4.8
|
|
10
|
Electronic products
|
16,327
|
16,442
|
17,635
|
7.3
|
|
11
|
Miscellaneous
manufactures
|
3,252
|
3,057
|
3,147
|
3.0
|
|
12
|
Special provisions
|
1,532
|
1,563
|
1,608
|
2.9
|
|
|
Total
|
40,905
|
39,248
|
42,492
|
8.3
|
Source:
USITC DataWeb/USDOC (accessed March 14, 2018).
Note:
Because of rounding, figures may not add up to totals shown.
Table
A.57
Leading U.S. total exports to Taiwan, by
HTS 6-digit subheading, 2015–17
|
HTS 6
|
Description
|
2015
|
2016
|
2017
|
2016–17
|
|
|
|
|
Million $
|
|
% change
|
|
8800.00
|
Civilian
aircraft, engines, and parts
|
2,552
|
2,937
|
2,510
|
-14.5
|
|
8486.20
|
Machines and apparatus for the manufacture of
semiconductor devices or of electronic integrates circuits
|
2,500
|
2,747
|
2,432
|
-11.5
|
|
8542.31
|
Processors
and controllers, electronic integrated circuits
|
843
|
1,557
|
1,133
|
-27.2
|
|
8542.32
|
Memories, electronic integrated circuits
|
1,251
|
1,047
|
1,078
|
2.9
|
|
8486.90
|
Machines
and apparatus of a kind used for the manufacture of semiconductor boules or
wafers, etc., parts and accessories
|
611
|
621
|
816
|
31.4
|
|
8542.39
|
Electronic integrated circuits, n.e.s.o.i.
|
594
|
658
|
711
|
8.2
|
|
1201.90
|
Soybeans,
other than seed
|
578
|
581
|
588
|
1.3
|
|
1005.90
|
Corn (maize), other than seed corn
|
345
|
460
|
397
|
-13.6
|
|
7204.49
|
Ferrous
waste and scrap, n.e.s.o.i.
|
325
|
281
|
352
|
25.2
|
|
2710.12
|
Light oils and preparations containing 70% by weight
petroleum oils or oils from bituminous minerals, not containing biodiesel,
not waste oils
|
97
|
33
|
317
|
867.1
|
|
2709.00
|
Petroleum
oils and oils from bituminous minerals, crude
|
0
|
0
|
302
|
(
)
|
|
1001.99
|
Wheat and meslin, not durum wheat, other than seed
|
283
|
257
|
296
|
15.1
|
|
8541.40
|
Photosensitive
semiconductor devices, including photovoltaic cells; light-emitting diodes
|
270
|
264
|
285
|
7.8
|
|
2804.61
|
Silicon, containing by weight not less than 99.99%
of silicon
|
154
|
254
|
255
|
0.6
|
|
0201.30
|
Meat of
bovine animals, boneless, fresh or chilled
|
166
|
186
|
218
|
17.5
|
|
|
Total of
items shown
|
10,568
|
11,882
|
11,690
|
-1.6
|
|
|
All
other products
|
15,256
|
14,155
|
14,064
|
-0.6
|
|
|
Total of
all commodities
|
25,823
|
26,037
|
25,754
|
-1.1
|
Source:
USITC DataWeb/USDOC (accessed March 14, 2018).
Note:
Data reflect shipments under HTS chapters 1–97. Because of rounding, figures
may not add up to totals shown. N.e.s.o.i. = not elsewhere specified or
included.
Undefined.
Table
A.58
Leading U.S. general imports from Taiwan, by
HTS 6-digit subheading, 2015–17
|
HTS 6
|
Description
|
2015
|
2016
|
2017
|
2016–17
|
|
|
|
|
Million $
|
|
% change
|
|
8542.39
|
Electronic
integrated circuits, n.e.s.o.i.
|
1,390
|
1,461
|
1,646
|
12.7
|
|
8517.62
|
Machines for the reception, conversion and
transmission or regeneration of voice, images or other data, including
switching and routing apparatus
|
1,113
|
1,455
|
1,582
|
8.8
|
|
8542.31
|
Processors
and controllers, electronic integrated circuits
|
1,001
|
1,206
|
1,418
|
17.6
|
|
8473.30
|
Parts and accessories for automatic data processing
machines and units thereof, magnetic or optical readers, transcribing
machines, etc., n.e.s.o.i.
|
1,196
|
1,248
|
1,388
|
11.2
|
|
8471.30
|
Portable
digital automatic data processing machines, weight not more than 10 kg,
consisting of at least a central processing unit, keyboard & a display
|
334
|
679
|
1,262
|
85.8
|
|
8523.51
|
Solid-state nonvolatile semiconductor storage
devices
|
981
|
1,127
|
1,222
|
8.5
|
|
8517.12
|
Telephones
for cellular networks or for other wireless networks
|
1,143
|
754
|
732
|
-2.9
|
|
8542.32
|
Memories, electronic integrated circuits
|
1,221
|
689
|
723
|
4.9
|
|
8512.20
|
Electrical
lighting or visual signaling equipment, for use on cycles or motor vehicles,
except for use on bicycles
|
616
|
587
|
633
|
8.0
|
|
7318.14
|
Self-tapping screws, threaded, of iron or steel
|
545
|
504
|
583
|
15.5
|
|
8525.80
|
Television
cameras, digital cameras and video camera recorders
|
563
|
608
|
523
|
-14.1
|
|
7318.15
|
Threaded screws and bolts n.e.s.o.i., with or
without their nuts or washers, of iron or steel
|
531
|
445
|
498
|
12.0
|
|
8708.29
|
Parts
and accessories of bodies (including cabs) for motor vehicles, n.e.s.o.i.
|
461
|
462
|
476
|
3.1
|
|
9506.91
|
Articles and equipment for general physical
exercise, gymnastics or athletics, n.e.s.o.i.; parts and accessories thereof
|
366
|
390
|
457
|
17.2
|
|
8471.50
|
Digital
processing units other than those of 8471.41 and 8471.49, n.e.s.o.i.
|
234
|
210
|
451
|
114.3
|
|
|
Total of
items shown
|
11,696
|
11,826
|
13,594
|
15.0
|
|
|
All
other products
|
29,209
|
27,422
|
28,897
|
5.4
|
|
|
Total of
all commodities
|
40,905
|
39,248
|
42,492
|
8.3
|
Source:
USITC DataWeb/USDOC (accessed March 14, 2018).
Note:
Data reflect shipments under HTS chapters 1–97. Because of rounding, figures
may not add up to totals shown. N.e.s.o.i. = not elsewhere specified or
included.
Appendix B
Additional Tables Corresponding to Figures in the
Report
Table
B.1
U.S. trade balance
in goods and services, 2003–17 (million dollars)
|
Year
|
Services
|
Goods
|
|
2003
|
47,753
|
-541,643
|
|
2004
|
54,883
|
-664,765
|
|
2005
|
68,558
|
-782,804
|
|
2006
|
75,573
|
-837,289
|
|
2007
|
115,821
|
-821,196
|
|
2008
|
123,765
|
-832,492
|
|
2009
|
125,921
|
-509,694
|
|
2010
|
154,020
|
-648,677
|
|
2011
|
192,020
|
-740,646
|
|
2012
|
204,398
|
-741,171
|
|
2013
|
240,368
|
-702,245
|
|
2014
|
261,158
|
-751,494
|
|
2015
|
261,410
|
-761,855
|
|
2016
|
247,714
|
-752,507
|
|
2017
|
242,771
|
-811,212
|
Source:
USDOC, BEA, U.S. International Transactions, Services, & IIP, “
Table 1.2: U.S.
International Transactions, Expanded Detail
,” March 21, 2018.
Note:
Corresponds to figure
ES.1
.
Merchandise trade data are on a balance-of-payments basis.
Table
B.2
U.S. goods and services trade with major
bilateral trade partners, 2017 (million dollars)
|
Country/region
|
|
Goods
|
|
|
Services
|
|
|
|
Exports
|
Imports
|
Total
|
Exports
|
Imports
|
Total
|
|
European
Union
|
283,517
|
434,933
|
718,451
|
238,425
|
188,496
|
426,921
|
|
China
|
130,370
|
505,597
|
635,967
|
55,585
|
17,421
|
73,006
|
|
Canada
|
282,472
|
299,975
|
582,447
|
58,307
|
32,515
|
90,822
|
|
Mexico
|
242,989
|
314,045
|
557,034
|
32,795
|
26,150
|
58,945
|
|
Japan
|
67,696
|
136,544
|
204,239
|
45,421
|
28,353
|
73,774
|
|
South Korea
|
48,277
|
71,164
|
119,441
|
22,835
|
9,424
|
32,259
|
|
India
|
25,700
|
48,631
|
74,332
|
22,763
|
28,562
|
51,325
|
|
Taiwan
|
25,754
|
42,492
|
68,246
|
9,195
|
8,053
|
17,248
|
Source:
USITC DataWeb/USDOC (accessed April 26, 2018); USDOC, BEA, Interactive data,
International Transactions, Services, & IIP, International Transactions,
Tables 1.2 and 1.3, March 21, 2018.
Note:
Corresponds to figure
ES.2
.
Table
B.3
U.S. real gross domestic product, percentage
change, 2013–17
|
Year
|
Real GDP % change
|
|
2013
|
1.7
|
|
2014
|
2.6
|
|
2015
|
2.9
|
|
2016
|
1.5
|
|
2017
|
2.3
|
Source:
USDOC, BEA, “
Real Gross Domestic
Product
,” March 26, 2018.
Note:
Corresponds to figure
1.1
.
Table
B.4
Economic (GDP) growth trends in the world,
the United States, and major trading partners 2015–17 (percent)
|
Countries
|
2015
|
2016
|
2017
|
|
World
|
2.66
|
2.52
|
3.34
|
|
United
States
|
2.86
|
1.49
|
2.18
|
|
European Union
|
2.35
|
1.98
|
2.34
|
|
China
|
6.90
|
6.70
|
6.77
|
|
Canada
|
0.94
|
1.47
|
3.04
|
|
Mexico
|
2.65
|
2.29
|
2.15
|
|
Japan
|
1.11
|
1.03
|
1.51
|
|
South
Korea
|
2.79
|
2.83
|
3.02
|
|
India
|
8.01
|
7.11
|
6.72
|
|
Taiwan
|
0.72
|
1.48
|
1.98
|
Source:
IMF,
World
Economic Outlook
, October 2017, 3.
Note:
Based on constant prices. Corresponds to figure
1.2
.
Table
B.5
U.S. merchandise trade with major trading
partners and the world, 2013–17
|
Country/region
|
Trade flow
|
2013
|
2014
|
2015
|
2016
|
2017
|
|
|
|
|
|
Billion $
|
|
|
|
European
Union
|
|
|
|
|
|
|
|
|
Total exports
|
262.1
|
276.3
|
271.9
|
269.6
|
283.5
|
|
|
General
imports
|
387.5
|
420.6
|
427.5
|
416.4
|
434.9
|
|
|
Merchandise trade balance
|
-125.4
|
-144.3
|
-155.7
|
-146.8
|
-151.4
|
|
China
|
|
|
|
|
|
|
|
|
Total exports
|
121.7
|
123.7
|
115.9
|
115.6
|
130.4
|
|
|
General
imports
|
440.4
|
468.5
|
483.2
|
462.6
|
505.6
|
|
|
Merchandise trade balance
|
-318.7
|
-344.8
|
-367.3
|
-347.0
|
-375.2
|
|
Canada
|
|
|
|
|
|
|
|
|
Total exports
|
300.8
|
312.8
|
280.9
|
266.8
|
282.5
|
|
|
General
imports
|
332.5
|
349.3
|
296.2
|
277.8
|
300.0
|
|
|
Merchandise trade balance
|
-31.7
|
-36.5
|
-15.4
|
-11.0
|
-17.5
|
|
Mexico
|
|
|
|
|
|
|
|
|
Total exports
|
226.0
|
241.0
|
236.2
|
229.7
|
243.0
|
|
|
General
imports
|
280.6
|
295.7
|
296.4
|
294.1
|
314.0
|
|
|
Merchandise trade balance
|
-54.6
|
-54.7
|
-60.2
|
-64.4
|
-71.1
|
|
Japan
|
|
|
|
|
|
|
|
|
Total exports
|
65.2
|
66.9
|
62.4
|
63.2
|
67.7
|
|
|
General
imports
|
138.6
|
134.5
|
131.4
|
132.0
|
136.5
|
|
|
Merchandise trade balance
|
-73.3
|
-67.6
|
-69.0
|
-68.8
|
-68.8
|
|
South
Korea
|
|
|
|
|
|
|
|
|
Total exports
|
41.6
|
44.6
|
43.5
|
42.3
|
48.3
|
|
|
General
imports
|
62.4
|
69.7
|
71.8
|
69.9
|
71.2
|
|
|
Merchandise trade balance
|
-20.7
|
-25.0
|
-28.3
|
-27.6
|
-22.9
|
|
India
|
|
|
|
|
|
|
|
|
Total exports
|
21.8
|
21.5
|
21.5
|
21.7
|
25.7
|
|
|
General
imports
|
41.8
|
45.4
|
44.8
|
46.0
|
48.6
|
|
|
Merchandise trade balance
|
-20.0
|
-23.9
|
-23.3
|
-24.4
|
-22.9
|
|
Taiwan
|
|
|
|
|
|
|
|
|
Total exports
|
25.5
|
26.7
|
25.8
|
26.0
|
25.8
|
|
|
General
imports
|
37.9
|
40.8
|
40.9
|
39.2
|
42.5
|
|
|
Merchandise trade balance
|
-12.4
|
-14.2
|
-15.1
|
-13.2
|
-16.7
|
|
World
|
|
|
|
|
|
|
|
|
Total exports
|
1,578.5
|
1,621.9
|
1,503.1
|
1,451.0
|
1,546.7
|
|
|
General
Imports
|
2,268.0
|
2,356.4
|
2,248.2
|
2,187.8
|
2,342.9
|
|
|
Merchandise trade balance
|
-689.5
|
-734.5
|
-745.1
|
-736.8
|
-796.2
|
Source:
USITC DataWeb/USDOC (accessed March 14, 2018).
Note:
Corresponds to figures
1.4
,
6.1
,
6.3
,
6.5
,
6.7
,
6.9
,
6.11
,
6.13
,
6.15
.
Table
B.6
U.S. merchandise trade with major trading
partners and the world, 2017
|
Major trading partner
|
U.S. total exports
|
U.S. general imports
|
Share of total exports
|
Share of total imports
|
|
|
Million $
|
Percent
|
|
European
Union
|
283,517
|
434,933
|
18.3
|
18.6
|
|
China
|
130,370
|
505,597
|
8.4
|
21.6
|
|
Canada
|
282,472
|
299,975
|
18.3
|
12.8
|
|
Mexico
|
242,989
|
314,045
|
15.7
|
13.4
|
|
Japan
|
67,696
|
136,544
|
4.4
|
5.8
|
|
South Korea
|
48,277
|
71,164
|
3.1
|
3.0
|
|
India
|
25,700
|
48,631
|
1.7
|
2.1
|
|
Taiwan
|
25,754
|
42,492
|
1.7
|
1.8
|
|
All
others
|
431,795
|
443,040
|
27.9
|
18.9
|
|
World
|
1,546,733
|
2,342,905
|
|
|
Source:
Official trade statistics of the U.S. Department of Commerce (USDOC), accessible
via the USITC DataWeb (accessed March 14, 2018).
Note:
Because of rounding, figures may not add up to 100 percent. Corresponds to
figures
1.5
and
1.6
.
Table
B.7
U.S. private cross-border services trade
with selected major trading partners and the world
|
Country/region
|
Trade flow
|
2013
|
2014
|
2015
|
2016
|
2017
|
|
|
|
Billion $
|
|
European
Union
|
|
|
|
|
|
|
|
|
Exports
|
202.8
|
220.7
|
227.1
|
230.0
|
238.4
|
|
|
Imports
|
151.5
|
160.7
|
166.2
|
168.3
|
(
a
)188.5
|
|
|
Services trade balance
|
51.3
|
59.9
|
60.9
|
61.7
|
49.9
|
|
China
|
|
|
|
|
|
|
|
|
Exports
|
37.2
|
43.9
|
48.0
|
53.7
|
55.6
|
|
|
Imports
|
13.8
|
13.9
|
15.0
|
16.0
|
17.4
|
|
|
Services trade balance
|
23.3
|
29.9
|
33.0
|
37.6
|
38.2
|
|
Canada
|
|
|
|
|
|
|
|
|
Exports
|
62.5
|
60.6
|
54.2
|
53.5
|
58.3
|
|
|
Imports
|
30.5
|
29.8
|
28.9
|
29.7
|
32.5
|
|
|
Services trade balance
|
31.9
|
30.8
|
25.3
|
23.8
|
25.8
|
|
Mexico
|
|
|
|
|
|
|
|
|
Exports
|
29.5
|
29.8
|
31.2
|
31.6
|
32.8
|
|
|
Imports
|
17.1
|
19.8
|
22.8
|
24.4
|
26.2
|
|
|
Services trade balance
|
12.3
|
10.0
|
8.4
|
7.1
|
6.6
|
|
Japan
|
|
|
|
|
|
|
|
|
Exports
|
45.2
|
46.2
|
44.3
|
43.6
|
45.4
|
|
|
Imports
|
27.6
|
28.2
|
26.3
|
27.5
|
28.4
|
|
|
Services trade balance
|
17.6
|
18.0
|
17.9
|
16.0
|
17.1
|
|
South
Korea
|
|
|
|
|
|
|
|
|
Exports
|
20.7
|
20.0
|
20.4
|
20.8
|
22.8
|
|
|
Imports
|
8.1
|
8.2
|
8.8
|
8.8
|
9.4
|
|
|
Services trade balance
|
12.5
|
11.7
|
11.6
|
12.0
|
13.4
|
|
India
|
|
|
|
|
|
|
|
|
Exports
|
13.1
|
14.9
|
18.0
|
20.3
|
22.8
|
|
|
Imports
|
20.3
|
22.4
|
24.6
|
25.8
|
28.6
|
|
|
Services trade balance
|
-7.3
|
-7.5
|
-6.6
|
-5.5
|
-5.8
|
|
Taiwan
|
|
|
|
|
|
|
|
|
Exports
|
11.4
|
12.0
|
11.9
|
11.3
|
9.2
|
|
|
Imports
|
7.0
|
7.2
|
7.6
|
7.6
|
8.1
|
|
|
Services trade balance
|
4.4
|
4.7
|
4.3
|
3.6
|
1.1
|
|
World
|
|
|
|
|
|
|
|
|
Exports
|
678.6
|
721.4
|
732.0
|
733.6
|
761.7
|
|
|
Imports
|
435.7
|
456.5
|
470.1
|
483.1
|
516.0
|
|
|
Services trade balance
|
242.9
|
264.9
|
261.8
|
250.4
|
245.7
|
Source:
USDOC, BEA, Interactive data, International Transactions, Services, & IIP,
International Transactions, “Table 1.2 U.S. International Trade in Services,”
and “Table 1.3 U.S. International Transactions,” expanded detail by area and
country, March 21, 2018.
Note:
Data for 2017 are preliminary. Corresponds to figures
1.7
,
6.2
,
6.4
,
6.6
,
6.8
,
6.10
,
6.12
,
6.14
,
6.16
.
U.S.
imports from the EU in 2017 are overstated because the data include government
goods and services n.i.e.
Table
B.8
U.S. private cross-border services trade
with major trading partners and the world, 2017
|
Major trading partner
|
U.S. exports
|
U.S. imports
|
Share of total exports
|
Share of total imports
|
|
|
Million $
|
Percent
|
|
European
Union
|
238,425
|
(
)188,496
|
31.3
|
36.5
|
|
Canada
|
58,307
|
32,515
|
7.7
|
6.3
|
|
China
|
55,585
|
17,421
|
7.3
|
3.4
|
|
Japan
|
45,421
|
28,353
|
6.0
|
5.5
|
|
Mexico
|
32,795
|
26,150
|
4.3
|
5.1
|
|
Brazil
|
25,132
|
6,469
|
3.3
|
1.3
|
|
South
Korea
|
22,835
|
9424
|
3.0
|
1.8
|
|
India
|
22,763
|
28,562
|
3.0
|
5.5
|
|
Australia
|
21,909
|
7192
|
2.9
|
1.4
|
|
All others
|
238,557
|
171,433
|
31.3
|
37.7
|
|
World
|
761,729
|
516,015
|
|
|
Source:
USDOC, BEA, Interactive data, International Transactions, Services, & IIP,
International Transactions, “Tables 1.2 and 1.3, U.S. International Trade in
Services,” March 21, 2018.
Note:
Because of rounding, figures may not add to 100 percent. Data are preliminary.
Corresponds to figures
1.8
and
1.9
.
U.S.
imports from the EU in 2017 are overstated because the data include government
goods and services n.i.e..
Table
B.9
TAA petitions certified, by industry sector,
FY 2017
|
Industry sectors
|
Petition
|
Share of petitions
|
|
Manufacturing
|
487
|
57.7
|
|
Professional,
scientific, and technical services
|
98
|
11.6
|
|
Finance and insurance
|
67
|
7.9
|
|
Wholesale
trade
|
56
|
6.6
|
|
Information
|
50
|
5.9
|
|
Administrative
and support and waste management and remediation services
|
23
|
2.7
|
|
All other
|
63
|
7.5
|
Source:
USDOL, ETA, email message to USITC staff, March 16, 2018.
Note:
Other includes all industry sectors where fewer than 20 petitions were
certified in FY 2017. Corresponds to figure
2.1
.
WTO members are allowed to benefit
from special and differential treatment by implementing the agreement at their
own pace. The A, B, and C notifications indicate when the member will carry out
each trade facilitation measure––immediate implementation, implementation after
a transitional period, or implementation with assistance and support for
capacity building. “
The
WTO Trade Facilitation Agreement
,” n.d. (accessed July 25, 2018).