
Jeffrey Clark
(202) 205-3318
jeffrey.clark@usitc.gov
U.S. Trade Balance
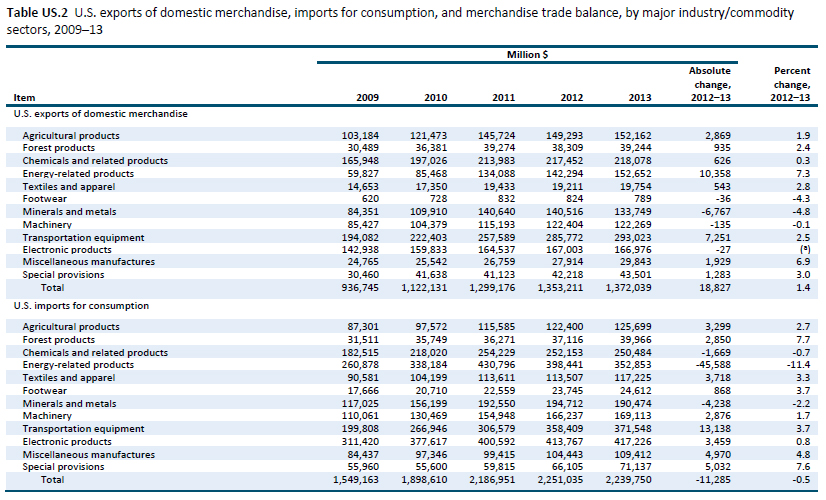
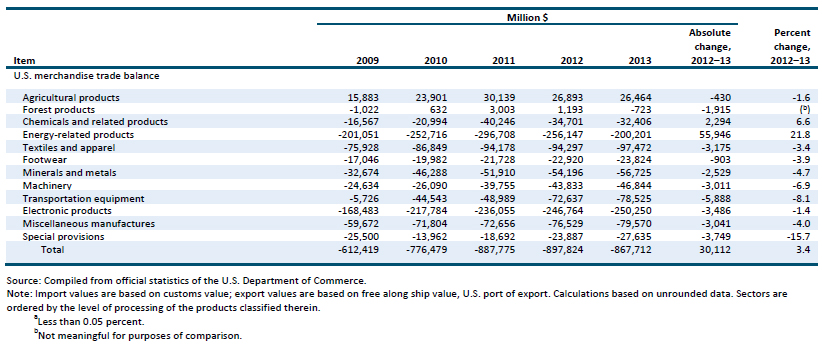
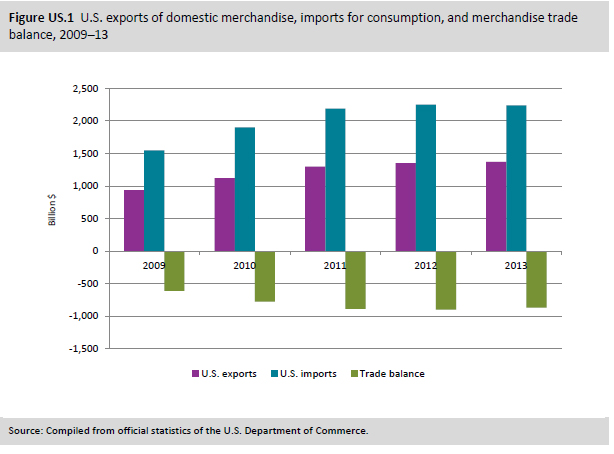
In 2013, 9 of the 10 U.S. merchandise sectors addressed in this report—all except the agricultural sector—registered trade deficits. Additionally, 8 of the 10 sectors experienced greater trade deficits or declines in trade surpluses. The chemicals and related products and the energy-related products sectors were the exceptions. In fact, the energy-related products sector experienced a substantial decline in its trade deficit, lowering the deficit in this sector by $55.9 billion (22 percent) (table US.2). The change in this sector was a major factor in the $30.1 billion (3 percent) decline in the overall U.S. trade deficit to $867.7 billion in 2013 (figure US.1). All of the sectoral deficits expanded by less than $6 billion, and none grew by more than 8 percent. Although the agricultural products sector recorded a trade surplus in 2013, its trade surplus declined by $430 million (2 percent) to $26.5 billion.
The energy-related products sector continued to perform well in 2013, as U.S. production of crude petroleum reached levels not seen since the 1990s and refineries produced at levels last reached in 2000. This increased production, combined with the continued gradual decline in U.S. consumption of these products, supported more exports and reduced the need for imports.
U.S. Exports
In 2013, U.S. exports increased by $18.8 billion (1 percent) to $1,372.0 billion, as exports in 6 of the 10 sectors reviewed in this report increased. The energy-related products sector recorded the greatest increase in both absolute ($10.4 billion) and percentage (7 percent) terms. In addition to the changes in domestic production and consumption of energy-related products noted above, continued strong global demand for distillate fuel oils also contributed to increased U.S. exports in this sector.
U.S. exports of transportation equipment and minerals and metals experienced the next-largest shifts in 2013. Exports of aircraft equipment and motor vehicles increased by $13.6 billion, driving the transportation equipment sector’s overall $7.3 billion rise in exports (table US.3).
Increased domestic consumption of natural and synthetic stones and decreased interest in holding precious metals led to a decline in U.S. minerals and metals exports (down $6.7 billion, or 5 percent). In anticipation of greater U.S. demand for jewelry, the U.S. industry exported fewer stones for cutting and processing overseas.
U.S. Imports
In 2013, the value of total U.S. imports fell 0.5 percent to $2,239.8 billion, with the largest absolute shifts occurring in energy-related products (down $45.6 billion to $352.9 billion), transportation equipment (up $13.1 billion to $371.5 billion), and minerals and metals (down $4.2 billion to $190.5 billion). Significant reductions in imports of energy-related products (down $45.6 billion, or 11 percent) drove the contraction in the value of overall U.S. imports. Lower domestic consumption of crude petroleum and higher U.S. production of this commodity contributed to these reductions.
Mexican suppliers accounted for most of the growth in U.S. imports of transportation equipment in 2013. Benefiting from proximity to the United States, lower labor costs than the United States, and duty-free access under the North American Free Trade Agreement (NAFTA), Mexico’s exports to the United States increased by $7.2 billion (9 percent) even as exports to the U.S. market from Canada and Japan declined.

Shifts in U.S. Bilateral/Multilateral Trade Among Leading Trading Partners
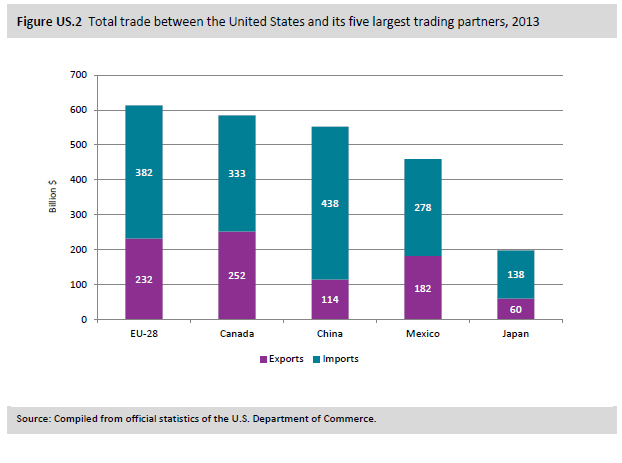
In 2013, the United States’ top five trading partners continued to be the 28 members of the European Union (EU-28), Canada, China, Mexico, and Japan (figure US.2). U.S. trade deficits increased with the EU-28 (up $11.3 billion to $149.9 billion), China (up $2.5 billion to $323.8 billion), and Canada (up $1.5 billion to $81.2 billion), but fell with Japan (down $1.7 billion to $78.3 billion) and Mexico (down $5.3 billion to $96.0 billion) (table US.4). Together, these trading partners accounted for 67 percent of total U.S. trade with the world. The U.S. trade deficit with these countries was equivalent to 84 percent of the total U.S. trade deficit.
The largest trade balance shift in 2013 occurred with the members of the Organization of Petroleum Exporting Countries (OPEC); the collective U.S. trade deficit with this group fell by $31.5 billion (33 percent) to $63.4 billion. The United States reduced its imports of energy-related products from several individual OPEC members by $5–$7 billion each. The combined effect on U.S. trade with OPEC and on the overall U.S. trade balance was substantial.


The U.S. trade deficit with China—the largest source of U.S. imports by value—grew by $2.5 billion (0.8 percent) to $323.8 billion in 2013. Electronic products, comprising computers, peripherals, and telecommunications equipment, continued to account for 40 percent of U.S. merchandise imports from China.
Overall trade with Japan—the fourth-largest source of U.S. imports by value—contracted by over 5 percent in 2013. Declines occurred in both exports (down by $4.9 billion, or 8 percent) and imports (down by $6.6 billion, or 5 percent) and were distributed across many sectors. The U.S. trade deficit with Japan fell by 2 percent in 2013.