View Section in Publication :: Return to Overview
Exports, Imports and Trade Balance

Key Trends
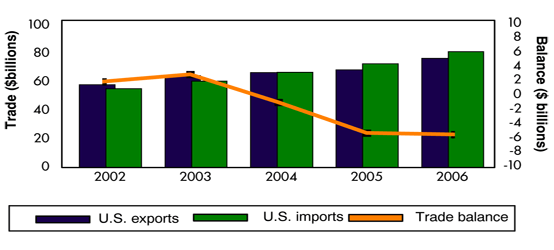
- Gains in U.S. exports equaled the rise in U.S. imports of agricultural products in 2006, and the U.S. trade deficit in agricultural products stabilized at $4.5 billion. (See footnote 1 in Agricultural Products) U.S. exports and U.S. imports of agricultural goods each rose by 12 percent in 2006.
- U.S. exports of agricultural products rose by $8.2 billion (12 percent) to $76.9 billion in 2006. The largest absolute trade shift among agricultural product exports in 2006 was the $2.2 billion (20 percent) increase in U.S. exports of grain (cereals). Grain exports were the single-largest category of U.S. agricultural exports at $13.3 billion in 2006, and 85 percent of these were corn. Strong demand for corn to produce ethanol led to increasing prices in the United States.
- U.S. imports of agricultural products rose by $8.4 billion (12 percent) to $81.5 billion in 2006. U.S. imports of ethanol, fish, sugar, beer and distilled spirits, vegetable oils, and fresh fruits and vegetables increased. The rise in U.S. imports of agricultural goods reflected much higher U.S. ethanol imports, mostly from Brazil, and higher raw sugar imports from Mexico.
Trade Shifts in 2006 from 2005
- U.S. trade deficit: Increased by $180 million (4 percent) to $ 4.5 billion
- U.S. exports: Increased by $8.2 billion (12 percent) to $76.9 billion
- U.S. imports: Increased by $8.4 billion (12 percent) to $81.5 billion
USITC Publications
