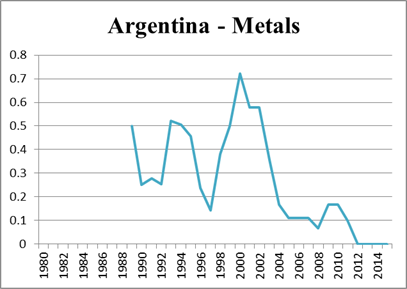
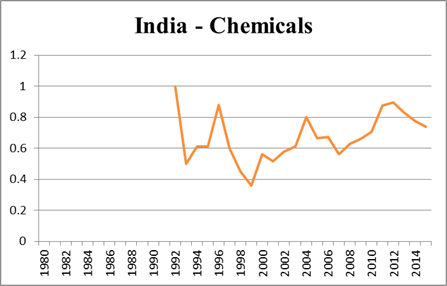
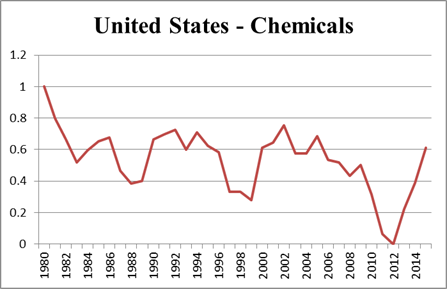
Figure 1: 3 year moving averages of upstream percentage
|
|
|
|
|
|
|
|
|
|
|
|
|
|
|
Maxwell T. Andersen
Robert M. Feinberg
ECONOMICS WORKING PAPER SERIES
Working Paper 2017-09-A
U.S. INTERNATIONAL TRADE COMMISSION
500 E Street SW
Washington, DC 20436
September 2017
Office of
Economics working papers are the result of ongoing professional research of
USITC Staff and are solely meant to represent the opinions and professional
research of individual authors. These papers are not meant to represent in any
way the views of the U.S. International Trade Commission or any of its
individual Commissioners. Working papers are circulated to promote the active
exchange of ideas between USITC Staff and recognized experts outside the USITC
and to promote professional development of Office Staff by encouraging outside
professional critique of staff research.
Fishing Downstream Revisited: A Multi-country Analysis of Antidumping Patterns
Maxwell T. Andersen and Robert M. Feinberg
Office of Economics Working Paper 2017-09-A
September 2017
ABSTRACT
A long-held view in international trade policy analysis is that import protection flows downstream. This paper updates the descriptive analysis of Feinberg and Kaplan (1993), looking at trends in upstream and downstream antidumping and countervailing-duty cases since the US Trade Agreements Act of 1979. It covers the period from 1980 to 2015 for the five leading users of temporary trade barriers (TTBs): Argentina, Brazil, the European Union, India, and the United States. We examine evidence for two broad sectors which have dominated the use of TTBs: metals and chemicals. Both via descriptive trend analysis and simple statistical estimation, we find suggestive evidence in support of cascading trade protection, though more so for the developing countries studied.
Maxwell T. Andersen
Graduate Institute of International and Development Studies and USITC
Robert M. Feinberg
American University and USITC
A long-held view in international trade policy analysis is that import protection flows downstream. Tariffs or quotas supporting an upstream domestic industry inevitably raise input prices for domestic firms consuming the output of that industry in producing intermediate goods. These intermediate-goods producers, facing competitive pressures limiting their ability to raise prices will seek import protection to block these competitive pressures. If successful in passing on higher prices they will cause harm to final-goods producers, who may then lobby or petition for protection. This phenomenon is commonly referred to as “cascading trade protection.”
This paper updates the descriptive analysis of Feinberg and Kaplan (1993), looking at trends in upstream and downstream antidumping and countervailing-duty cases since the US Trade Agreements Act of 1979. It covers the period from 1980 to 2015 for the five leading users of temporary trade barriers[1] (TTBs) over that period: Argentina, Brazil, the European Union, India, and the United States. We look at evidence from two broad sectors which have dominated the use of TTBs: metals and chemicals (see Table 1).
Table 1: Metals and Chemical Cases as % of All Cases
|
|
All |
Metals and Chemicals |
Percentage |
|
Argentina |
327 |
203 |
62% |
|
Brazil |
476 |
362 |
76% |
|
European Union |
871 |
657 |
75% |
|
India |
767 |
662 |
86% |
|
United States |
1932 |
1518 |
79% |
In addition to a descriptive analysis mirroring that of Feinberg and Kaplan, we employ two simple econometric specifications to examine the role of upstream cases in determining downstream cases; we also consider whether such patterns differ between developed and developing economies. After a short review of research conducted on cascading trade protection over the past 25 years in Section II, Section III provides background on antidumping and countervailing duty procedures in each country considered. Section IV explains the data, and provides descriptive statistics of the trends in upstream and downstream trade protection. Section V provides an overview of the empirical specifications used, while Section VI presents and discusses two simple panel analyses of cascading trade protection. Finally, Section VII provides a brief conclusion.
Formal models of cascading trade protection originate from the work of Hoekman and Leidy (1992), who model vertical linkages in incentives for protection. They conclude (p. 891) that “contingent protection tends to flow downstream naturally because of the transmission of injury….But in addition to this, contingent protection may be pursued precisely because of the likelihood of downstream injury and cascading protection.” Sleuwaegen et al. (1998) followed by bringing in variation in market structure as a determinant of the likelihood of cascading trade protection; they also show that an increased likelihood of this pattern is associated with greater welfare harm from these practices.[2]
Empirical work has generally supported the notion that upstream protection harms downstream industries (e.g., Krupp and Skeath (2002), Konings and Vandenbussche (2013), Blonigen (2015)), but there has been little empirical examination of the cascading protection hypothesis with Feinberg and Kaplan (1993) providing some suggestive support based on the early years of “modern” US antidumping and countervailing-duty petitions, and a much more sophisticated recent approach by Erbahar and Zi (2017) comparing the US and EU experience. As far as we know, however, no paper has yet attempted to analyze cascading trade protection in the context of developing countries.
Through its empirical analysis of downstream TTB initiation, this paper is also related to the literature on the macroeconomic determinants of antidumping and countervailing duty initiations. Bown and Crowley (2013) suggest a negative relationship between both real GDP growth and growth rate of the rest of the world and case filings. In the case of real exchange rates and their movements, Feinberg (1989) suggests that a weaker currency leads to a greater number of filings. Conversely, Knetter and Prusa (2002) find results that suggest the opposite.[3] In terms of differential patterns facing developed vs. developing economies and the relevance of the Uruguay Round and the creation of the World Trade Organization, Feinberg and Reynolds (2007) find that countries making larger post-Uruguay Round tariff adjustments were more likely to increase antidumping petitions in the following years.
Antidumping (AD) laws are designed to protect domestic industries against dumping, i.e. imports of “like” products sold at less than “fair” value. This is the case when the import is sold at less than its cost of production, less than the price on the importer’s domestic market, or less than a composite world price for the good. Countervailing duties (CVD) are imposed in response to a subsidy granted to an importer by their government that is harming domestic producers of like products. For both AD and CVD, the domestic industry must show they have experienced “material injury” as a result.
The analytical framework used here is the same as that set out in Feinberg and Kaplan (1993), which provides a full overview. For our purposes, it suffices that TTB provides a ‘technical track’ to relief from import competition, which is lower-cost and more predictable than lobbying legislators for more permanent statutory protection. The main change to the world trade system since that article has been the creation of the World Trade Organization in 1995. As a result, domestic legislation cannot run afoul of WTO rules, further limiting its protective use. The incentive for domestic firms to turn to TTBs is thus likely even greater than it was prior to the creation of the WTO.
Each country[4] considered here has its own methodology for determining whether dumping is occurring, and whether injury is being caused to domestic producers. The common factor between the different countries is that the injured party can seek redress from the relevant authority. We briefly summarize the procedure for each country, drawing heavily on the most recent WTO Trade Policy Reviews for each.
In Argentina, the authority competent for the initiation of anti-dumping and countervailing investigations is the Secretariat for Foreign Trade (SCEX). The Unfair Competition Directorate (DCD) conducts reviews and presents the corresponding technical reports in dumping and subsidy cases. The authority competent for injury analysis and determination and causal link is the National Commission on Foreign Trade (CNCE). On the basis of the DCD's technical reports and the injury assessments of the National Commission on Foreign Trade of the Undersecretariat for Foreign Trade and International Relations (SSCEyRI), which is part of the Secretariat for Foreign Trade of the Ministry of the Economy and Public Finance (MEFP), a recommendation is made to the Secretariat for Foreign Trade, which then adopts a petition with respect to the investigation. Investigations are initiated at the request of the domestic industry or ex officio. SSCEyRI is responsible for determining whether dumping or a subsidy exists, while CNCE determines whether injury occurred. MEFP may then implement duties if both existence and injury are found to exist.[5]
In Brazil, the Department of Trade Remedies (DECOM) is in charge of carrying out the fact-finding and analysis of AD and CVD investigations. The Council of Ministers of the Chamber of Foreign Trade (CAMEX) is in charge of decision-making, and may levy provisional duties on imports from the date of its preliminary determination. The Technical Group for Public Interest Assessment (GTIP) is charged with examining requests to suspend or modify provisional or definitive measures for reasons of public interest.[6]
In India, AD legislation is contained in the Customs Tariff Act 1975, as amended by the Customs Tariff (Amendment) Act 1995, and the Customs Tariff (Identification, Assessment and Collection of Anti-Dumping Duty on Dumped Articles and for Determination of Injury) Rules 1995. AD investigations can be initiated by the Directorate General of Anti-Dumping and Allied Duties (DGAD) of the Department of Commerce either on its own initiative, or by request of domestic industry. Applications for protection must be adequately documented, and petitioners must account for at least 25% of all domestic production of the good in question, and be expressly supported by producers accounting for at least 50% of domestic production. DGAD is then charged with determining whether there is sufficient evidence of dumping, injury, and causal link between dumped imports and the injury before initiating the investigation. A finding of dumping can be followed by the imposition of a duty by the Department of Revenue of the Ministry of Finance. AD may also be levied retrospectively, but may not go beyond 90 days prior to the date of imposition of a provisional duty.[7]
In the European Union, The Commission investigates allegations of dumping or subsidies based on a complaint from producers, but it may also self-initiate investigations. An investigation determines whether there has been dumping or subsidization, whether material injury has occurred, whether there is a link between the dumping/subsidy and the injury, and whether the imposition of measures is in the EU's interest. If measures are imposed, the exporters may offer "undertakings", meaning that an arrangement is made on the price, and additional duties will not be collected. After the initial investigative process, the EU legislation provides for a number of possible reviews depending on circumstances, i.e. expiry reviews, interim reviews, newcomer investigations, absorption investigations, and circumvention investigations.[8]
Finally, in the United States, ADs and CVDs are governed by the Tariff Act of 1930, the Trade Agreements Act of 1979, the Trade and Tariff Act of 1984, the Omnibus Trade and Competitiveness Act of 1988, and the Uruguay Round Agreements Act of 1994. The International Trade Administration (ITA) of the Commerce Department is charged with investigating subsidy and dumping claims, as well as calculations of dumping margins. The U.S. International Trade Commission is charged with determining whether injury to the domestic producer has occurred. If both dumping/illegal subsidization and domestic injury are found to have occurred, the ITA issues an order imposing AD or CVD.[9]
In all countries, it is likely that that dumped or unfairly subsidized imports can almost always be found, at least in a preliminary investigation.[10] Injury, which is required for an imposition of antidumping duties, is less often found. However, previous work (Prusa 1992) has found that even the filing of an AD case has a protective impact. The link of upstream to downstream cases follows as higher input costs resulting from upstream AD/CVD cases imply lower profits and less ability to compete globally. While this injury may not be directly related to unfairly traded imports, we expect to see more calls for TTB petitions downstream. Thus, we use downstream and upstream case initiations as our key dependent and independent variables, respectively.
The main data set used in this analysis was the World Bank’s Temporary Trade Barriers Database, which provides a detailed list of all TTB cases initiated by a country since that country began using TTBs. We separated goods into upstream and downstream, applying a straightforward methodology.[11] In the case of metals, anything in HS Chapter 72 was counted as upstream, as were any other upstream, i.e. relatively unprocessed, goods from Chapters 74-81. Any products from chapters 73, and 82-84 were counted as downstream, and anything from chapters 74-81 not classified as upstream was counted as downstream. We applied a similar methodology for separating chemical products. Anything under chapters 28 or 29 was counted as upstream, and anything from chapters 30-40 was counted as downstream.[12] The resulting data was then cleaned by hand, with some slight adjustments made to the classifications outlined above to better reflect input-output relationships of the products within (e.g., raw PVC was made upstream to reflect its use in downstream PVC pipes, and PET film was made upstream to reflect its use in plastic carrier bags). We also collected unemployment (Federal Reserve Economic Data), real GDP (World Bank), and real exchange rate (FRED) data for all countries considered, to build a panel dataset. Due to data availabilities, these data form an unbalanced panel.[13]
Descriptive Statistics
Table 2: Total Collapsed TTB Cases
|
Country |
Period |
UM |
DM |
UC |
DC |
|
Argentina |
1994-2015 |
24 |
55 |
14 |
35 |
|
Brazil |
1989-2015 |
20 |
35 |
55 |
46 |
|
European Union |
1991-2015 |
41 |
84 |
50 |
74 |
|
India |
1992-2014 |
25 |
23 |
145 |
76 |
|
United States |
1980-2015 |
144 |
346 |
98 |
79 |
Table 3: Total Uncollapsed TTB Cases
|
Country |
Period |
UM |
DM |
UC |
DC |
|
Argentina |
1994-2015 |
48 |
78 |
24 |
53 |
|
Brazil |
1989-2015 |
72 |
45 |
116 |
129 |
|
European Union |
1991-2015 |
92 |
182 |
101 |
142 |
|
India |
1992-2014 |
89 |
44 |
311 |
192 |
|
United States |
1980-2015 |
493 |
715 |
188 |
122 |
We created two tables of counts of AD and CVD case initiations for each of the 5 countries we considered (Argentina, Brazil, the European Union, India, and the United States). One table collapsed all cases with the same heading,[14] while the other kept all cases disaggregated. We used those data to compute 3 year averages of upstream case percentages, in keeping with Feinberg and Kaplan (1993).
To motivate our analysis, Figure 1 provides a plot of 3 year moving averages of the upstream percentage of cases for every country and sector.[15] Feinberg and Kaplan (1993) in their descriptive analysis identified a clear trend in US TTB filings: a high upstream percentage of cases early in their sample was followed by a low upstream percentage later in the sample. Our much longer panel of data across 5 different countries seems to confirm this, albeit with different periodicities. The plots below, irrespective of country, generally show that periods of high upstream percentage tend to be followed by periods of low upstream percentage.
Figure 1: 3 year moving averages of upstream percentage
|
|
|
|
|
|
|
|
|
|
|
|
|
|
|
In attempting to go beyond the examination of simple trends in analyzing upstream/downstream AD and CVD filing patterns, we use a panel data regression approach. Thus, we regressed counts of downstream case initiations on the average number of upstream case initiations in the previous three years and a vector of control variables using both a simple fixed effects estimator, as well as a panel fixed effects Poisson estimator.[16]
We used a fixed effects estimator to account for unobservable country-level heterogeneity. These are apparent when looking at the overall trends as presented in Figure 1 or the total number of TTB case initiations as presented in Tables 2 and 3. Those differences reflect not only prevailing macroeconomic conditions in each countries, but also each country’s particular idiosyncrasies. Fixed effects allow us to control for those.
The case for using a Poisson estimator is straightforward. Our dependent variable is a whole, non-negative integer, fitting the definition of count data, thus suggesting the use of count variable estimator. We choose a Poisson estimator over the negative binomial estimator as the Poisson estimator may be made robust to clustering, which is not possible with the fixed-effects negative binomial estimator in Stata.[17] We feel that using a Poisson panel estimator in this case is preferable, as the robustness of the standard errors can outweigh the efficiency gains from accounting for overdispersion (Cameron and Trivedi, 2010, pp. 641). Moreover, there is some controversy over whether the conditional fixed effects negative binomial model proposed by Hausman et al. (1984) is able to effectively control for time-invariant covariates. Alison and Waterman (2002), based on simulation results suggest that the Hausman et al. model fails to properly control for time-invariant covariates, and that an unconditional negative binomial regression including individual dummies provides a better alternative to the fixed effects conditional negative binomial panel estimator. We thus chose the Poisson estimator due to its relative robustness and the alternatives being somewhat flawed.[18]
The fixed effects estimator is:
|
|
And a Poisson panel estimator:[19]
|
|
|
|
|
In both cases, the composite error term eit includes the time-invariant individual-specific heterogeneity, ci as well as the usual error term, uit. Xit is a vector of control variables, including lagged GDP growth, the lagged real exchange rate, lagged real exchange rate growth, the lagged unemployment rate and lagged changes in unemployment, a ‘WTO’ dummy variable equal to 1 starting in 1995, and lagged GDP growth in the rest of the world. As explained in the literature review, these variables were chosen as there is evidence in the literature and in economic theory of their importance to TTB initiation. Given that we are looking specifically at downstream case initiations, we are unsure that the relationships established in the theory will hold for that subsample. That is relatively unimportant, however, as we are simply seeking to control for all possible sources of endogeneity, rather than estimate effects.
We used averaged upstream cases from the preceding three years. This methodology has the principal merit of following WTO recommendation G/ADP/6, which states that, when making an injury determination, the relevant authority should take into consideration at least the past three years. The three year approach also mirrors the methodology of Erbahar and Zi. Moreover, the logic for aggregating cases rather than considering individual lags is quite straightforward: exactly when an upstream case is initiated (i.e. at which lag) is less important than the fact that it was initiated in the ‘recent past’. The introduction to Erbahar and Zi provides two good examples of this in practice: in the case of hot-rolled steel, it was the third lag of the upstream metals count affected the downstream metals (i.e. it was from three years prior). In the case of PET, it was the second lag of upstream chemicals (raw PET) that affected downstream users of raw PET.
We present results from the fixed-effects regressions in Table 4 and from the fixed-effects panel Poisson regressions in Table 5. These include regressions for both the “collapsed” and “uncollapsed” case definitions established earlier, with results not very sensitive to this issue. The control variables have generally insignificant coefficients, possibly due to multicollinearity concerns. However the variable of interest, recent past upstream cases clearly has a positive and highly significant effect on downstream cases, consistent with cascading trade protection.
Table 4: Country fixed effects regressions:
Dependent variable: number of downstream antidumping or countervailing duty cases initiated in a given year
|
|
Collapsed Cases |
Uncollapsed Cases |
||||
|
|
(1) |
(2) |
(3) |
(4) |
||
|
VARIABLES |
Metals |
Chemicals |
Metals |
Chemicals |
||
|
|
|
|
|
|
||
|
Number of upstream cases (3 year lagged average) |
0.573** |
0.0883*** |
0.336*** |
0.138*** |
||
|
(0.204) |
(0.00701) |
(0.0458) |
(0.0170) |
|||
|
|
|
|
|
|||
|
Lagged real GDP growth |
-30.10 |
2.188 |
-13.37 |
18.78 |
||
|
(40.01) |
(8.675) |
(34.48) |
(26.54) |
|||
|
Lagged unemployment (growth) |
-0.483 |
-0.0192 |
-1.275 |
0.0242 |
||
|
|
(0.698) |
(0.0708) |
(1.615) |
(0.0654) |
||
|
Lagged unemployment (level) |
0.471 |
-0.166 |
0.177 |
-0.637 |
||
|
(0.431) |
(0.144) |
(0.257) |
(0.556) |
|||
|
Lagged real exchange rate (level) |
-0.0198 |
0.0129 |
0.0138 |
0.0370 |
||
|
(0.0214) |
(0.0105) |
(0.00985) |
(0.0381) |
|||
|
Lagged real exchange rate growth |
7.368 |
-0.606 |
2.408 |
-2.214 |
||
|
(4.687) |
(1.638) |
(2.478) |
(5.638) |
|||
|
Lagged GDP growth rate in the rest of the world |
-23.35 |
-21.07** |
-2.256 |
-44.15*** |
||
|
(23.96) |
(6.915) |
(42.89) |
(9.551) |
|||
|
Constant |
7.295** |
2.389** |
8.670* |
4.814* |
|
|
|
|
(2.587) |
(0.583) |
(3.845) |
(1.824) |
|
|
|
Observations |
119 |
118 |
118 |
118 |
|
|
|
R-squared |
0.288 |
0.067 |
0.284 |
0.065 |
|
|
|
Number of countries |
5 |
5 |
5 |
5 |
|
|
Robust standard errors in parentheses
*** p<0.01, ** p<0.05, * p<0.1
Table 5: Poisson regressions
Dependent variable: number of downstream antidumping or countervailing duty cases initiated in a given year
|
|
Collapsed Cases |
Uncollapsed Cases |
|
|||
|
|
(1) |
(2) |
(3) |
(4) |
|
|
|
VARIABLES |
Metals |
Chemicals |
Metals |
Chemicals |
|
|
|
|
|
|
|
|
|
|
|
Number of upstream cases (3 year lagged average) |
0.0409*** |
0.0237*** |
0.00993*** |
0.0152*** |
|
|
|
(0.0103) |
(0.00200) |
(0.00324) |
(0.00349) |
|
||
|
|
|
|
|
|
||
|
Lagged real GDP growth |
-8.098 |
0.536 |
-1.299 |
2.985 |
|
|
|
(7.071) |
(3.651) |
(5.279) |
(5.325) |
|
||
|
Lagged unemployment (level) |
-0.164 |
-0.000953 |
-0.193 |
0.0164 |
|
|
|
|
(0.127) |
(0.0395) |
(0.133) |
(0.0208) |
|
|
|
Lagged unemployment (growth) |
0.0886 |
-0.0894 |
-0.00991 |
-0.160* |
|
|
|
(0.0540) |
(0.0667) |
(0.0339) |
(0.0966) |
|
||
|
Lagged real exchange rate (level) |
-0.00155 |
0.00646 |
0.00510*** |
0.00772 |
|
|
|
(0.00209) |
(0.00471) |
(0.00194) |
(0.00672) |
|
||
|
Lagged real exchange rate growth |
2.061*** |
-0.103 |
0.836 |
-0.0523 |
|
|
|
(0.667) |
(0.801) |
(1.117) |
(1.208) |
|
||
|
Lagged growth rate differential |
-7.424* |
-7.299** |
-5.774 |
-6.438*** |
|
|
|
(4.457) |
(2.966) |
(3.693) |
(2.420) |
|
||
|
WTO dummy variable |
-0.862*** |
0.285 |
-0.787*** |
0.593 |
|
|
|
(0.217) |
(0.301) |
(0.212) |
(0.505) |
|
||
|
Observations |
119 |
119 |
119 |
119 |
||
|
Number of countries |
5 |
5 |
5 |
5 |
||
Robust standard errors in parentheses
*** p<0.01, ** p<0.05, * p<0.1
These results are also quite robust to the inclusion of additional factors (notably a time trend and additional independent variable lags) and the omission of various macro determinants.[20] Moreover, they are qualitatively robust to specification, in that two different negative binomial regressions (the conditional fixed effects and unconditional country dummy variable estimators discussed previously) also report positive coefficients on past upstream cases.
As our sample consists of a mix of highly developed and developing economies, the question arises of whether the patterns observed will hold if we estimate these separately. Table 6 presents results (only for the main coefficient of interest) when we estimate separately for EU/US and Argentina/Brazil/India. One consideration here is the reduced degrees of freedom for each separate estimation. We find that our suggestion of cascading trade protection holds unevenly: all of the estimated coefficients for developing economies are positive, but only for chemicals (and only with the “collapsed” case definition) is the coefficient statistically significant. For developed countries, by contrast, most estimated coefficients are negative, though the only statistically significant estimated coefficient (uncollapsed metals) is positive.
Table 6: Subsample regressions (coefficients on average upstream cases, robust standard errors)
Country Fixed Effects:
|
|
Collapsed |
|
Uncollapsed |
|
|
|
(1) |
(2) |
(3) |
(4) |
|
Country Group |
Metals |
Chemicals |
Metals |
Chemicals |
|
Developing |
0.0281 |
0.0751*** |
0.0920 |
0.0758 |
|
Developed |
0.0127 |
-0.294 |
0.144** |
-0.0711 |
Robust standard errors in parentheses.
*** p<0.01, ** p<0.05, * p<0.1
Poisson:
|
|
Collapsed |
|
Uncollapsed |
|
|
|
(1) |
(2) |
(3) |
(4) |
|
Country Group |
Metals |
Chemicals |
Metals |
Chemicals |
|
Developing |
0.0347 |
0.0180*** |
0.0422 |
0.00399 |
|
Developed |
-0.0242 |
-0.127 |
0.00333 |
-0.0164 |
Robust standard errors in parentheses.
*** p<0.01, ** p<0.05, * p<0.1
We can only speculate about why this difference by stage of development is found for downstream AD and CVD petitions, noting that we are controlling for macroeconomic factors that have previously been shown to influence case filing activity more generally. One possibility is that the long history of the use of this form of contingent protection and mature “industry” of antidumping practitioners means that downstream users in the US and the EU will focus more on their own direct competitive pressures demand shocks, import sources than on upstream protection in deciding on whether to file cases or not.[21]
This paper has expanded the limited empirical study of upstream/downstream patterns of trade protection by looking at antidumping and countervailing duty petitions filed in the five leading users of this form of temporary trade barriers since 1980. There appears to some evidence of cyclical trends in the mix of cases consistent with cascading trade protection, however when macroeconomic determinants are considered the role of upstream cases in driving downstream protection seems to be driven primarily by the three large developing country users. We acknowledge that our study is a broad brush look at the topic and future research should take a more detailed look at specific input-output relationships (similar to what Erbahar and Zi (2017) do for the US) in examining the cascading trade protection hypothesis for developing economies.
Allison, Paul and Richard P. Waterman, “Fixed-Effects Negative Binomial Regression Models”, Sociological Methodology, 2002
Anderson, James M., “Domino Dumping, I: Competitive Exporters”, The American Economic Review, 1992
Anderson, James M., “Domino Dumping II: Anti-dumping”, Journal of International Economics, 1993
Blonigen, Bruce, “Industrial policy and downstream export performance,” The Economic Journal, 2015
Bown, Chad P. and Meredith Crowley, “Import protection, business cycles, and exchange rates: Evidence from the Great Recession,” Journal of International Economics, 2002
Cameron, Colin A. and Pravin K. Trivedi (2010) Microeconometrics using Stata, Stata Press
Erbahar, Aksel and Yuan Zi, “Cascading trade protection: evidence from the US,” Journal of International Economics, forthcoming.
Feinberg, Robert M., “Exchange rates and unfair trade,” The Review of Economics and Statistics, 1989
Feinberg, Robert M and Seth Kaplan, “Fishing downstream: the political economy of effective administered protection,” Canadian Journal of Economics, 1993.
Feinberg, Robert M., “US antidumping and macroeconomic indicators revisited: do petitioners learn?”, Review of World Economics, 2005
Feinberg, Robert M. and Kara M. Reynolds, “Tariff Liberalisation and Increased Administrative Protection: Is There a Quid Pro Quo?”, The World Economy, 2007
Guimaraes, Paulo, “The fixed effects negative binomial model revisited”, Economics Letters, 2008
Hausman, Jerry, Bronwyn H. Hall, and Zvi Griliches, “Econometric Models for Count Data with an Application to the Patents-R&D Relationship,” Econometrica, 1984
Hoekman, Bernard M. and Michael P. Leidy, “Cascading contingent protection,” European Economic Review, 1992.
Knetter, Michael M. and Thomas J. Prusa, “Macroeconomic factors and antidumping filings: evidence from four countries,” Journal of International Economics, 2002
Konings, Jozef and Hylke Vandenbussche, “Antidumping protection hurts exporters: firm-level evidence,” Review of World Economics, 2013.
Krupp, Corinne M. and Susan Skeath, “Evidence of the upstream and downstream impacts of antidumping cases,” North American Journal of Economics and Finance, 2002.
Ossa, Ralph, ”Trade wars and trade talks with data,” American Economic Review, 2014.
Prusa, Thomas J., “Why are so many antidumping petitions withdrawn?”, Journal of International Economics, 1992
Sleuwaegen, Leo, Rene Belderbos, and Clive Jie-A-Joen, “Cascading contingent protection and vertical market structure,” International Journal of Industrial Organization, 1998.
World Trade Organization, “Argentina Trade Policy Review”, 2013
World Trade Organization, “Brazil Trade Policy Review”, 2017
World Trade Organization, “India Trade Policy Review”, 2015
World Trade Organization, “European Union Trade Policy Review”, 2017
World Trade Organization, “United States of America Trade Policy Review”, 2017
World Trade Organization, “Recommendation Concerning the Periods of Data Collection for Anti-Dumping Investigation”, G/ADP/6, 2000
[1] We include specifically antidumping (AD) and countervailing (CVD) duties in our definition of TTBs.
[2] The work of Anderson (1992; 1993) and, more recently, Ossa (2014) is useful to explain the growth of both dumping and antidumping actions, though neither models the vertical linkages involved in cascading trade protection.
[3] Feinberg (2005) provides a rationale for a change in this exchange rate impact over time with petitioners increasingly focused on the “material injury” determination rather than the “dumping” finding.
[4] We use this term well aware that the European Union/European Communities does not fit the traditional definition. However, as the Union has sole competency for trade policy, treating the EU as a unified whole makes sense.
[5] World Trade Organization, Argentina Trade Policy Review (2013), pp. 77-79
[6] World Trade Organization, Brazil Trade Policy Review (2017), pp. 55.
[7] World Trade Organization, India Trade Policy Review (2015), pp. 55-56.
[8] World Trade Organization, European Union Trade Policy Review (2017), pp. 59
[9] World Trade Organization, United States of America Trade Policy Review (2017), pp. 53-55
[10] Evidence suggesting nearly all antidumping petitions filed receive an affirmative preliminary dumping determination does not say that all potential cases would yield a similar result. However, at least for the US, it is generally thought that international price discrimination and more elastic demand in the US market than in foreign home markets points to lower prices on most goods in the US than abroad, consistent with a definition of dumping.
[12] We also note that a special methodology was adopted for Argentina. As Argentina is relatively poor in natural resources, it does not have many upstream producers to petition for protection. As a result, we identified intermediate products that were more upstream and counted those as upstream products.
[13] The statistical package used for the analysis, STATA, automatically controls for unbalanced panels. Moreover, our analysis is robust to the balanced subsample.
[14] More exactly, all cases covering the same products, and which have the same CASE_REPCODE in the spreadsheet of cases were ‘collapsed’ and only counted as one case.
[15] The upstream percentages and resulting moving averages were very similar irrespective of whether collapsed or uncollapsed cases were used, and thus we only report the graphs of collapsed upstream percentages.
[16] Both regressions used robust standard errors.
[17] We note that we differ in our approach from recent work on determinants of TTBs (Knetter and Prusa, 2002; Bown and Crowley, 2013), which used panel negative binomial estimators, despite their shortcomings.
[18] We also note that our results are robust to all three different specifications, conditional panel negative binomial fixed effects, unconditional country-dummy negative binomial, and panel Poisson, with similar degrees of directions, magnitudes, and statistical significance of coefficients.
[19] The exact basis for the panel Poisson estimator is set out in Hausman et al., 1984.
[20] Additional results are available upon request.
[21] Another possibility is that petitioners in developed economies expect that their trade policy enforcement agencies are more closely following WTO legal precepts.