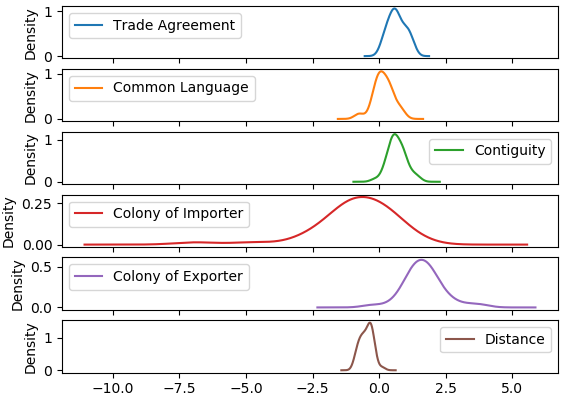
We use the estimates for the importer fixed effects analyze each sample importer’s relative restrictiveness. The importer fixed effects provide a measure of an importer’s competitiveness given their market size as measured by GDP. Countries with larger fixed effects tend to import more on average than those with smaller fixed effects, which implies that they are relatively more competitive. Because this competitiveness already accounts for market demand as proxied by GDP, we assume that competitiveness is largely governed by unobserved import restrictions. Further evidence supporting this assumption is provided later in this section.
Using the importer fixed effects, we are able to rank countries based on their estimated competitiveness and, implicitly, their estimated restrictiveness. Figure 5 provides a map in which this ranking, averaged across all estimated medical devices, is depicted. A full listing of the overall rankings can be found in table ?? in the appendix. In figure 5, countries are broken into four quantiles such that lighter countries such as Belarus (rank 1), Nicaragua (rank 6) and New Zealand (rank 11) are those that are least restrictive. Darker countries such as China (rank 126), Indonesia (rank 153) and Mali (rank 167) are the most restrictive.25
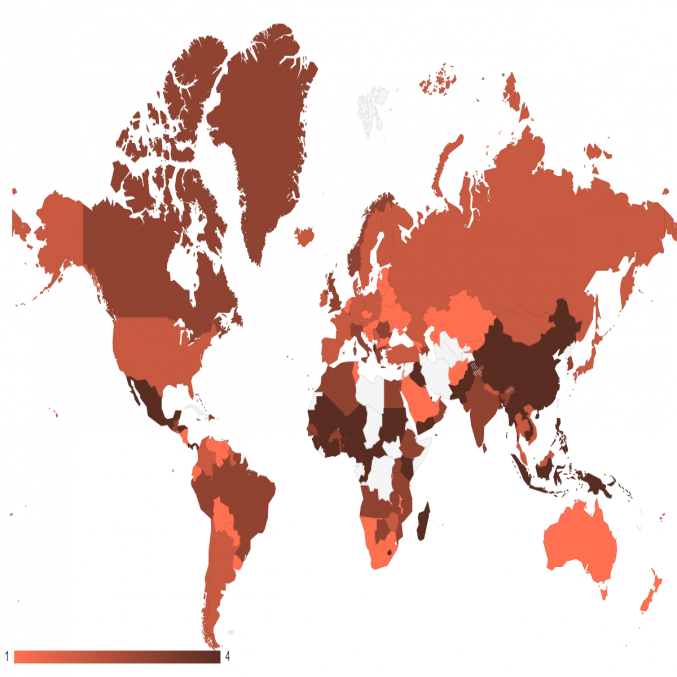
Note: 1 denotes the most competitive quartile of importers, 4 denotes the least competitive. Uncolored countries are not ranked due to a lack of available data.
The estimates of import competitiveness highlight that the key markets of Brazil (rank 92), China (rank 126), and India (rank 125), rank relatively poorly compared to the rest of the world. Given a sample of 167, these three are in the bottom half of the countries considered. Given the relatively large GDPs and populations of all three countries, as well as their bilateral relationships with exporters of medtech products, all are expected to import much more than they have been in recent years. These empirical findings are consistent with the factors influencing medtech imports noted in table 2, which suggest that NTMs affecting medtech are particularly severe in these countries compared to others.
In addition to creating a ranking of countries based on estimated restrictiveness, the importer fixed effects can be used to derive AVE trade costs associated with unobserved trade distortions. Fontagn� et al. (2011) do this by comparing each country’s fixed effect with that of the most competitive country and identifying the trade cost that would explain this difference. Because we cannot observe the cost-free importation of medical devices, the use of the least restrictive country as a benchmark for cost-free imports is the best available comparison. As such, all computed cost values are relative to that least restrictive, benchmark country.26 For example, Malawi and Belgium are each benchmark countries in two different product codes. Using this comparison and the structure of the gravity equation, we can calculate an AVE trade cost using the following equation:
| (2) |
As before, denotes the fixed effect for importer of product and denotes the corresponding fixed effect of the benchmark country. The calculated AVEs can be interpreted in the following way. For product 901839 (a subcategory of medical instruments), Belgium is the least restrictive importer while Brazil has an estimated AVE of about 34 percent. In this case, an additional tariff rate of 34 percent in Brazil above the costs present in Belgium would explain the difference between Belgian and Brazilian imports.
One additional parameter is needed in order to complete the calculation, an elasticity of substitution . The elasticity of substitution captures the extent to which an importer is likely to substitute between exports in response to price changes. Because it is not possible to directly estimate an elasticity of substitution using the specification of gravity model employed here, we draw on an estimate from the literature. Specifically, we use a value 0f 8.98, which was estimated for “medical devices” broadly by Caliendo and Parro (2015). While the selection of this elasticity does not affect the general ranking of countries based on restrictiveness, it has a large effect on the magnitude of the implied AVE costs. It is likely that this estimate is too low for any particular product category with in the general grouping of “medical devices”, resulting in particularly large estimated AVEs. Broda and Weinstein (2006) discuss the nature of substitution elasticities as goods become increasingly disaggregated, noting that higher levels of disaggregation result in greater substitutability due to the larger number close substitutes available. Put simply, substituting between products within the category of “medical devices” can be done much more readily than substitution between “medical devices” and some other product category. As such, the AVE estimates we present can be reasonably considered a high end of those face by exporters.
The estimated AVEs, averaged across products, are listed in table 5.27 The average AVEs tend to vary between about 30 percent to 130 percent, suggesting that even in the least restrictive countries, imports of medical devices face costly frictions. Individually, the average AVE for a medical device is about 59 percent, the median value is 55 percent, and the standard deviation is about 42 percentage points. In the key markets of Brazil, China and India, these AVEs are high relative to many other countries, which is consistent with their rankings noted above. The AVE for Brazil is 57 percent, China is 67 percent, and India is 60 percent. As before, all three countries exhibit estimated relative import costs above the median rate, indicating higher restrictions faced by medtech products than in other markets.
4.3 Determinants of Import Competitiveness
A limitation of this method for estimating import competitiveness and AVE costs is that it inherently attributes many aspects of a country’s import size other than GDP and the bilateral gravity variables to unobserved restrictiveness. It may be the case that relatively small import values given market size are the results of factors other than trade restrictions. In order to better validate the notion that our reporter competitiveness measures reflect import costs, we introduce a second regression that tests whether the estimated importer fixed effects, and therefore the calculated AVEs, are related to known restrictions that affect medical device trade.
Heid, Larch and Yotov (2017) note that the literature has long used a two-step approach to estimating the effects of non-discriminatory policies, specifically highlighting the methodologies’ used by Eaton and Kortum (2002), Head and Reis (2008), Anderson and Yotov (2012), and Head and Mayer (2014). In many of these papers, the two stages involve the initial estimation of a structural gravity model with the appropriate fixed effects. Second, the fixed effects are regressed against the policy variables of interest that could not be included in the initial gravity model.
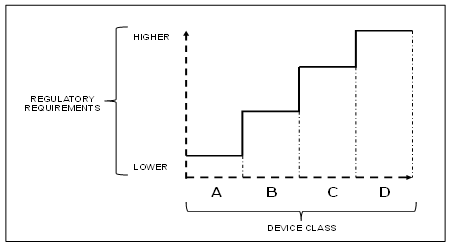
To provide evidence that the estimated import restrictiveness and AVEs of each country described above are related to restrictions rather than demand, we regress the estimated fixed effects of each country and product against a collection of variables that more directly reflect the medtech regulatory environment in each country. The first measure reflects the number of months it takes a medical device to gain regulatory approval for importation in each country. The second measure is a categorical variable that ranks the complexity of the approval process from 1 to 5. Both measures are based on information made available by Emergo Group, a consultancy that gathered this information from nearly 1,000 industry professionals worldwide.28 In both cases, these measures differ based on the country importing the device as well as the device being imported. Each HS code is classified into one of several device classes, which reflect the relative health risk of the device. In general, riskier devices are subject to stricter and lengthier approval processes. In addition to these regulatory measures, we include two measures that are reflective of the demand for medical devices in order to also identify demand influences in the estimated fixed effects. Specifically, these measures reflect the per capita healthcare spending (EIU 2018) and medical device density in each country (CPIA 2013). Due to limitations in the availability of this data, we are only able to study the relationship between them and the estimated fixed effects for a subset of the countries in the first stage gravity estimation.
The estimates for the second stage regression are present in table 3. We report six different specifications testing the robustness of the estimates with several different combinations of regulatory and demand measures. Regressions (1)–(3) include combinations of the two measures of regulatory challenges. Regressions (4)–(6) include the factors that are likely to reflect demand for medtech: medical device density and healthcare spending. Each specification was estimated using OLS. Differences in the number of observations in each specification are due to the availability of data. In each case, we used the maximum number of observations available given the respective data requirements. Because the purpose of these regressions is to show the robustness of statistical relationships rather than to compare models, we believe this is a reasonable approach in this case.
These results provide strong evidence that the competitiveness rankings of countries are reflective of the restrictiveness of each importer rather than demand for medtech. The statistically significant, negative relationship between approval time and importer competitiveness confirms that longer delays in product approval reduce competitiveness. Additionally, we find some evidence that approval complexity reduces competitiveness. Complexity, which is ranked from least complex (0) to most complex (5), appears to have some connection with competitiveness. Lower levels of complexity are associated with higher competitiveness, suggesting that moderate levels of regulation are import promoting. This finding is consistent with the work of Chen et al. (2008) who find that certain policy measures are trade improving because the increase consumer demand for the product. However, level 4 complexity significantly reduces competitiveness. The most restrictive category (5) shows no statistical relationship with competitiveness. The coefficients for medical device density and health care spending are both insignificant, lending support to the assumption that demand factors are being properly controlled for using GDP. Neither factor appears to impact the competitiveness of importers, suggesting that the rankings do accurately reflect trade restrictiveness rather than weak demand for the product.
| Variable | (1) | (2) | (3) | (4) | (5) | (6)
|
| Approval Time | -0.16*** | -0.16*** | -0.16*** | -0.14*** | ||
| (0.04) | (0.08) | (0.05) | (0.05) | |||
| Approval Complexity (2) | 0.72*** | 0.32 | -0.14 | |||
| (0.35) | (0.57) | (0.61) | ||||
| Approval Complexity (3) | 0.76*** | 0.26 | -0.16 | |||
| (0.11) | (0.44) | (0.42) | ||||
| Approval Complexity (4) | -1.61*** | -1.65*** | -2.05*** | |||
| (0.45) | (0.70) | (0.60) | ||||
| Approval Complexity (5) | 0.23 | 1.03 | -0.48 | |||
| (0.41) | (0.97) | (0.59) | ||||
| Medical Device Density | 0.000 | 0.002 | 0.002 | |||
| (0.001) | (0.003) | (0.003) | ||||
| Health Care Spending | 0.000 | 0.000 | ||||
| (0.000) | (0.000) | |||||
| Constant | -19.28*** | -20.62*** | -19.42*** | -19.18*** | -19.96*** | -19.37*** |
| (0.21) | (0.07) | (0.41) | (0.27) | (0.43) | (0.29) | |
| Rˆ2 | 0.006 | 0.009 | 0.017 | 0.007 | 0.013 | 0.006 |
| Obs. | 2764 | 7303 | 2764 | 2316 | 1941 | 1941 |
4.4 Implications for Key Emerging Markets
Our analysis suggests that the United States would likely experience a marked improvement in medtech exports to key emerging markets following the harmonization of regulatory procedures to international standards by these countries. These policies largely pertain to the conformity assessment procedures and technical regulations of China, India, and Brazil, which are characterized by duplicative testing or certifications, redundant clinical trials for high risk devices, and the imposition of onerous labeling standards; each of these requirements likely adds substantial delays to gaining market approval. Further, each of these markets would likely reduce the perceived complexity of their regulatory regimes by adopting registration procedures, such as the Regulated Product Submission (RPS), a document drafted by the IMDRF. In particular, RPS advances an electronic protocol for the submission of registration requests and standardizes the process of obtaining pre-market approvals among markets (IMDRF, 2015). Brazil and China are both members of the forum, suggesting the possibility of adopting these protocols.
Another critical finding from our analysis is that regulatory policies associated with time-delays and complexity are of more importance than demand factors within these markets. As such, key emerging markets with especially low per capita healthcare expenditures, such as China and India, would likely achieve greater import penetration by standardizing their regulatory procedures rather than simply increasing their healthcare spending.
5 Conclusion
As the United States seeks to maintain its competitive leadership within the global medtech industry, the ability to export to key emerging markets will remain an important strategy. Chief among these markets are China, India, and Brazil all three of whom maintained regulatory regimes characterized by either a moderate or high times to market and complexity. Our analysis has found that these regulatory factors exert a statistically significant impact on reducing import growth. The United States, which is the world’s largest single-country exporter of these goods and widely considered the world’s most innovative producer, is uniquely impacted by these market restrictions due to the high opportunity costs incurred from foregone revenue as devices undergo lengthy reviews in foreign markets.
As a consequence, all of these countries ranked in the bottom half of our calculations of the world’s most import competitive markets for advanced medtech, with China and India ranking especially low. This suggests that efforts by the IMDRF (and prior work of the GHTF) to harmonize international standards across global medtech markets are likely facilitate greater global trade for these products. Encouragingly, China, India, and Brazil have each adopted portions of the guidance documents from these committees in constructing their respective regulatory systems (USDOC, 2016).
Bibliography
Agarwal, Amit, Axel Baur, Shan He, Franck Le Deu, Satsheel Shrotriya, and Florian Then. MedTech in Asia: Committing at Scale to Raise Standards of Care for Patients. McKinsey Company, December 2015. https://www.mckinsey.com/industries/pharmaceuticals-and-medical-products/our-insights/~/media/98d2e02830e84e0f9cbb330e622a64e1.ashx (registration required).Advanced Medical Technology Association (AdvaMed). “Advamed Proposals for NAFTA Renegotiations.” 2017.
AdvaMed. “Medical Technology: Bringing Innovation Value to Healthcare Across Latin America.” n.d.
Anderson, James E., and Yoto V. Yotov. “Gold Standard Gravity.” NBER Working Paper 17835, 2012.
Broda, Christian and David E. Weinstein. “Globalization and the Gains From Variety.” The Quarterly Journal of Economics, 121 (2), 2016: 541—585.
Caliendo, Lorenzo and Fernando Parro. “Estimates of the Trade and Welfare Effects of NAFTA.” The Review of Economic Studies, 88 (1), 2015: 1—44.
Carusi, Mike. “21st Century Cures: Examining the Role of Incentives in Advancing Treatments and Cures for Patients.” House Committee on Energy and Commerce Subcommittee on Health Hearing Testimony. June 11, 2014.
Chen, Maggie Xiaoyang, John S. Wilson, and Tsunehiro Otsuki. “Standards and Export Decisions: Firm-level Evidence from Developing Countries.” The Journal of International Trade Economic Development, 17 (4), 2008: 501–523.
Dey, Sushmi. “Non-communicable Diseases Cause 61% of Deaths in India: WHO Report.” September 20, 2017. https://timesofindia.indiatimes.com/life-style/health-fitness/health-news/non-communicable-diseases-cause-61-of-deaths-in-india-who-report/articleshow/60761288.cms.
Dun, Michael. “Background of Brazilian GMP Compliance for Medical Device Companies.” April 2015. https://scrm.kotra.or.kr/kydbm/include/download.jsp?FILENAME=Brazil_GMP_compliance_whitepaper_Emergo_1490294941827.pdf&ATCHPATH=/was_data2/files/20170324/VC010&FILEPATH=/was_data2/files/20170324/VC010.
Eaton, Jonathan, and Samuel Kortum. “Technology, Geography, and Trade.” Econometrica 70, no. 5, 2002: 1741–79.
EIU. “China Healthcare: Industry Report.” 4th Quarter, 2017a. https://www.eiu.com/FileHandler.ashx?issue_id=1086155892&mode=pdf (requires subscription).
EIU. Medtech in China: Growth amid Policy Uncertainty, 2017b.
EIU. “China Healthcare.” May 22, 2018a. https://www.eiu.com/industry/Healthcare/asia/china/article/2016784585/healthcare-spending/2018-05-22 (requires subscription).
EIU. “Germany Healthcare.” June 1, 2018b. https://www.eiu.com/industry/Healthcare/europe/germany/article/256805809/healthcare-report-health-spending/2018-06-01 (requires subscription).
EIU. “Japan Healthcare.” June 1, 2018c.
https://www.eiu.com/industry/Healthcare/asia/japan/article/1946883178/healthcare-spending/2018-06-01 (requires subscription).
EIU. “India Healthcare: Industry Report.” Quarter 2, 2018d. https://industry.eiu.com/handlers/filehandler.ashx?issue_id=346668618\&mode=pdf (requires subscription).
EIU. “Brazil Healthcare: Industry Report.” Quarter 2, 2018e. https://industry.eiu.com/handlers/filehandler.ashx?issue_id=416888225\&mode=pdf (requires subscription).
Emergo Group (Emergo). “Compare the Time, Cost, and Complexity of Getting Regulatory Approval for Medical Devices.” December 2017a. https://www.emergobyul.com/resources/worldwide/global-regulatory-comparison-tool.
Emergo. “China Medical Device Market Overview.” 2017b. https://www.emergobyul.com/es/node/1214.
Emergo. “China CFDA Regulatory Approval Process for Medical Devices.” May 12, 2016. https://www.emergobyul.com/es/resources/china-process-chart.
Emergo. “India—Overview of Medical Device Industry and Healthcare Statistics.” May 12, 2017b. https://www.emergobyul.com/es/resources/market-india.
Emergo. “In Depth: Brazil Medical Device Approval and Compliance.” 2017e. https://www.emergobyul.com/es/resources/videos-brazil-device-registration-process.
Emergo. “Brazil—Overview of Medical Device Industry and Healthcare Statistics.” 2017e. https://www.emergobyul.com/es/resources/market-brazil.
Ernst Young. Pulse of the Industry. 2012.
Ernst and Young (EY). Pulse of the Industry 2017: As Change Accelerates, How Can Medtechs Move Ahead and Stay there? 2017. ey.com/vitalsigns.
Evaluate MedTech (Evaluate). World Preview 2017, Outlook to 2022. September 2017. https://www.evaluategroup.com/public/Reports/EvaluateMedTech-World-Preview-2017.aspx\#anchor.
Fenske, Sean, Michael Barbella, and Sam Brusco. “Top 30 Global Medical Device Companies.” Medical Product Outsourcing (MPO), July 26, 2017. https://www.mpo-mag.com/heaps/view/3670/1/?nav=top_nav.
Francis, Tracy and Michelle Mooradian. From Quantity to Quality: The Health of the Brazilian Healthcare System. September 2011. https://www.mckinsey.com/business-functions/strategy-and-corporate-finance/our-insights/the-new-global-competition-for-corporate-profits.
Fontagne, Lionel, Am�lie Guillin, and Cristina Mitaritonna. “Estimations of Tariff Equivalents for the Services Sectors.” CEPII Working Paper No. 2011-24, 2011.
Fontagne, Lionel, Cristina Mitaritonna, and Jos� E Signoret. “Estimated Tariff Equivalents of Services NTMs.” USITC Office of Economics Research Note. Washington, DC, 2016.
Economist Intelligence Unit (EIU). Medtech in China: Growth and Policy Uncertainty, 2017.
Gereffi, Gary, Karina Fernandez-Stark. Global Value Chain Analysis: A Primer. Duke Center on Globalization, Governance and Competitiveness. July 2016. https://gvcc.duke.edu/wp-content/uploads/Duke_CGGC_Global_Value_Chain_GVC_Analysis_Primer_2nd_Ed_2016.pdf.
Global Harmonization Task Force (GHTF). Label and Instructions for Use for Medical Devices, September 16, 2011.
GHTF. Principles of Medical Devices Classification. November 2, 2012. https://www.imdrf.org/docs/ghtf/final/sg1/technical-docs/ghtf-sg1-n77-2012-principles-medical-devices-classification-121102.docx.
GHTF. Principles of Conformity Assessment for Medical Devices. November 2, 2012. https://www.imdrf.org/docs/ghtf/final/sg1/technical-docs/ghtf-sg1-n78-2012-conformity-assessment-medical-devices-121102.pdf.
Giger, Silvana. “China: Challenges and Opportunities for Swiss Medtech Companies.” Switzerland Global Enterprise, June 20, 2017. https://www.s-ge.com/en/article/news/challenges-and-opportunities-swiss-medtech-companies-china.
Gurevich, Tamara and Peter Herman. “The Dynamic Gravity Dataset: 1948—2016.” USITC Economics Working Paper Series No. 2018-02-A, 2018
Head, Keith, and Thierry Mayer. “Gravity Equations: Workhorse, Toolkit, and Cookbook.” In Handbook of International Economics, Vol 4, 2014: 131—95.
Head, Keith, and John Ries. “FDI as an Outcome of the Market for Corporate Control: Theory and Evidence.” Journal of International Economics 71, no. 1, 2008: 2—20.
Heid, Benedikt, Mario Larch, and Yoto V Yotov. “Estimating the Effects of Non-Discriminatory Trade Policies within Structural Gravity Models.” CESifo Working Paper 6735, 2017.
IHS Markit. Global Trade Atlas database (accessed October 12, 2017).
IQVIA. Medical Devices in India—An Agenda to Effective Healthcare Delivery. n.d. https://www.advamed.org/sites/default/files/resource/medical_devices_in_india_-_an_agenda_to_effective_healthcare_delivery.pdf.
Johnson, Christopher. “Technical Barriers to Trade: Reducing the Impact of Conformity Assessment Measures.” U.S. International Trade Commission (USITC), Office of Industries Working Paper. September 2008.
Liu, Pearl. “China’s Market for Orthopedic Devices to See Explosive Growth,” n.d. (accessed October 10, 2017). https://stateofinnovation.com/chinas-market-for-orthopedic-devices-to-see-explosive-growth.
Luo, Ying, John Wong, and Magen Xia. “Winning in China’s Changing Medtech Market.” Boston Consulting Group, July 17, 2014. https://www.bcgperspectives.com/content/articles/Medical_Devices_Technology_Globalization_Winning_Chinas_Changing_Medtech_Market/#chapter1.
Morulaa HealthTech. “Labeling Requirements for Registration of Medical Devices in India.” n.d. https://www.morulaa.com/medical-device/labeling-requirements-drugs-cosmetics-rules/.
Okun-Kozlowicki, Jeff. “Standards and Regulations: Measuring the Link to Goods Trade.” U.S. Department of Commerce, International Trade Administration, Office of Standards and Investment Policy. June 2016.
Park, Soon-Chan. “Measuring Tariff Equivalents in Cross-Border Trade in Services.” KIEP Working Paper, 2002.
Piermartini, Roberta, and Yoto V Yotov. “Estimating Trade Policy Effects with Structural Gravity.” WTO Worrking Paper No. ERSD-2016-10, 2016.
Roxburgh, Helen. “Endless Cities: Will China’s New Urbanization Just Mean More Sprawl?” The Guardian, May 2017.
Roy, Mariana Romero. “State of the 2017 Medical Device Market in Brazil.” November 15, 2017. https://www.linkedin.com/pulse/state-2017-medical-device-market-brazil-mariana-romero-roy?trk=portfolio_article-card_title.
Santos Silva, Joao M. C., and Silvana Tenreyro. “The Log of Gravity.” The Review of Economics and Statistics 88 (4), 2006: 641—58.
SKP Group. Medical Device Industry in India. September 2017. https://www.advamed.org/issues/medical-devices-india.
Snyder, Keith. Health Care Equipment and Supplies. Standard and Poor’s Global, May 2017.
Sunesen, Eva R., Joseph F. Francois, and Martin H. Thelle. Assessment of Barriers to Trade and Investment Between the EU and Japan. November 30, 2009. https://trade.ec.europa.eu/doclib/html/145772.htm.
The World Bank. 2018. World Development Indicators. https://databank.worldbank.org. Accessed July 30, 2018.
Torsekar, Mihir. “China’s Changing Medical Device Exports.” Journal of International Commerce and Economics, January 2018a.
Torsekar, Mihir. “China Climbs the Global Value Chain for Medical Devices.” Journal of International Commerce and Economics, March 2018b.
Torsekar, Mihir. “U.S. Medical Devices and China’s Market: Opportunities and Obstacles.” U.S. International Trade Commission (USITC), Office of Industries Working Paper. June 2014.
Torsekar, Mihir. “India’s Price Controls on Coronary Stents May Place U.S. Firms at a Competitive Disadvantage.” USITC, Executive Briefing on Trade. October 2017.
United Nations Conference on Trade and Development (UNCTAD). International Classification of Non-Tariff Measures 2012 Version. 2015.
U.S. Department of Commerce (USDOC). 2016 Top Markets Report Medical Devices. May 2016.
U.S. International Trade Commission (USITC). Medical Devices and Equipment: Competitive Conditions Affecting U.S. Trade in Japan and Other Principal Foreign Markets. Publication No. 3909. Washington, DC: USITC, March 2007. https://www.usitc.gov/publications/332/pub3909.pdf.
USITC. U.S. Trade and Investment with Sub-Saharan Africa: Recent Developments. Publication No. 4780. Washington, DC: USITC, May 2018. https://www.usitc.gov/sites/default/files/publications/332/pub4780.pdf
USITC. Trade, Investment, and Industrial Policies in India: Effects on the U.S. Economy. Publication No. 4501. Washington, DC: USITC, December 2014. https://www.usitc.gov/sites/default/files/publications/332/pub4501_2.pdf.
U.S. Trade Representative (USTR). 2018 National Trade Estimate Report on Foreign Trade Barriers. Washington, DC: USTR, March 27, 2018. https://ustr.gov/sites/default/files/files/Press/Reports/2018\%20National\%20Trade\%20Estimate\%20Report.pdf.
USTR. 2016 National Trade Estimate Report on Foreign Trade Barriers. Washington, DC: USTR, March 2016. https://ustr.gov/sites/default/files/files/Press/Reports/2016\%20National\%20Trade\%20Estimate\%20Report.pdf.
World Health Organization (WHO). “Brazil.” 2014. https://www.who.int/nmh/countries/bra_en.pdf.
WHO. Western Pacific Region. “Rate of Diabetes in China ‘Explosive,’” April 6, 2016. https://www.wpro.who.int/china/mediacentre/releases/2016/20160406/en/.
World Trade Organization (WTO). Agreement on Technical Barriers to Trade. January 1, 1995. https://www.wto.org/english/docs_e/legal_e/17-tbt_e.htm.
WTO. “Minutes of the Meeting of 20-21 March 2012.” Committee on Technical Barriers to Trade May. 16, 2012. https://docs.wto.org/dol2fe/Pages/FE_Search/FE_S_S009-DP.aspx?language=E&CatalogueIdList=89001.
Wubbeke, Jost, Mirjam Meissner, Max J. Zenglein, Jaqueline Ives, and Bjorn Conrad. Made in China 2025: The Making of a High-tech Superpower and Consequences for Industrial Countries. Mercator Institute for China Studies (MERICS). Berlin: MERICS Papers on China no. 2, December 2016.
Appendix
| HS 6-digit code | Description | Trade Value ($)
|
| 300510 | Adhes Dressngs Coated or Impreg With Pharma Substs | 3,201,771,010 |
| 300590 | Sterile Surgical Catgut, Similar Sterile Sutur,Etc | 3,671,327,509 |
| 300610 | Sterile Surgical Catgut, Similar Sterile Mater Etc | 3,896,848,419 |
| 300620 | Blood-Grouping Reagents | 375,434,186 |
| 300630 | Opacifying Preparations For X-Ray Examinations Etc. | 2,678,230,645 |
| 382100 | Prepared Culture Media For Devel Of Microorganisms | 1,765,260,653 |
| 382200 | Composite Diagnostic/Lab Reagents, Exc Pharmaceut | 22,626,700,000 |
| 401519 | Gloves, Except Surgical Etc., Vulcan Rubber, Nesoi | 4,497,962,713 |
| 420600 | Articles Of Catgut,For Mfg Of Sterile Surgical Sut | 61,206,061 |
| 841920 | Medical, Surgical or Laboratory Sterilizers | 856,961,115 |
| 841990 | Parts Of Medical, Surgical or Laboratory Sterilize | 5,109,526,528 |
| 871390 | Invalid Carriages, Mechanically Propelled | 417,059,634 |
| 900130 | Contact Lenses | 5,097,971,625 |
| 901811 | Electrocardiographs, and Parts and Accessories | 840,650,228 |
| 901812 | Ultrasonic Scanning Apparatus | 3,868,010,497 |
| 901813 | Magnetic Resonance Imaging Apparatus | 4,195,833,524 |
| 901814 | Scintigraphic Apparatus | 324,965,239 |
| 901819 | Electro-Diagnostic Apparatus Nesoi, and Parts Etc. | 8,534,230,304 |
| 901820 | Ultraviolet or Infrared Ray Apparatus, & Pts & Acc | 252,671,071 |
| 901831 | Hypodermic Syringes, With or Without Their Needles | 4,502,403,000 |
| 901832 | Tubular Metal Needles & Needles For Sutures &Parts | 2,413,295,532 |
| 901839 | Med Needles. Nesoi, Catherers Etc and Parts Etc | 23,588,000,000 |
| 901850 | Other Ophthalmic Instruments & Appliances & Parts | 3,662,549,794 |
| 901890 | Instr & Appl F Medical Surgical Dental Vet, Nesoi | 46,239,700,000 |
| 902110 | orthopedic or Fractre Appliances, Parts & Accessor | 8,193,266,851 |
| 902131 | Artificial Joints and Parts and Accessories Therof | 8,691,496,629 |
| 902139 | Artificial Joints & Parts & Accessories Therof,Nes | 11,242,800,000 |
| 902140 | Hearing Aids | 3,762,185,043 |
| 902150 | Pacemakers For Stimulating Heart Muscles | 5,239,728,643 |
| 902190 | Appliances Worn,Carried,Implanted In Body&Pt,Nesoi | 11,743,500,000 |
| 902212 | Computed Tomography Apparatus | 2,841,837,916 |
| 902213 | Appts Base On X-Ray For Dental, Uses, Nesoi | 821,580,865 |
| 902214 | Appts Base On X-Ray, Medical,Surgical,Vetnry,Nesoi | 4,332,388,108 |
| 902221 | Appts Base On Alpha,Beta,Etc. Radiation,Medical,Etc. | 301,444,488 |
| 902230 | X-Ray Tubes | 1,830,476,471 |
| 902290 | X-Ray/Hi Tnsn Genr Cntr Pnl & Dsk Exm/Trtmnt Tb Pt | 6,694,386,764 |
| 902511 | Clinical Thermometers Liquid-Filled | 125,094,373 |
| 902519 | Clinical Thermometer, Nt Combined W/Oth Inst,Nesoi | 2,583,094,128 |
1Similar gravity methods were used by USITC (2018).
2Because tariffs are generally low with respect to the global trade of medtech, trade costs in this context largely refer to non-tariff measures (NTMs), particularly in the form of onerous regulatory requirements that restrict trade. Examples include duplicative product testing, redundant clinical trial data submissions, and an inadequate pricing and reimbursement system (Johnson, 2008; Sunesen, 2009). These NTMs produce regulatory environments that correspond to high approval times, are costly to comply with, and are characterized by complexity. For example, imported medtech in China may face approval times that are more than double the global average of 10 months, generated more than $50,000 in compliance costs, and were listed (alongside Brazil) as the among the world’s most complex (Emergo, 2017).
3However, variations in the categorization of devices varies across countries. For example, in the United States, the Food and Drug Administration (FDA) identifies three classes of medtech, which range from basic hospital supplies and other disposables (class I), to therapeutics and other devices that carry slightly elevated health risks but are similar to existing devices on the market (class II), to diagnostic devices which exhibit a high risk of injury or illness to a patient (class III).
4The most common QMS in the medtech industry is the ISO 13485 certification, which satisfies most of the quality assurance requirements for regulatory approval in the EU (BSI, 2016, p. 5).
5Industry representative, e-mail correspondence with authors, August 20, 2018.
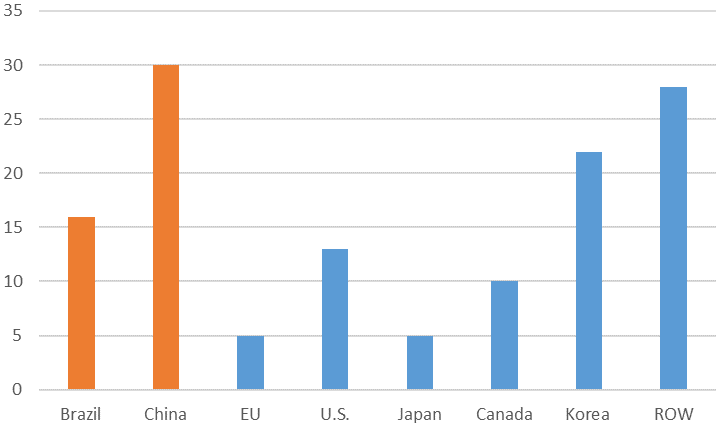
6According to Emergo Group, the EU’s maximum time to market estimates for the highest risk medtech was 9 months in sharp contrast to Japan (16 months), China (22 months), and the United States (30 months), for example.
7A strengthening U.S. dollar makes U.S. goods relatively more expensive and generally translates into reduced sales and revenues in overseas markets. Conversely, U.S. medical device OEMs benefit from a weakening U.S. dollar when entering foreign markets.
8For example, both countries fell within the top ten of medical device density out of the 67 countries profiled in a study (CHPI, 2013), suggesting relatively saturated medical device markets.
9As of 2018, the United States’ exports of medtech to each of these countries was: India (26 percent), Brazil (31 percent), and China (33 percent).
10Urbanization is often associated with many public health risks—including various non-communicable diseases such as lung cancer, cardiovascular disease, diabetes, and hypertension. These risks largely reflect the increased consumption of high-calorie, processed foods; the transition away from farming towards more sedentary occupations; and the relatively poor air quality that often accompanies city living (Torsekar, 2014).
11Officially known as Order No. 650, the Regulations for the Supervision and Administration of Medical Devices.
12Industry representative, e-mail correspondence with authors, August 28, 2018.
13It should be noted that price controls are classified as a type of NTM that is distinct from the conformity assessment procedures discussed earlier (UNCTAD 2012).
14Industry representative, e-mail correspondence with authors, August 28, 2018.
15Industry representative, e-mail correspondence with author, August 7, 2018.
16Brazil uses a similar risk based classification as the EU and categorizes devices into four classes.
17Industry representative, e-mail correspondence with author, August 7, 2018.
18Industry representative, e-mail correspondence with authors, August 20, 2018.
19Industry representatives note that this has been less of a problem in recent years. Industry representative, e-mail correspondence with authors, August 20, 2018.
20Industry representative, e-mail correspondence with author, August 7, 2018.
21Industry representative, e-mail correspondence with authors, August 20, 2018.
22Industry representative, e-mail correspondence with authors, August 20, 2018.
23United Nations Statistics Division. UN Comtrade. https://comtrade.un.org/
24The years 2012–2015 were chosen based on the availability of HS12 classified trade data, available after 2012, and GDP data, which was only widely available up to 2015 at the time of writing.
25Uncolored countries are those for which insufficient data was available for estimation.
26That is, the AVEs are effectively normalized to the benchmark estimated AVE countries. The benchmark country will have an AVE cost of zero percent and estimates for other countries should be interpreted as being in addition to the unidentifiable AVE of the benchmark.
27A more complete listing of computed AVEs by country or product is available by request.
28These data are available at the Emergo website: https://www.emergobyul.com/resources/worldwide/global-regulatory-comparison-tool?field_market_tid=All&cost=All&field_device_risk_value=3.
