
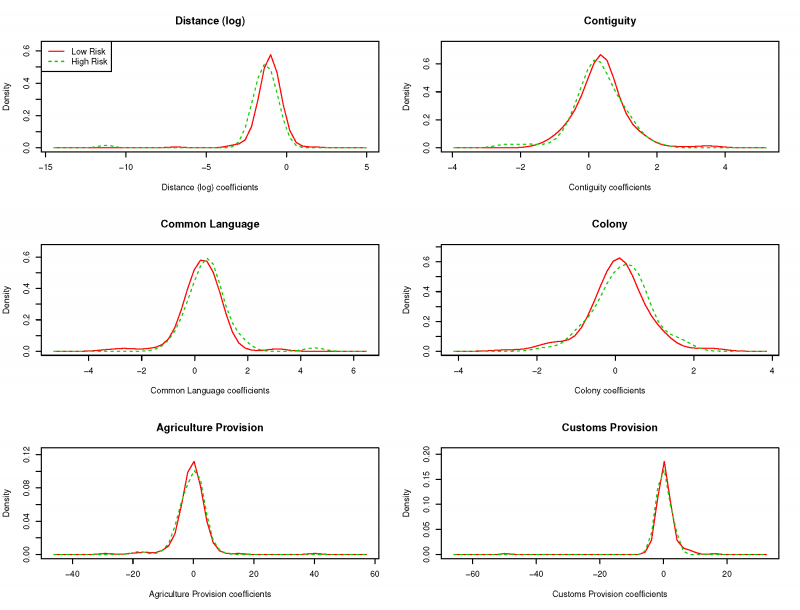
Figure 1: Kernel density plots of coefficient estimates in each sector using the initial set of gravity
variables
THE GRAVITY OF SPS RISK
Lesley Ahmed
Peter Herman
Caroline Peters
David Riker
ECONOMICS WORKING PAPER SERIES
Working Paper 2017–11–A
U.S. INTERNATIONAL TRADE COMMISSION
500 E Street SW
Washington, DC 20436
November 2017
Office of Economics working papers are the result of ongoing professional research of USITC Staff and are solely meant to represent the opinions and professional research of individual authors. These papers are not meant to represent in any way the views of the U.S. International Trade Commission or any of its individual Commissioners. Working papers are circulated to promote the active exchange of ideas between USITC Staff and recognized experts outside the USITC and to promote professional development of Office Staff by encouraging outside professional critique of staff research.
The Gravity Of SPS Risk
Lesley Ahmed, Peter Herman, Caroline Peters, and David Riker
Office of Economics Working Paper 2017–11–A
Abstract
As the frequency and magnitude of sanitary and phytosanitary (SPS) issues continues to grow worldwide, understanding the impact that these issues have on agricultural trade is becoming increasingly important. This paper uses a novel, product-centric approach to shed light on this topic. Using characteristics of products such as freshness or preparation method, we classify agricultural products as exhibiting either high or low SPS risk based on their relative likelihood of posing a danger to the human, animal, or plant health concerns that SPS measures address. This classification is then used within a collection of gravity trade models to estimate differences in trade patterns between high and low risk goods. We find that high risk goods exhibit higher trade costs based on several measures and that both types of goods face differing impacts from trade agreements providing for customs improvements or regulatory harmonization. Meanwhile, neither category of good experiences significant effects from trade facilitation efforts that either primarily lower tariffs or address indirectly-related aspects of trade such as intellectual property or services.
JEL Classification: F14, Q17
Lesley Ahmed
Office of Industries
U.S. International Trade Commission
Peter Herman (Corresponding Author)
Office of Economics
U.S. International Trade Commission
peter.herman@usitc.gov
Caroline Peters
Office of Economics
U.S. International Trade Commission
David Riker
Office of Economics
U.S. International Trade Commission
In recent years, non-tariff measures (NTMs) have gained considerable attention in international trade. As tariffs worldwide have largely disappeared, NTMs have grown both in the number of measures applied by countries as well as in relative effect as they become, in many cases, the most considerable barrier to trade faced by firms. This is especially true in the case of sanitary and phytosanitary (SPS) measures, which countries apply to ensure food safety; protect humans, animals, and plants from contaminants, diseases, disease-causing organisms, and pests; and to prevent damage from the entry and spread of pests. The number of SPS measures recorded by the World Trade Organization (2017) has grown by nearly 9.4 percent on average per year from 189 measures in 1995 to 936 measures in 2016.
Given this growth in SPS measures, understanding the effects of these measures on trade it is increasingly important. In this paper, we analyze the relationship between SPS issues and bilateral trade. Using a gravity modeling framework, we show that agricultural products that are especially sensitive to SPS risks exhibit different trading patterns than less sensitive agricultural products. High sensitivity goods exhibit higher trade costs with respect to several measures between trading partners. Similarly, high sensitivity products experience statistically different impacts from trade facilitating preferential trade agreements (PTA), particularly those that include provisions for regulatory harmonization and customs improvements. Meanwhile, other efforts to liberalize trade, such as those focusing primarily on tariff reductions or indirectly-related aspects of trade such as services or intellectual property provisions, exhibit limited impact on either high or low risk agricultural products, in general or relative to one another.
This paper is a new entry into the growing literature seeking to quantify the effects of non-tariff measures. Much of this literature has relied on gravity models to assess the extent to which NTMs may increase or decrease the cost or level of trade.1 For example, Fontagné et al. (2011) infer the restrictiveness of NTMs using importer fixed effects to compare the relative openness of countries, which they use to calculate a tariff-rate equivalent for each country. Kee et al. (2009) use a slightly different approach, employing data on the incidence of certain types of NTMs to identify the trade costs associated with the measures. For a more in-depth survey of different types of quantification methodologies, see Abbyad and Herman (2017).
Like NTMs more generally, SPS measures have the potential to be either trade-facilitating or trade-diminishing depending upon the nature of the measures themselves and the breadth of their implementation. Nimenya et al. (2012) find that SPS measures can be trade catalysts when they reduce information asymmetries in the market, allowing easier comparison of quality attributes across markets subject to different public and private SPS requirements. Doing so increases the impact of food product origin as a factor in product differentiation. Drogué and DeMaria (2012) and Winchester et al. (2012) have found the harmonization of SPS standards to be trade-increasing, although the effect on exports is not uniformly positive as some countries lose their differentiated edge when standards converge. Crivelli and Groeschl (2016) find that if exporters are able to overcome the fixed costs associated with compliance, SPS measures are trade increasing as consumers are reassured of the quality of foreign products.
On the other hand, SPS measures can act as a trade deterrent when they diverge from the general WTO principles of nondiscrimination, scientific evidence, risk assessment, and least-trade-restrictive alternatives. Exports from developing countries to high-income countries are the most negatively impacted by the implementation of SPS measures, as the costs of compliance are relatively steeper in countries with weaker institutions and less developed agrofood supply chains (see, for example, Disdier et al. (2008), Li and Beghin (2011), Melo et al. (2014), and Henson and Jaffee (2008)). With regards to the intensive margin, the multiple sets of standards imposed by various regulatory bodies - large private sector actors in the agrofood supply chain, public sector actors in destination markets, and governing authorities within multilateral organizations - present barriers to market entry for new exporters and make full harmonization of SPS measures difficult overall, as identified by Henson and Jaffee (2008). Moenius (2006) and Tothova and Oehmke (2008) argue that the trade-diminishing impact of SPS measures can also work at the extensive margin, with harmonization efforts restricting the number of varieties available overall, limiting consumer choice and welfare. Work by Fontagné et al. (2015) using firm level data provides supporting evidence that both the intensive and extensive margins of trade are negatively affected by the presence of SPS measures and that this effect is more severe for smaller firms.
Work by Nimenya et al. (2012), Rickard and Lei (2011), and Calvin and Krissoff (1998) has revealed that that the magnitude of welfare gains from removing SPS measures depend largely on the commodity being traded and whether the risk that measures are protecting against is transferable. Calvin and Krissoff (1998) in particular, find that unlike with tariffs, policymakers must consider both scientific and economic consequences with the imposition of new SPS measures, weighing the decrease in food safety risk against the potential losses to consumers and producers.
The work presented here builds off of this research by studying the relationship between bilateral trade determinants and SPS concerns. Unlike most of this research that uses the incidence of SPS measures to identify trade impacts, we take a product-centric approach that identifies goods that are most prone to the types of issues that SPS measures attempt to mitigate. We divide agricultural product categories into two groups depending on whether the product category faces high or low SPS risks. High risk goods are those that are especially susceptible to the health and disease risks covered by SPS measures. Using this grouping, we analyze the trade implications for each group using gravity models to infer differences in trading behavior. A key benefit of this alternative, product-centric approach is that our results are more closely connected to the health and safety aspects of SPS policies because there is no ex-ante need to determine if a measure is inefficiently distortionary as identification is not directly based on the policies in place.
The paper proceeds as follows. Section 2 describes our approach to SPS risk and the categorization of agricultural goods. Section 3 describes the data and gravity methodology used for the analysis and presents our findings. Section 4 concludes.
Some products pose greater risk to human, plant, and animal health than other products because of their inherent characteristics and tendency to carry pests, diseases, or organisms. Similarly, the nature of how a product is consumed or used can make it susceptible to SPS risk, such as whether it is for direct human consumption or undergoes heat treatment before it is consumed. In this paper, we define SPS risk based on whether a product is inherently sensitive to these concerns. Specifically, a product is considered high SPS risk if it is:
A few examples of high SPS risk products are dairy products, beef, live plants, and fresh cut flowers. A few examples of lower SPS risk products are vegetable oils, pasta, wool, and dried vegetables. A full list of the HS 4-digit codes used in the analysis and their respective risk categorization can be found in table 5. Of the 210 agricultural product categories, 56 are classified as high risk; the remaining are considered low risk.
Traditionally, researchers examining the trade effects of SPS measures and technical barriers to trade (TBT) categorize products based on the number of SPS measures or other NTMs they face. These categorizations, while different from our inherent risk classification, unsurprisingly feature some considerable similarities because products that pose greater SPS risk tend to have more SPS measures applied by importing countries. Prior research on this topic has employed several different strategies to identify products subject to SPS measures. Disdier et al. (2008) summarize some common measures to identify potential barriers, using a simple dummy and frequency index along with calculated AVEs to estimate their effect. Fontagné et al. (2005) examine the number countries that had made WTO SPS notifications for products at the HS 4-digit level. Not surprisingly, the products they label as “sensitive,” with at least 40 countries notifying SPS measures to the WTO, are similar to the group of products we categorize as high risk—including meat products, milk products, flowers, and fresh fruits and vegetables. The products not labeled as “sensitive” exclude many processed food products and are also similar to our SPS risk categorization. Grant and Arita (2017), who examine the incidence and length of specific trade concerns raised at the WTO SPS committee meetings, find the highest incidence of SPS specific trade concerns were in meat and edible offal, fresh fruits and nuts, live animals, dairy products, and edible vegetables, roots and tubers. They find no SPS specific trade concerns for gums, resins and vegetable saps, preparation of cereals, flour, starches, and pastry; and tobacco and tobacco products. These, again, are in line with our classification.
In addition to the SPS sensitivity data that we produced, several other data sources were combined in order to create the gravity dataset used in the analysis.
Trade data was downloaded from COMTRADE.2 We utilize a cross section consisting of 55 countries for the year 2015. For each country pair, the data includes all reported trade flows belonging to 210 HS2007, 4-digit codes, representing all agriculture products. Any codes not exhibiting positive trade flows between a given country pair is assumed to be an untraded sector and is included as a zero so that the panel is square. As described above, each of these products was designated as being high or low SPS risk using a dummy variable taking the value of one if a product is deemed to be high risk. Recall that a high risk product or sector is one that, because of its inherent nature or general use, poses greater risk to human, animal, and/or plant health. Of the 210 HS 4-digit categories considered, 56 are identified as having high SPS risk.
Gravity variables were primarily sourced from the Gurevich et al. (2017) extension to the CEPII database.3 These variables include GDPs, shared common language, population weighted distance, contiguity, colonial relationships, and preferential trade agreements (PTA). In later specifications, additional preferential trade agreement data from the World Bank’s Content of Deep Trade Agreements dataset was integrated (see Hofmann et al. (2017)).4 This additional data provides more granular information on the type of trade agreements that country pairs belong to as well as the numerous types of provisions they may or may not exhibit. Specifically, we utilize variables indicating provisions in trade agreements that target the liberalization of agricultural trade restrictions, customs transparency, the affirmation and harmonization of SPS measures, trade-related aspects of intellectual property, and trade in services.5 Additionally, we include data that divides the general PTA indicator into three specific types of agreements: customs unions (CU), economic integration agreements (EIA), and free trade agreements (FTA).
The objective of this research is to identify the ways in which sensitivity to SPS risks impacts aspects of trade. Given its strength in quantifying the bilateral determinants of trade, the gravity model represents an ideal tool for doing so. To identify these SPS influences, we employ several gravity specifications that highlight differences in trade patterns between high and low SPS risk agriculture products. These specifications thoroughly explore these relationships by testing the robustness of the identified differences with respect to both aggregation and several fixed effect strategies. In total, four specifications were considered.
Each of the specifications was estimated using a Poisson Pseudo Maximum Likelihood estimator.6 PPML procedures have become standard in gravity research due to their ability to incorporate zero-value trade flows and superior treatment of heteroskedasticity.
The first specification follows traditional methods employed in gravity modeling in which trade flows are aggregated at the country pair level. That is, a single observation reflects aggregate trade between two partners in the agriculture products considered. In this case, we differentiate between high and low sensitivity goods by constructing two aggregations. One aggregation includes only those goods listed as being high risk, the other includes only low risk. Once aggregated according to risk, the following gravity specification was estimated:
| (i) |
Indexes and denote exporter and importer respectively. The variable denotes the trade value of exports from to while denotes the following collection of gravity variables: contiguity, common language, distance, colony, and PTA. Identification of differences between high and low risk goods is determined by comparing the respective coefficients for the trade determinants.
The remaining specifications utilize disaggregated data in an effort to better identify the nuances present at the product or sector level. For this purpose, we consider three different specifications. The first of these specifications does not attempt to control for sector-level variation, including only importer and exporter fixed effects. The second specification includes an additional set of product level fixed effects corresponding to each of the HS 4-digit codes included in our sample. Specifically, these two specifications take the following forms, respectively:
| (ii) |
| (iii) |
The additional index denotes the product and denotes the dummy variable reflecting SPS risk for product . In these two cases, the effects of SPS sensitivity are identified through the inclusion of the dummy for SPS risk that takes the value of one if a product is high risk and its interaction with the other bilateral determinants.
The fourth specification controls for importer-sector and exporter-sector variation by estimating a separate model for each of the products considered. By estimating each separately, the fixed effects are allowed to vary across sectors.7 Because products are estimated separately, the identification of differences between high and low risk products relies on non-parametric methods. Specifically, we report Kolmogorov-Smirnov statistics for each variable that determines if the distribution of coefficients, conditional on risk type, differs in a statistically significant way.
The results for specifications (i)-(iii) are presented in table 1. A summary of the results for specification (iv) over all sectors is presented in table 2. Additionally, kernel-density plots of the estimated coefficients for each sector are provided in figure 1.
| (i) | (i) | (ii) | (iii)
| |||||
| (High SPS Risk) | (Low SPS Risk) | |||||||
| Contiguity | 0.452*** | (0.120) | 0.349*** | (0.102) | 0.394*** | (0.094) | 0.394*** | (0.094) |
| Common Language | 0.442*** | (0.108) | 0.187 | (0.111) | 0.200 | (0.104) | 0.200 | (0.104) |
| Log Distance | -0.868*** | (0.066) | -0.821*** | (0.054) | -0.798*** | (0.052) | -0.798*** | (0.052) |
| Colony | -0.045 | (0.160) | 0.239 | (0.131) | 0.193 | (0.145) | 0.193 | (0.145) |
| PTA | 0.767*** | (0.105) | 0.230** | (0.084) | 0.260** | (0.086) | 0.260** | (0.086) |
| SPS Risk | 0.236 | (0.522) | 5.792*** | (0.697) | ||||
| Contiguity * SPS Risk | -0.049 | (0.150) | -0.049 | (0.150) | ||||
| Language * SPS Risk | 0.120 | (0.128) | 0.120 | (0.128) | ||||
| Distance * SPS Risk | -0.056 | (0.059) | -0.056 | (0.059) | ||||
| Colony * SPS Risk | -0.044 | (0.203) | -0.044 | (0.203) | ||||
| PTA * SPS Risk | 0.547*** | (0.142) | 0.547*** | (0.142) | ||||
| Constant | 5.065*** | (0.837) | 8.797*** | (0.562) | 3.295*** | (0.550) | -2.691*** | (0.649) |
| Importer, Exporter F.E. | yes | yes | yes | yes | ||||
| Sector F.E. | no | no | no | yes | ||||
| N | 2886 | 2886 | 606060 | 606060 | ||||
Standard errors clustered at the country pair level in parentheses. *** , ** , * .
| Variable | Low Risk | High Risk | K-S test stat. | K-S p-value
| ||
| Mean | S.D. | Mean | S.D. | |||
| Distance (log) | -1.223 | (0.855) | -1.596 | (1.451) | 0.274 | 0.003 |
| Contiguity | 0.332 | (0.908) | 0.244 | (0.797) | 0.115 | 0.605 |
| Common Language | 0.205 | (0.827) | 0.554 | (0.835) | 0.164 | 0.197 |
| Colony | -0.101 | (1.303) | 0.131 | (0.638) | 0.170 | 0.164 |
| PTA | 0.518 | (1.296) | 0.972 | (1.170) | 0.305 | 0.001 |
In each specification, the results are generally consistent with previous literature. As is typically expected, contiguity, common language, and PTAs are trade facilitating while geographic distance is trade deterring. With regards to the relationships between trade determinants and SPS risk, we find several consistent results. First, when accounting for sector-specific fixed effects in specification (iii), we find that high SPS risk goods trade more on average than low SPS risk goods. There are several possible explanations for this trend. By their nature, high risk goods tend to be fresh and seasonal, relying to a higher degree on seasonal trade for year-round availability than other agricultural products. Similarly, the fresh nature of these goods likely implies that they are generally of a higher quality and more prone to trade than their preserved or otherwise prepared, low risk counterparts in the vein of the so-called “Washington Apples” effect. Finally, the SPS risks of the goods may themselves be a reflection of the fact that they trade more; the high risk goods may be characterized as high risk because of past SPS incidences encountered during trade.
Second, specification (iv) finds that high risk goods are particularly sensitive to distance. Increased distance, which is often interpreted as being representative of transport time and costs, are especially impactful to high risk goods. This is likely a reflection of the relatively greater risk of rot and and other quality degradations inherent in the higher SPS risk products.
Finally, we find that under all four specifications, PTAs are significantly more influential in increasing trade among high risk goods. This finding suggests that policies put in place by countries that restrict trade are especially onerous to goods that face higher sensitivity to SPS issues. Because the existence of a PTA between countries is a rather blunt measure of trade facilitation, there are several possible explanations for why these agreements have a stronger influence on high risk goods. Because of the added complexity of trading high risk goods, efforts to reduce barriers to trade likely affect these goods more significantly because there is a larger potential gain from doing so. Additionally, many trade agreements—particularly in recent years—focus increasingly on NTMs, which will affect SPS sensitive goods more significantly.8 An outcome of this trend is a general reduction in the burden of NTMs, a mitigation on the delays faced at borders, and an improvement in the efficiency of achieving the desired SPS safety measures.
In light of these findings, we considered an additional sequence of specifications that aim to decompose the effect of PTAs on trade—and SPS sensitive goods in particular—into more granular measures of preferential treatment. Specifically, we replace the PTA variable in the original specifications with a collection of eight variables characterizing aspects of trade agreements. Three of these variables represent special types of provisions included in agreements covering agriculture, customs procedures and transparency, and SPS concerns, respectively. These types of provisions were selected due to their anticipated direct effects on the trade of agricultural products. Two of the variables represent membership of both trading parties to the multi-party Agreement on Trade-Related Aspects of Property Rights (TRIPS) and General Agreement on Trade in Services (GATS), respectively. These agreements were selected in order to identify potential spillovers from other trade liberalization efforts that may indirectly support the trade of certain agricultural products. The remaining three variables identify membership to a specific class of PTA—namely CU, EIA, or FTA—that may each have their own unique impacts on trade. By introducing these eight additional variables, we are able to better identify some of the specific aspects of trade agreements that drive the effects of PTAs observed in the previous collection of estimates.
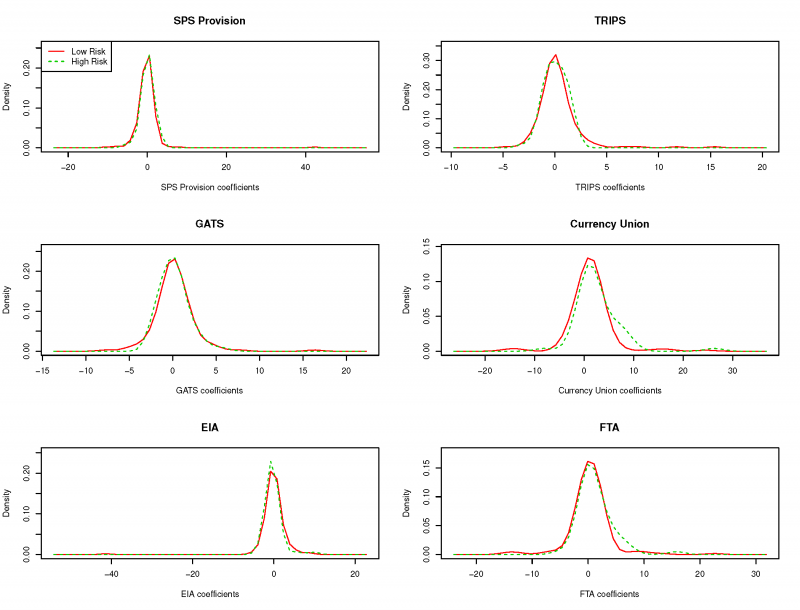
The gravity results corresponding to this second collection of variables are presented in table 3 for specifications (i)-(iii). Summary statistics for the results of the individual sector estimates of specification (iv) are presented in table 4 and as kernel density plots in figures 2 and 3.9 As before, the standard gravity components exhibit the expected effects. Of the added PTA variables, several exhibit interesting relationships with agricultural goods in general and high or low risk goods in particular.
| (i) | (i) | (ii) | (iii)
| |||||
| (High SPS Risk) | (Low SPS Risk) | |||||||
| Contiguity | 0.494*** | (0.113) | 0.338*** | (0.098) | 0.393*** | (0.092) | 0.393*** | (0.092) |
| Common Language | 0.436*** | (0.107) | 0.261* | (0.107) | 0.221* | (0.104) | 0.221* | (0.104) |
| Log Distance | -0.770*** | (0.064) | -0.710*** | (0.055) | -0.753*** | (0.056) | -0.753*** | (0.056) |
| Colony | 0.062 | (0.148) | 0.373** | (0.122) | 0.335* | (0.134) | 0.335* | (0.134) |
| Agricultural Provisions | 0.533 | (0.470) | -0.633 | (0.359) | -0.478 | (0.292) | -0.478 | (0.292) |
| Customs Provisions | 0.110 | (0.232) | 0.910** | (0.329) | 0.664** | (0.230) | 0.664** | (0.230) |
| SPS Provisions | 0.387* | (0.193) | -0.194 | (0.201) | -0.073 | (0.155) | -0.073 | (0.155) |
| TRIPS | 0.096 | (0.168) | -0.010 | (0.190) | -0.045 | (0.156) | -0.045 | (0.156) |
| GATS | -0.724** | (0.230) | 0.376 | (0.225) | 0.269 | (0.214) | 0.269 | (0.214) |
| Customs Union | 0.901* | (0.377) | 0.493 | (0.262) | 0.475 | (0.250) | 0.475 | (0.250) |
| EIA | 0.096 | (0.211) | 0.027 | (0.218) | -0.037 | (0.195) | -0.037 | (0.195) |
| FTA | 0.261 | (0.363) | -0.152 | (0.207) | -0.038 | (0.189) | -0.038 | (0.189) |
| High SPS Risk | -1.575* | (0.667) | 3.981*** | (0.780) | ||||
| Contiguity * High Risk | 0.011 | (0.145) | 0.011 | (0.145) | ||||
| Language * High Risk | 0.244 | (0.131) | 0.244 | (0.131) | ||||
| Distance * High Risk | 0.138 | (0.077) | 0.138 | (0.077) | ||||
| Colony * High Risk | -0.112 | (0.187) | -0.112 | (0.187) | ||||
| Ag. Prov. * High Risk | 1.456** | (0.562) | 1.456** | (0.562) | ||||
| Cust. Prov. * High Risk | -0.406 | (0.360) | -0.406 | (0.360) | ||||
| SPS Prov. * High Risk | 0.369 | (0.246) | 0.369 | (0.246) | ||||
| TRIPS * High Risk | 0.489* | (0.229) | 0.489* | (0.229) | ||||
| GATS * High Risk | -0.762** | (0.270) | -0.762** | (0.270) | ||||
| CU * High Risk | -0.181 | (0.414) | -0.181 | (0.414) | ||||
| EIA * High Risk | 0.190 | (0.209) | 0.190 | (0.209) | ||||
| FTA * High Risk | -0.601 | (0.374) | -0.601 | (0.374) | ||||
| Constant | 8.121*** | (0.706) | 8.172*** | (0.646) | 3.806*** | (0.617) | -2.662*** | (0.749) |
| Importer, Exporter F.E. | yes | yes | yes | yes | ||||
| Sector F.E. | no | no | no | yes | ||||
| N | 2886 | 2886 | 606060 | 606060 | ||||
Standard errors clustered at the country pair level in parentheses. *** , ** , * .
| Variable | Low Risk | High Risk | K-S test stat. | K-S p-value
| ||
| Mean | S.D. | Mean | S.D. | |||
| Distance (log) | -1.140 | (1.027) | -1.531 | (1.462) | 0.244 | 0.013 |
| Contiguity | 0.354 | (0.855) | 0.274 | (0.738) | 0.125 | 0.502 |
| Common Language | 0.233 | (0.961) | 0.523 | (0.858) | 0.143 | 0.339 |
| Colony | -0.052 | (1.400) | 0.215 | (0.673) | 0.213 | 0.042 |
| Agriculture Provision | -0.504 | (7.817) | -1.282 | (5.716) | 0.138 | 0.380 |
| Customs Provision | 0.649 | (6.401) | 0.017 | (2.343) | 0.185 | 0.106 |
| SPS Provision | -0.589 | (5.967) | 0.240 | (2.125) | 0.185 | 0.106 |
| TRIPS | 0.496 | (4.419) | 0.113 | (1.343) | 0.091 | 0.855 |
| GATS | 0.328 | (2.708) | 0.025 | (2.769) | 0.096 | 0.810 |
| Customs Union | 0.892 | (5.466) | 3.107 | (5.963) | 0.192 | 0.086 |
| EIA | 0.025 | (4.835) | -0.165 | (2.128) | 0.149 | 0.289 |
| FTA | -0.039 | (5.396) | 1.864 | (5.255) | 0.162 | 0.206 |
Of the three types of special provisions included in the model specification—agriculture, customs, and SPS—each exhibits some specific influence on agricultural trade.
First, agricultural provisions facilitate trade in high risk agricultural products significantly more than low risk products within the frameworks of specifications (ii) and (iii).10 However, when controlling for country-sector specific effects under specification (iv), there is limited statistical difference between high and low risk goods. Agricultural provisions, which reflect both tariff and non-tariff liberalizations on agricultural products, represent a slightly complicated case to analyze due to how common they are. According to Hofmann et al. (2017), agricultural provisions are present in 99.6 percent of trade agreements covered by the World Bank’s database. Thus, it is likely that the variable is only identifying general trade facilitation effects, which are also being picked up in other variables, potentially explaining the inconsistencies between specifications (i)-(iii) and (iv).
By comparison, customs provisions appear to be effective at increasing the trade of agricultural goods in general but do not exhibit a statistical difference in their effects on high or low risk goods under most specifications. However, specification (iv) suggests that customs provisions are relatively more trade facilitating for low risk goods at close to a ten percent significance level. This relatively stronger impact for low risk goods may suggest that high risk goods, for which long clearance times tend to result is substantial depreciation of value such as rot, already experience special customs consideration outside of those identified by the variable. Thus, the broad provisions for customs transparency and clearance improvements controlled for here may largely represent improvements for non-fresh agricultural products not already covered.
Finally, SPS provisions, which reflect the harmonization of measures targeting the types of risks inherent to the studied products, exhibit limited influence on trade in agricultural goods generally or goods of a specific risk. The exception to this is specification (iv), which suggests that SPS provisions are more influential to high risk goods, again at a nearly ten percent confidence level. This provides some support for the idea that NTM harmonization is trade facilitating.
The two measures representing membership to the TRIPS and GATS largely reinforce the initial observations that agricultural goods benefit from general trade facilitation. Both agreements represent efforts to improve trade by reducing costs, alleviating barriers, and addressing other frictions faced by IP sensitive goods and cross-border services. TRIPS, which targets intellectual property issues in trade, is relatively more facilitating for high risk goods than low risk goods under specifications (ii) and (iii). This relationship may be reflective of more sophisticated and proprietary IP embedded in the high risk goods, which tend to be fresh and of higher quality. Meanwhile, the GATS appears to be more facilitating for low risk goods under specifications (ii) and (iii). This observation may be related to that made above with regards to the effects of customs provisions. It may well be the case that the general services considerations have limited additional impact on high risk goods because they already exhibit special considerations due to the sensitivity of the goods. However, under specification (iv), neither TRIPS nor GATS exhibits significant differences across risk types when sectoral effects are permitted to vary across importers and exporters. This suggests that when controlling for variations in the types of products countries import and export, such as technology intensity in the case of TRIPS, these indirectly related trade agreements no longer disproportionately benefit high or low SPS risk goods. This observation provides further evidence that it is the specific provisions addressing aspects of certain high or low risk goods rather than general or indirect trade facilitation because the interaction between the country fixed effects and the sectors will have diluted the varying role of technology or services highlighted above.
The remaining three variables characterizing the type of agreement that both partners belong to—CU, EIA, and FTA—exhibit slightly curious results. Under most specifications, none of these types of agreements appear to be significant determinants of trade or exhibit large differences between high and low risk goods. This observation suggests that much of the trade facilitating behavior identified using the broadly defined PTA variable from the initial collection of gravity variables, which included agreements in all three categories, is specific to certain types of provisions rather than general trade facilitation. That is, the positive effects of trade agreements are more closely tied to specific cases in which provisions address the goods being traded rather than spillovers resulting from increased economic cooperation. This observation also provides support for the first of the two effects described above with respect to the TRIPS and GATS. If it is generally the case that specific types of provisions are what cause increases in trade flows, it is likely that the positive effect that these two agreements have is reflective of their provisions for IP and services rather than more general, indirect liberalization. The one exception to this observation is that under specification (iv), customs unions are significantly more trade facilitating for high risk goods. This observation is consistent with much of the other results in that a customs union reflects general regulatory cooperation in addition to tariff reductions. As a result, it is not surprising that customs unions exhibit stronger effects on regulation-sensitive, high SPS risk goods when estimated at the sector level and controlling for country effects at that level.
These results, all taken together, provide strong evidence for several aspects of trade and SPS risk. High risk goods appear to be consistently affected by aspects of trade that slow the flow of goods from exporter to importer. The shortening of distances between trading partners and the introduction of policies that mitigate regulatory burdens through transparency and cooperation tend to increase the trade of high risk goods significantly more than low risk goods. These results suggest that policymakers with specific industries in mind ought to consider intrinsic characteristics of their goods when they design trade policy as not all goods are affected equally. Furthermore, the observed evidence suggests that increasing trade in specific types of products requires the introduction of agreements and provisions that directly target the products in question. Broad agreements representing general and indirect liberalizations do not appear to consistently increase trade in a specific subsets of products, namely high and low SPS risk agricultural goods.
Curiously, many of the results are sensitive to the model specification. In light of this, it is important to reassess these specifications in terms of model selection. Due to the important influences of sector specific fixed effects within the model, specification (iv) is our preferred specification. Of the four specifications, (iv) is the one the best controls for sector specific idiosyncrasies. There are many reasons for which a particular country may not import or export a particular HS 4-digit category that are unrelated to either SPS risk or trade costs. For example, a country in a temperate climate will likely never be a large exporter of certain agricultural products, regardless of their trade agreements or other trade costs. Specification (iv) with the additional trade agreement variables provides for the best control of this type of effect and the strongest identification strategy.
As such, our preferred interpretation of the results follows those reflecting the specification (iv) estimates. In summary, distance and colonial ties, which both represent proxies for trade costs between partners, indicate that high risk goods benefit from cost reductions relatively more than low risk goods. Similarly, trade facilitation efforts in the form of trade agreements generally affect high risk goods more when they address issues that directly affect aspects of the goods being traded. More broadly defined, indirectly-related trade facilitation measures, or those that primarily lower tariffs rather than address regulatory harmonization, do not exhibit statistical differences in their effects when comparing high and low risk goods.
In addition to the specific results regarding the trade determinants of high and low SPS risk agricultural goods, these findings provide interesting insight into the ways in which economic research studies SPS issues and NTMs more broadly. As discussed in the introduction, most research assesses the effects of NTMs on trade by studying the effects of the measures themselves rather than by directly studying the product characteristics that have inspired the measures. Our findings provide evidence that this alternative, product-focused approach can return economically interesting policy implications while foregoing any need to ex-ante differentiate between non-tariff measures that address socially desirable issues and those that are either domestic protection efforts veiled as NTMs or unnecessarily burdensome due inefficiently designed measures (i.e. NTBs). Assuming that the trade agreements that countries enter into and the provisions included within tighten regulatory efficiency rather than concede socially desirable measures, the policy effects identified by our results are related only to protectionism or the inefficient application of NTMs. As such, this product-focused approach represents a promising strategy for future NTM research.
SPS concerns and the measures put in place to address them significantly influence trading patterns. Using a novel approach of identifying SPS issues by noting the agricultural goods for which SPS human, plant, and animal health risks are highest, we have observed several consistent trends. The estimates from several gravity model specifications suggest that high risk goods experience higher standards costs to trade as measured by distance between partners and, under the preferred specification, colonial relationships. Similarly, high risk goods tend to benefit more from trade facilitation in the form of preferential trade agreements broadly or specific types of facilitation such as customs unions or SPS provisions specifically. Likewise, high risk goods tend to be less affected by specific customs provisions than low risk goods. Neither category of goods appears to exhibit significant differences with respect to other trade facilitation efforts that primarily lower tariffs or address indirectly-related aspects of trade, such as the TRIPS or GATS.
This work provides evidence that the risks underlying SPS measures exhibit specific nuances that ought to be considered when designing trade policies and, more specifically, SPS measures. In general, it appears that high risk SPS agricultural goods rely to a greater degree on trade facilitation policies than do lower risk goods. Furthermore, increasing trade in these high risk goods tends to require the introduction of policies that target specific issues related to SPS sensitivity rather than spillovers from broader liberalization efforts. Efforts to facilitate (or deter) trade in specific types of agricultural products ought to be composed of these types of attributes in order to be most effective.
In addition to providing insight into the trading patterns around SPS issues, this work also shows that a product-centric approach to the analysis on NTM issues can generate useful perspective on the ways in which NTMs prohibit trade. Unlike most research, which studies these issues through the lens of applied measures that may exist with multiple underlying motives, the presence of SPS risk in a product is not subject to politicking, rent-seeking, protectionism, or administrative inefficiency. The trends identified here are those associated only with actual health SPS concerns, bypassing any need to pass judgment on the scientific validity of any measures. For this reason, analysis of trade determinants using similar product-centric approaches can provide valuable information for designing measures that effectively provide the desired social protections while avoiding the introduction of inefficient barriers to trade.
This work opens the door for several promising avenues for further research extending the findings here. First, the incorporation of a panel dataset covering more years would provide better identification of the effects of preferential trade relationships by taking advantage of variation in membership overtime. A longer time series would also help answer lingering questions about the effects of longer-lived trade agreements. Second, the estimates could be used to parameterize general equilibrium experiments, such as those described in Baier and Bergstrand (2009), in order to simulate the effects of policy changes. Such work could, for example, better describe or predict the impacts of signing ”deeper” trade agreements on specific markets by incorporating their SPS risk characteristics into the assessment.
Abbyad, N. and P. Herman (2017). How Much Do Non-Tariff Measures Cost? A Survey of Quantification Methods.
Baier, S. L. and J. H. Bergstrand (2009). Bonus vetus OLS: A simple method for approximating international trade-cost effects using the gravity equation. Journal of International Economics 77, 77–85.
Calvin, L. and B. Krissoff (1998). Technical barriers to trade: A case study of phytosanitary barriers and U.S.-Japanese apple trade. Journal of Agricultural and Resource Economics 23(2), 351–366.
Crivelli, P. and J. Groeschl (2016). The Impact of Sanitary and Phytosanitary Measures on Market Entry and Trade Flows. World Economy 39(3), 444–473.
Disdier, A. C., L. Fontagné, and M. Mimouni (2008). The impact of regulations on agricultural trade: Evidence from the SPS and TBT agreements. American Journal of Agricultural Economics 90(2), 336–350.
Drogué, S. and F. DeMaria (2012). Pesticide residues and trade, the apple of discord? Food Policy 37(6), 641–649.
Fontagné, L., A. Guillin, and C. Mitaritonna (2011). Estimations of Tariff Equivalents for the Services Sectors.
Fontagné, L., M. Mimouni, and J.-M. Pasteels (2005). Estimating the Impact of Environmental SPS and TBT on International Trade. Integration and Trade Journal 9(22(1)), 7–37.
Fontagné, L., G. Orefice, R. Piermartini, and N. Rocha (2015). Product standards and margins of trade: Firm-level evidence. Journal of International Economics 97(1), 29–44.
Grant, J. and S. Arita (2017). Sanitary and Phyto-Sanitary Measures : Assessment , Measurement , and Impact.
Gurevich, T., P. Herman, S. Shikher, and R. Ubee (2017). Extending the CEPII Gravity Data Set.
Henson, S. and S. Jaffee (2008). Understanding developing country strategic responses to the enhancement of food safety standards. World Economy 31(4), 548–568.
Hofmann, C., A. Osnago, and M. Ruta (2017). Horizontal Depth: A New Database on the Content of Preferential Trade Agreements.
Kee, H. L., A. Nicita, and M. Olarreaga (2009). Estimating Trade Restrictiveness Indices. The Economic Journal 119(534), 172–199.
Li, Y. and J. C. Beghin (2011). A meta-analysis of estimates of technical barriers to trade. Journal of Policy Modeling (34), 497–511.
Melo, O., A. Engler, L. Nahuehual, G. Cofre, and J. Barrena (2014). Do Sanitary, phytosanitary, and quality-related standards affect international trade? Evidence from Chilean fruit exports. World Development 54, 350–359.
Moenius, J. (2006). The Good , the Bad and the Ambiguous : Standards and Trade in Agricultural Products. In IARTC Summer Symposium.
Neufeld, N. (2014). Trade Facilitation Provisions in Regional Trade Agreements: Traits and Trends.
Nimenya, N., P. F. Ndimira, and B. H. De Frahan (2012). Tariff equivalents of nontariff measures: The case of European horticultural and fish imports from African countries. Agricultural Economics 43, 635–653.
Rickard, B. J. and L. Lei (2011). How important are tariffs and nontariff barriers in international markets for fresh fruit? Agricultural Economics 42(supplement), 19–32.
Santos Silva, J. M. C. and S. Tenreyro (2006). The Log of Gravity. The Review of Economics and Statistics 88 (4)(4), 641–658.
Tothova, M. and J. F. Oehmke (2008). To Regulate Or Not? The Trade-Off Between Food Safety and Consumer Choice. Journal of International Agricultural Trade and Development 4(1), 63–82.
Winchester, N., M.-L. Rau, C. Goetz, B. Larue, T. Otsuki, K. Shutes, C. Wieck, H. L. Burnquist, M. J. Pinto de Souza, and R. Nunes de Faria (2012). The Impact of Regulatory Heterogeneity on Agri-food Trade. World Economy 35(8), 973–993.
World Trade Organization (2017). Sanitary and Phytosanitary Information Management System.
1In the past, NTMs have often been referred to as non-tariff barriers (NTBs). Although subtle, there is an important distinction between the terms NTM and NTB in modern convention. A measure can be put in place for a wide variety of reasons. Some of these reasons target important social objectives such as ensuring food safety or environmental protections. Other measures may be put in place for purely protectionist purposes similar to tariffs. A measure falling onto this latter category is generally considered an NTB. By comparison, the term NTM makes no such judgment regarding the protective nature of the measure and may be either protective or intended to provide a legitimate social benefit.
2https://comtrade.un.org/data/
3Available for download from https://www.usitc.gov/sites/default/files/publications/332/grav_data_1948to2015_for_posting.zipx
4Available for download from https://data.worldbank.org/data-catalog/deep-trade-agreements
5These provisions correspond to the variables wto_p_ftaag, wto_p_cust, wto_p_sps, wto_p_trips, and wto_p_gats, respectively.
6See Santos Silva and Tenreyro (2006)
7Alternatively, a specification including importer-sector and exporter-sector fixed effects would control for mostly the same variation but was computationally infeasible given the sample.
8See Neufeld (2014) for a discussion of these recent trends in trade agreements.
9There are several sectors for which there is an insufficient amount of observed trade or variation for estimation to be possible using the added PTA variables. In these cases, the unestimated coefficients are omitted from the reported statistics.
10The results of specification (i) are also suggestive of this but much less significantly so.